

The DOI matches its Crossref record; 78 of the 78 references it cites were found in a registry or an index.
Changes in Kidney Function Do Not Differ Between Healthy Adults Consuming Higher-Compared with Lower- or Normal-Protein Diets: A Systematic Review and Meta-Analysis
Open accessAbstract
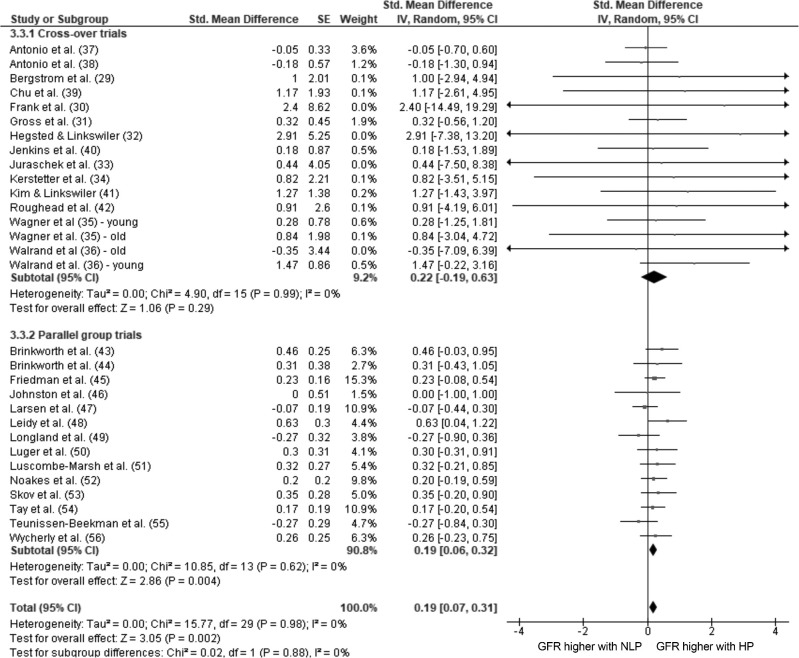
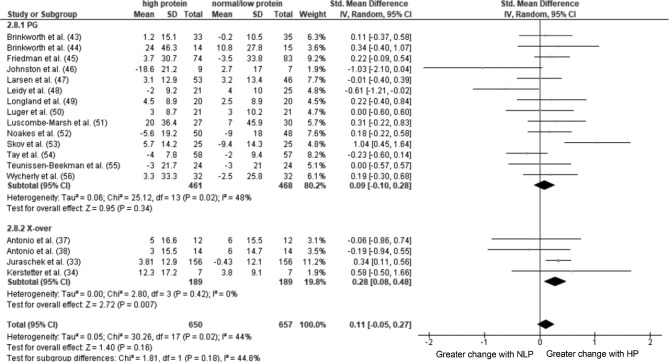
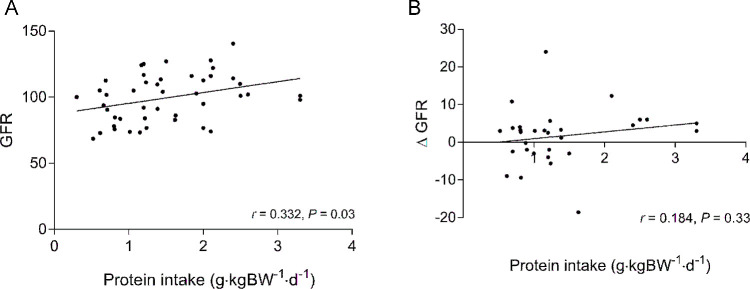
Background: Higher-protein (HP) diets are advocated for several reasons, including mitigation of sarcopenia, but their effects on kidney function are unclear. Objective: This meta-analysis was conducted to determine the effect of HP intakes on kidney function in healthy adults. Methods: We conducted a systematic review and meta-analysis of trials comparing HP (≥1.5 g/kg body weight or ≥20% energy intake or ≥100 g protein/d) with normal- or lower-protein (NLP; ≥5% less energy intake from protein/d compared with HP group) intakes on kidney function. Medline and EMBASE databases were searched. Randomized controlled trials comparing the effects of HP with NLP (>4 d duration) intakes on glomerular filtration rate (GFR) in adults without kidney disease were included. Results: A total of 2144 abstracts were reviewed, with 40 articles selected for full-text review; 28 of these were analyzed and included data from 1358 participants. Data were analyzed using random-effects meta-analysis (RevMan 5; The Cochrane Collaboration), meta-regression (STATA; StataCorp), and dose-response analysis (Prism; GraphPad). Analyses were conducted using postintervention (post) GFR and the change in GFR from preintervention to post. The post-only comparison showed a trivial effect for GFR to be higher after HP intakes [standardized mean difference (SMD): 0.19; 95% CI: 0.07, 0.31; P = 0.002]. The change in GFR did not differ between interventions (SMD: 0.11; 95% CI: -0.05, 0.27; P = 0.16). There was a linear relation between protein intake and GFR in the post-only comparison (r = 0.332, P = 0.03), but not between protein intake and the change in GFR (r = 0.184, P = 0.33). The main limitation of the current analysis is the unclear risk of selection bias of the included trials. Conclusions: Postintervention GFR comparisons indicate that HP diets result in higher GFRs; however, when changes in GFR were compared, dietary protein had no effect. Our analysis indicates that HP intakes do not adversely influence kidney function on GFR in healthy adults.
Overview
The claims and statistics of this paper haven’t been checked yet.
Free: it reads the open-access text and checks the first 5 claims that cite a source we can check. Create a free account to check every claim.
Integrity signals
Registry
Cites
Statistics
Figures

Verification
Claims the paper makes
The claims and statistics of this paper haven’t been checked yet.
Free: it reads the open-access text and checks the first 5 claims that cite a source we can check. Create a free account to check every claim.
Claims other papers make about this one
Each is checked against this paper’s own text: does it say what the citing paper says it does?
The source backs part of the claim, not all of it — or backs it for a different population, condition or comparison.
In the citing paper
“It is worth noting that traditional concerns with high protein intakes (i.e. adverse effects on kidney, liver, and bone health) lack evidentiary support in healthy populations [123–128].”
From International Society of Sports Nutrition position stand: diets for body weight reduction (2026) · cites this paper as [126]
Experimental — accuracy not yet measuredThe cited source says what the claim attributes to it.
In the citing paper
“Concerns about kidney safety have not been confirmed in individuals with normal kidney function who consume at least 1.5 g per kg of body weight per day of protein [137].”
From Dietary and Behavioral Strategies for Weight Loss and Weight Loss Maintenance: A Narrative Review (2025) · cites this paper as [137]
Self-check
Percentages, sums and reported differences re-computed from the paper’s own numbers.
The self-check needs the paper’s full text.
Citations
Cites
KDIGO 2024 clinical practice guideline for the evaluation and management of chronic kidney disease
Stevens, P. E., Ahmed, S. B., Carrero, J. J., Foster, B., Francis, A., Hall, R. K., Herrington, W. G., Hill, G., Inker, L. A., Kazancıoğlu, R., et al. (2024) · Kidney International · doi:10.1016/j.kint.2023.10.018 · Cited by 8,530
GRADE guidelines: 3. Rating the quality of evidence
Balshem, H., Helfand, M., Schünemann, H. J., Oxman, A. D., Kunz, R., Brozek, J., Vist, G. E., Falck-Ytter, Y., Meerpohl, J., & Norris, S. (2011) · Journal of Clinical Epidemiology · doi:10.1016/j.jclinepi.2010.07.015 · Cited by 8,285 · cited 1×
“In GRADE, when assessing certainty, RCTs start as high; however, serious or very serious issues across 5 domains may reduce the certainty of: 1) risk of bias, 2) inconsistency, 3) imprecision, 4) indirectness, and 5) publication bias (23).”
BackgroundSterne, J. A. C., Sutton, A. J., Ioannidis, J. P. A., Terrin, N., Jones, D. R., Lau, J., Carpenter, J., Rucker, G., Harbord, R. M., Schmid, C. H., et al. (2011) · BMJ · doi:10.1136/bmj.d4002 · Cited by 7,709 · cited 1×
“Last, when funnel plot asymmetry existed in the presence of heterogeneity, then the results from both fixedand random-effects models were compared to verify that the results of the random-effects meta-analysis were not greater than those of the fixed-effects model (21).”
ResultTrumbo, P., Schlicker, S., Yates, A. A., & Poos, M. (2002) · Journal of the American Dietetic Association · doi:10.1016/s0002-8223(02)90346-9 · Cited by 5,993
What is ‘quality of evidence’ and why is it important to clinicians?
Guyatt, G. H., Oxman, A. D., Kunz, R., Vist, G. E., Falck-Ytter, Y., & Schünemann, H. J. (2008) · BMJ · doi:10.1136/bmj.39490.551019.be · Cited by 3,250 · cited 1×
“Certainty in the evidence means to what extent the estimates in treatment effect are correct or close to the truth (22).”
BackgroundProtein and amino acid requirements in human nutrition.
(2007) · PubMed · Cited by 2,767
Bauer, J., Biolo, G., Cederholm, T., Cesari, M., Cruz-Jentoft, A. J., Morley, J. E., Phillips, S., Sieber, C., Stehle, P., Teta, D., et al. (2013) · Journal of the American Medical Directors Association · doi:10.1016/j.jamda.2013.05.021 · Cited by 2,553 · cited 1×
“HP intake (compared with the RDA) has also been advocated for older persons to preserve skeletal muscle mass loss due to sarcopenia (4, 5).”
BackgroundSelf-citationMeta-analyses involving cross-over trials: methodological issues
Elbourne, D. R., Altman, D. G., Higgins, J. P., Curtin, F., Worthington, H. V., & Vail, A. (2002) · International Journal of Epidemiology · doi:10.1093/ije/31.1.140 · Cited by 2,305 · cited 1×
“Because of the risk of carryover in crossover trials, the use of post values, not change from baseline, is preferred when including crossover trials in a meta-analysis (79).”
MethodEpstein, F. H., Brenner, B. M., Meyer, T. W., & Hostetter, T. H. (1982) · New England Journal of Medicine · doi:10.1056/nejm198209093071104 · Cited by 2,075 · cited 3×
“Broadly stated, the thesis that protein affects kidney function is that with persistent consumption of an HP diet the increased renal solute load (as urea) is an antecedent step leading to compensatory hyperfiltration, which then leads to glomerular damage and eventual kidney damage and failure (9).”
BackgroundInfluentialPlasma aldosterone regulation in anephric man
Walker, W. G., & Cooke, C. R. (1973) · Kidney International · doi:10.1038/ki.1973.1 · Cited by 1,841
Research works printed but not linked: 1
- 2001, Proceedings of the 10th World Congress on Medical Informatics, Part 1. Volume 84 of Studies in health technology and informatics
Cited by
Dietary Protein and Muscle Mass: Translating Science to Application and Health Benefit
Carbone, J. W., & Pasiakos, S. M. (2019) · Nutrients · doi:10.3390/nu11051136 · Cited by 198
“This finding held true across non-dairy animal, animal, and plant protein sources and neither glomerular filtration rate (GFR) nor blood creatinine concentrations were related to dietary protein content.”
BackgroundInfluentialBeneficial Effects of Soybean-Derived Bioactive Peptides
Kim, I.-S., Yang, W., & Kim, C. (2021) · International Journal of Molecular Sciences · doi:10.3390/ijms22168570 · Cited by 169
“In a meta-analysis of patients with CKD, bean-based products were shown to greatly decrease the level of proteinuria and blood creatinine, inter alia, despite a lower increase in the glomerular filtration rate [110].”
BackgroundHengeveld, L. M., Boer, J. M. A., Gaudreau, P., Heymans, M. W., Jagger, C., Mendonça, N., Ocké, M. C., Presse, N., Sette, S., Simonsick, E. M., et al. (2020) · Journal of Cachexia Sarcopenia and Muscle · doi:10.1002/jcsm.12580 · Cited by 132
Givens, D. I. (2020) · Journal of Dairy Science · doi:10.3168/jds.2020-18296 · Cited by 139
Slater, G. J., Dieter, B. P., Marsh, D. J., Helms, E. R., Shaw, G., & Iraki, J. (2019) · Frontiers in Nutrition · doi:10.3389/fnut.2019.00131 · Cited by 88
Metadata
- Authors
- Devries, M. C., Sithamparapillai, A., Brimble, K. S., Banfield, L., Morton, R. W., & Phillips, S. M.
- Affiliations
- University of Waterloo (CA)
- McMaster University (CA)
- Corresponding author
- Phillips, Stuart M
- ORCID
- Venue
- The Journal of Nutrition
- Publisher
- Elsevier BV
- Published
- 2018-11
- Volume
- 148
- Issue
- 11
- Pages
- 1760-1775
- ISSN
- 0022-3166 (ISSN-L)
- PMC
- PMC6236074
- OpenAlex
- W2899097956
- Cited by
- 108
- References
- 78
- Citations by year
- 2026: 24 · 2025: 10 · 2024: 9 · 2023: 10 · 2022: 11 · 2021: 14 · 2020: 17 · 2019: 12 · 2018: 1
- FWCI
- 1.24
- Type
- journal article
- Language
- en
- Open access
- hybrid
- doi.org
- Licence
- cc-by-nc
- www.elsevier.com/tdm/userlicense/1.0/ (tdm)
- creativecommons.org/licenses/by-nc/4.0/ (vor)
- Locations
- Journal of Nutrition (publishedVersion, cc-by-nc)
- Europe PMC (PubMed Central) (publishedVersion, cc-by-nc)
- PubMed Central (publishedVersion, cc-by-nc)
- PubMed (publishedVersion)
- Topics
- Health Sciences › Nursing › Nutrition and Dietetics › Muscle metabolism and nutrition
- Health Sciences › Medicine › Nephrology › Chronic Kidney Disease and Diabetes
- Health Sciences › Medicine › Physiology (medical) › Diet and metabolism studies
- Keywords
- protein intake, renal function, glomerular filtration rate, healthy adults, sarcopenia, dose-response relationship, proteinuria, kidney disease risk, sarcopenia interventions, sarcopenia prevention, sarcopenia treatment, sarcopenia screening
- MeSH terms
- Adult, Dietary Proteins, Glomerular Filtration Rate, Humans, Diet, Protein-Restricted
About these checks
Registry, retraction, Cites and statistics results are computed, not judged, with one exception: a printed reference that no index lists is read once by a model before it counts as a citation error. Claims are extracted by a model and kept only when their quote appears verbatim in the text; each cited source is then checked, with a model’s help, for whether it says what the claim relies on. Those verdicts can be wrong — read the claim’s quote and the cited source before relying on one.
Statistics and arithmetic are recomputed, not judged.
Confidence bands are shown only for fields calibrated on our annotated test set. None is calibrated yet, so no band is shown.
What counts as a claim ›How we measure confidence ›How we check this ›
Are you an author, or do you see a problem with this page? Request a review
How to cite
Cite CoChat for the checks on this page, and the paper for its own findings.
- This page
- CoChat. (2026). Citation check: Changes in Kidney Function Do Not Differ Between Healthy Adults Consuming Higher-Compared with Lower- or Normal-Protein Diets: A Systematic Review and Meta-Analysis. https://app.cochat.ai/papers/10.1093/jn/nxy197
- The paper
- Devries, M. C., Sithamparapillai, A., Brimble, K. S., Banfield, L., Morton, R. W., & Phillips, S. M. (2018). Changes in Kidney Function Do Not Differ Between Healthy Adults Consuming Higher-Compared with Lower- or Normal-Protein Diets: A Systematic Review and Meta-Analysis. The Journal of Nutrition. https://doi.org/10.1093/jn/nxy197
Data sources
Bibliographic data: Semantic Scholar, OpenAlex, Crossref.
Contains information from the Semantic Scholar Academic Graph Datasets, made available under the ODC Attribution License (ODC-BY 1.0).
Semantic Scholar’s data is described in: Kinney, R., et al. (2023). The Semantic Scholar Open Data Platform. arXiv:2301.10140.
