

The DOI matches its Crossref record; 62 of the 64 references it cites were found in a registry or an index.
Circular RNAs are long-lived and display only minimal early alterations in response to a growth factor
Open accessAbstract
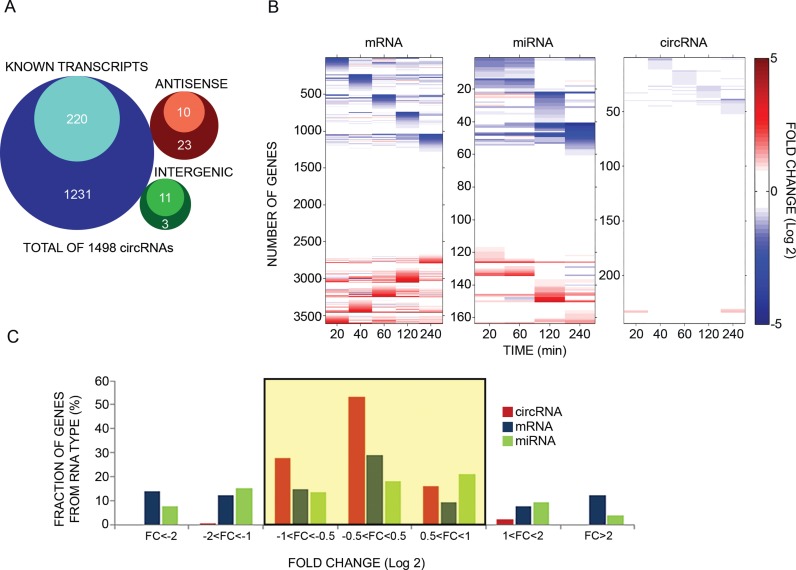
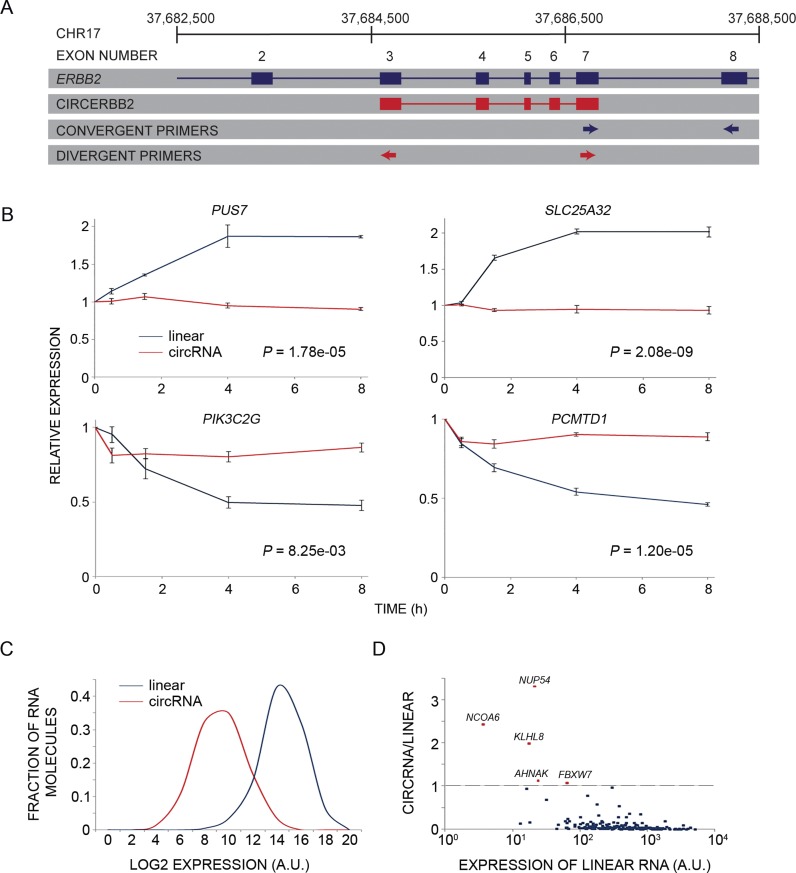
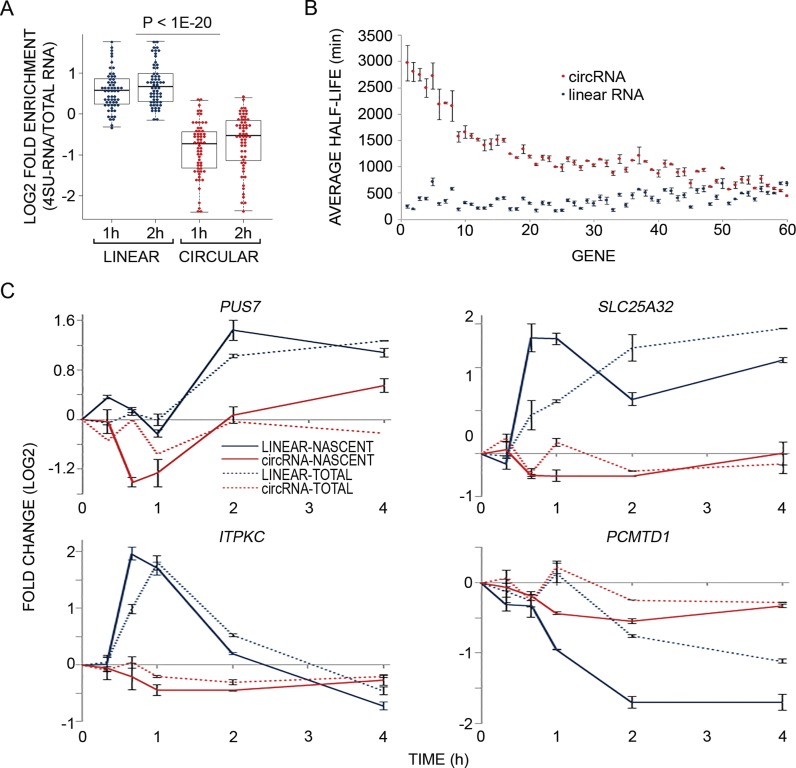
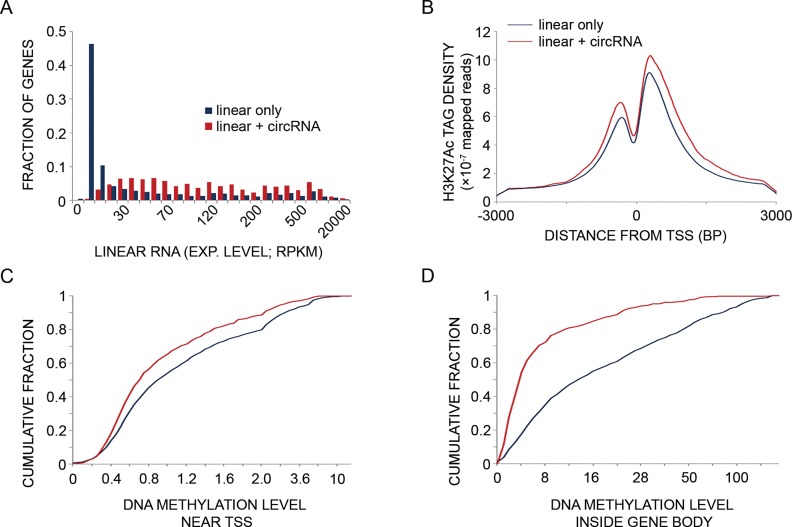
Circular RNAs (circRNAs) are widespread circles of non-coding RNAs with largely unknown function. Because stimulation of mammary cells with the epidermal growth factor (EGF) leads to dynamic changes in the abundance of coding and non-coding RNA molecules, and culminates in the acquisition of a robust migratory phenotype, this cellular model might disclose functions of circRNAs. Here we show that circRNAs of EGF-stimulated mammary cells are stably expressed, while mRNAs and microRNAs change within minutes. In general, the circRNAs we detected are relatively long-lived and weakly expressed. Interestingly, they are almost ubiquitously co-expressed with the corresponding linear transcripts, and the respective, shared promoter regions are more active compared to genes producing linear isoforms with no detectable circRNAs. These findings imply that altered abundance of circRNAs, unlike changes in the levels of other RNAs, might not play critical roles in signaling cascades and downstream transcriptional networks that rapidly commit cells to specific outcomes.
Overview
The claims and statistics of this paper haven’t been checked yet.
Run the check — free, no account needed. It reads the open-access text and checks the sources it cites.
Integrity signals
Registry
Cites
Statistics
Figures
Verification
Claims the paper makes
The claims and statistics of this paper haven’t been checked yet.
Run the check — free, no account needed. It reads the open-access text and checks the sources it cites.
Claims other papers make about this one
Each is checked against this paper’s own text: does it say what the citing paper says it does?
The cited source says what the claim attributes to it.
In the citing paper
“endogenous circRNAs lack the free ends necessary for exonuclease-mediated degradation, rendering them resistant to several mechanisms of RNA turnover and granting them extended lifespans as compared to their linear mRNA counterparts2, 9.”
From Engineering circular RNA for potent and stable translation in eukaryotic cells (2018) · cites this paper as [9]
Self-check
Percentages, sums and reported differences re-computed from the paper’s own numbers.
The self-check needs the paper’s full text.
Citations
Cites
Fast gapped-read alignment with Bowtie 2
Langmead, B., & Salzberg, S. L. (2012) · Nature Methods · doi:10.1038/nmeth.1923 · Cited by 56,400
MicroRNAs: Target Recognition and Regulatory Functions
Bartel, D. P. (2009) · Cell · doi:10.1016/j.cell.2009.01.002 · Cited by 20,068
Heinz, S., Benner, C., Spann, N., Bertolino, E., Lin, Y. C., Laslo, P., Cheng, J. X., Murre, C., Singh, H., & Glass, C. K. (2010) · Molecular Cell · doi:10.1016/j.molcel.2010.05.004 · Cited by 13,382
Circular RNAs are a large class of animal RNAs with regulatory potency
Memczak, S., Jens, M., Elefsinioti, A., Torti, F., Krueger, J., Rybak, A., Maier, L., Mackowiak, S. D., Gregersen, L. H., Munschauer, M., et al. (2013) · Nature · doi:10.1038/nature11928 · Cited by 7,990
Natural RNA circles function as efficient microRNA sponges
Hansen, T. B., Jensen, T. I., Clausen, B. H., Bramsen, J. B., Finsen, B., Damgaard, C. K., & Kjems, J. (2013) · Nature · doi:10.1038/nature11993 · Cited by 7,985
Li, J.-H., Liu, S., Zhou, H., Qu, L.-H., & Yang, J.-H. (2014) · Nucleic Acids Research · doi:10.1093/nar/gkt1248 · Cited by 4,686
Circular RNAs are abundant, conserved, and associated with ALU repeats
Jeck, W. R., Sorrentino, J. A., Wang, K., Slevin, M. K., Burd, C. E., Liu, J., Marzluff, W. F., & Sharpless, N. E. (2013) · RNA · doi:10.1261/rna.035667.112 · Cited by 4,388
The multilayered complexity of ceRNA crosstalk and competition
Tay, Y., Rinn, J., & Pandolfi, P. P. (2014) · Nature · doi:10.1038/nature12986 · Cited by 3,910
MicroRNA Targeting Specificity in Mammals: Determinants beyond Seed Pairing
Grimson, A., Farh, K. K.-H., Johnston, W. K., Garrett-Engele, P., Lim, L. P., & Bartel, D. P. (2007) · Molecular Cell · doi:10.1016/j.molcel.2007.06.017 · Cited by 3,766
circRNA biogenesis competes with pre-mRNA splicing
Ashwal-Fluss, R., Meyer, M., Pamudurti, N. R., Ivanov, A., Bartok, O., Hanan, M., Evantal, N., Memczak, S., Rajewsky, N., & Kadener, S. (2014) · Molecular Cell · doi:10.1016/j.molcel.2014.08.019 · Cited by 3,083
Cited by
Sorted by citations
The biogenesis, biology and characterization of circular RNAs
Kristensen, L. S., Andersen, M. S., Stagsted, L. V. W., Ebbesen, K. K., Hansen, T. B., & Kjems, J. (2019) · Nature Reviews Genetics · doi:10.1038/s41576-019-0158-7 · Cited by 4,823
The Biogenesis, Functions, and Challenges of Circular RNAs
Li, X., Yang, L. C., & Chen, L. (2018) · Molecular Cell · doi:10.1016/j.molcel.2018.06.034 · Cited by 2,060
The expanding regulatory mechanisms and cellular functions of circular RNAs
Chen, L. (2020) · Nature Reviews Molecular Cell Biology · doi:10.1038/s41580-020-0243-y · Cited by 1,726
The emerging roles of circRNAs in cancer and oncology
Kristensen, L. S., Jakobsen, T., Hager, H., & Kjems, J. (2021) · Nature Reviews Clinical Oncology · doi:10.1038/s41571-021-00585-y · Cited by 1,273
Past, present, and future of circRNAs
Patop, I. L., Wüst, S., & Kadener, S. (2019) · The EMBO Journal · doi:10.15252/embj.2018100836 · Cited by 1,237
“An in vitro study of 60 circRNAs in cell culture using 4-thiouridine metabolic labeling demonstrated that most of the assayed circRNAs have longer half-lives (18.8 – 23.7 h) than their linear counterparts (4.0 – 7.4 h; Enuka et al , 2016).”
InfluentialCircular RNAs: Characterization, cellular roles, and applications
Liu, C., & Chen, L. (2022) · Cell · doi:10.1016/j.cell.2022.04.021 · Cited by 1,094
Goodall, G. J., & Wickramasinghe, V. O. (2020) · Nature reviews. Cancer · doi:10.1038/s41568-020-00306-0 · Cited by 1,090
Engineering circular RNA for potent and stable translation in eukaryotic cells
Wesselhoeft, R. A., Kowalski, P. S., & Anderson, D. G. (2018) · Nature Communications · doi:10.1038/s41467-018-05096-6 · Cited by 853
History, Discovery, and Classification of lncRNAs
Jarroux, J., Morillon, A., & Pinskaya, M. (2017) · Advances in experimental medicine and biology · doi:10.1007/978-981-10-5203-3_1 · Cited by 895
Structure and Degradation of Circular RNAs Regulate PKR Activation in Innate Immunity
Liu, C., Li, X., Nan, F., Jiang, S., Gao, X., Guo, S.-K., Xue, W., Cui, Y., Dong, K., Ding, H., et al. (2019) · Cell · doi:10.1016/j.cell.2019.03.046 · Cited by 811
“circRNAs Are Significantly Downregulated in Cells upon Poly(I:C) Treatment or Viral Infection As circRNAs are stable in examined cells and tissues under normal conditions (Enuka et al., 2016; Zhang et al., 2016b), we”
Circular RNAs: Promising Biomarkers for Human Diseases
Zhang, Z., Yang, T., & Xiao, J. (2018) · EBioMedicine · doi:10.1016/j.ebiom.2018.07.036 · Cited by 768
“[1] Stability: due to the covalently closed loop structure lacking of free 5′ and 3′ ends, circRNA molecules are highly resistant to exonuclease RNase R, which makes themmuchmore stable compared to linear RNAs [6,34].”
BackgroundCircular RNA Vaccines against SARS-CoV-2 and Emerging Variants
Qu, L., Yi, Z., Shen, Y., Lin, L., Chen, F., Xu, Y., Wu, Z., Tang, H., Zhang, X., Tian, F., et al. (2021) · doi:10.1101/2021.03.16.435594 · Cited by 636
“5 times longer than their linear mRNA isoforms in mammalian cells (Enuka et al., 2016; Kristensen et al., 2019; Memczak et al., 2013).”
A Network of Noncoding Regulatory RNAs Acts in the Mammalian Brain
Kleaveland, B., Shi, C. Y., Stefano, J., & Bartel, D. P. (2018) · Cell · doi:10.1016/j.cell.2018.05.022 · Cited by 610
EGFR in Cancer: Signaling Mechanisms, Drugs, and Acquired Resistance
Uribe, M. L., Marrocco, I., & Yarden, Y. (2021) · Cancers · doi:10.3390/cancers13112748 · Cited by 604
Self-citationTargeting circular RNAs as a therapeutic approach: current strategies and challenges
He, A. T., Liu, J., Li, F., & Yang, B. B. (2021) · Signal Transduction and Targeted Therapy · doi:10.1038/s41392-021-00569-5 · Cited by 567
“4 h for their corresponding linear mRNAs.(24) Altogether, the expression pattern and stability of circRNAs suggest that they likely hold functional significance.”
BackgroundThe landscape of mRNA nanomedicine
Huang, X., Kong, N., Zhang, X., Cao, Y., Langer, R., & Tao, W. (2022) · Nature Medicine · doi:10.1038/s41591-022-02061-1 · Cited by 511
mRNA-based cancer therapeutics
Liu, C., Shi, Q., Huang, X., Koo, S., Kong, N., & Tao, W. (2023) · Nature Reviews Cancer · doi:10.1038/s41568-023-00586-2 · Cited by 500
Specific expression and functions of circular RNAs
Mısır, S., Wu, N., & Yang, B. B. (2022) · Cell Death and Differentiation · doi:10.1038/s41418-022-00948-7 · Cited by 493
“CircRNAs serve as prognosis related biomarkers The circRNAs have much longer half-life than linear RNAs [116], which make them ideal candidates for being biomarkers.”
BackgroundEngineering circular RNA for enhanced protein production
Chen, R., Wang, S. K., Belk, J. A., Amaya, L., Li, Z., Cardenas, A., Abe, B. T., Chen, C., Wender, P. A., & Chang, H. Y. (2022) · Nature Biotechnology · doi:10.1038/s41587-022-01393-0 · Cited by 476
A 360° view of circular RNAs: From biogenesis to functions
Wilusz, J. E. (2018) · Wiley Interdisciplinary Reviews - RNA · doi:10.1002/wrna.1478 · Cited by 446
“Once generated, circular RNAs are naturally resistant to degradation by exonucleases and accumulate as stable transcripts (e.g., the median half-life of 60 human circular RNAs was calculated to be ~24 hours; Enuka et al., 2016).”
BackgroundThe circ RNA –micro RNA code: emerging implications for cancer diagnosis and treatment
Verduci, L., Strano, S., Yarden, Y., & Blandino, G. (2019) · Molecular Oncology · doi:10.1002/1878-0261.12468 · Cited by 442
“Congruent with this line of evidence, while stimulation of mammary cells with the epidermal growth factor (EGF) leads to dynamic changes in the abundance of many coding and noncoding RNA molecules and culminates in the acquisition of a robust migratory phenotype, circRNAs of EGF-stimulated mammary cells are stably exp…”
BackgroundSelf-citationThe emerging roles and functions of circular RNAs and their generation
Yu, C., & Kuo, H. (2019) · Journal of Biomedical Science · doi:10.1186/s12929-019-0523-z · Cited by 443
“CircRNAs are predominantly found in the cytoplasm, and the lack of a 5’ cap and 3’ tail make the circular molecules more resistant to RNase degradation compared to their linear cognates [3].”
BackgroundNon-coding RNAs in hepatocellular carcinoma: molecular functions and pathological implications
Wong, C., Tsang, F. H., & Ng, I. O. (2018) · Nature Reviews Gastroenterology & Hepatology · doi:10.1038/nrgastro.2017.169 · Cited by 427
The bioinformatics toolbox for circRNA discovery and analysis
Chen, L., Wang, C., Sun, H., Wang, J., Liang, Y., Wang, Y., & Wong, G. (2020) · Briefings in Bioinformatics · doi:10.1093/bib/bbaa001 · Cited by 402
“CircRNAs also were shown to be long-lived [32].”
BackgroundCircRNAs: role in human diseases and potential use as biomarkers
Verduci, L., Tarcitano, E., Strano, S., Yarden, Y., & Blandino, G. (2021) · Cell Death and Disease · doi:10.1038/s41419-021-03743-3 · Cited by 382
Self-citationCircular RNAs open a new chapter in cardiovascular biology
Aufiero, S., Reckman, Y. J., Pinto, Y. M., & Creemers, E. E. (2019) · Nature Reviews Cardiology · doi:10.1038/s41569-019-0185-2 · Cited by 355
Review on circular RNAs and new insights into their roles in cancer
Tang, X., Ren, H., Guo, M., Qian, J., Yang, Y., & Gu, C. (2021) · Computational and Structural Biotechnology Journal · doi:10.1016/j.csbj.2021.01.018 · Cited by 358
“It was reported by Enuka et al[81] that the majority of circRNAs have a longer half-life (18.”
BackgroundA comprehensive overview and evaluation of circular RNA detection tools
Zeng, X., Lin, W., Guo, M., & Zou, Q. (2017) · PLoS Computational Biology · doi:10.1371/journal.pcbi.1005420 · Cited by 347
Molecular roles and function of circular RNAs in eukaryotic cells
Holdt, L. M., Kohlmaier, A., & Teupser, D. (2017) · Cellular and Molecular Life Sciences · doi:10.1007/s00018-017-2688-5 · Cited by 347
“For comparison, while the lifetime of endogenous circRNAs inside a tissue-type cell is between 1 and 2 days [39, 60, 61], naked circRNAs have only a half-life of 15 s when spiked into 25% serum [155].”
BackgroundCircACC1 Regulates Assembly and Activation of AMPK Complex under Metabolic Stress
Li, Q., Wang, Y., Wu, S., Zhou, Z., Ding, X., Shi, R., Thorne, R. F., Zhang, X. D., Hu, W., & Wu, M. (2019) · Cell Metabolism · doi:10.1016/j.cmet.2019.05.009 · Cited by 344
A circular RNA circ-DNMT1 enhances breast cancer progression by activating autophagy
Du, W. W., Yang, W., Li, X., Awan, F. M., Yang, Z., Fang, L., Lyu, J., Li, F., Peng, C., Krylov, S. N., et al. (2018) · Oncogene · doi:10.1038/s41388-018-0369-y · Cited by 338
A circular RNA promotes tumorigenesis by inducing c-myc nuclear translocation
Yang, Q., Du, W. W., Wu, N., Yang, W., Awan, F. M., Fang, L., Ma, J., Li, X., Zeng, Y., Yang, Z., et al. (2017) · Cell Death and Differentiation · doi:10.1038/cdd.2017.86 · Cited by 328
“Recent studies have shown that awide array of endogenous circRNAs are expressed in animal cells,(3,8,9) while certain circRNAs are highly specific to cell type and/or developmental stage.(8,10,11) Genome-wide analyses have revealed high levels of abundance and evolutionary conservation of circRNAs across species.”
BackgroundBiogenesis and Functions of Circular RNAs Come into Focus
Xiao, M., Ai, Y., & Wilusz, J. E. (2020) · Trends in Cell Biology · doi:10.1016/j.tcb.2019.12.004 · Cited by 316
Biogenesis and Regulatory Roles of Circular RNAs
Yang, L. C., Wilusz, J. E., & Chen, L. (2022) · Annual Review of Cell and Developmental Biology · doi:10.1146/annurev-cellbio-120420-125117 · Cited by 308
Circular RNAs in immune responses and immune diseases
Chen, X., Yang, T., Wang, W., Xi, W., Zhang, T., Li, Q., Yang, A., & Wang, T. (2019) · Theranostics · doi:10.7150/thno.29678 · Cited by 293
Circular RNAs (circRNAs) in Health and Disease
Haque, S., & Harries, L. W. (2017) · Genes · doi:10.3390/genes8120353 · Cited by 272
“than the median half-lives of their linear counterparts [85].”
BackgroundCircular RNA vaccine in disease prevention and treatment
Niu, D., Wu, Y., & Lian, J. (2023) · Signal Transduction and Targeted Therapy · doi:10.1038/s41392-023-01561-x · Cited by 281
Conn, V. M., Chinnaiyan, A. M., & Conn, S. J. (2024) · Nature reviews. Cancer · doi:10.1038/s41568-024-00721-7 · Cited by 300
A landscape of circular RNA expression in the human heart
Tan, W. L. W., Lim, B., Anene-Nzelu, C. G., Ackers-Johnson, M. A., Dashi, A., See, K., Tiang, Z., Lee, D. P., Chua, W. W., Luu, T. D. A., et al. (2016) · Cardiovascular Research · doi:10.1093/cvr/cvw250 · Cited by 270
“Eunuka et al.53 reported that circRNA in EGF-stimulated cells were stably expressed whereas mRNA and miRNA changed within minutes; and proposed the explanation to be the long half-lives of circRNA.”
BackgroundCircular RNAs as potential biomarkers for cancer diagnosis and therapy.
Wang, F., Nazarali, A. J., & Ji, S. (2016) · PubMed Central · Cited by 254
Going circular: history, present, and future of circRNAs in cancer
Pisignano, G., Michael, D. C., Visal, T. H., Pîrlog, R., Ladomery, M., & Călin, G. A. (2023) · Oncogene · doi:10.1038/s41388-023-02780-w · Cited by 272
“Although circRNAs are preferentially back-spliced from hundreds of human genes [20], including neuron-expressed genes [27], back-splicing is typically much less efficient (<1%) than canonical splicing [28] so circRNAs are often expressed at lower levels than their corresponding linear mRNAs [29].”
BackgroundTherapeutic nucleic acids: current clinical status
Sridharan, K., & Gogtay, N. (2016) · British Journal of Clinical Pharmacology · doi:10.1111/bcp.12987 · Cited by 237
Best practice standards for circular RNA research
Nielsen, A. F., Bindereif, A., Bozzoni, I., Hanan, M., Hansen, T. B., Irimia, M., Kadener, S., Kristensen, L. S., Legnini, I., Morlando, M., et al. (2022) · Nature Methods · doi:10.1038/s41592-022-01487-2 · Cited by 238
TTBK2 circular RNA promotes glioma malignancy by regulating miR-217/HNF1β/Derlin-1 pathway
Zheng, J., Liu, X., Xue, Y., Gong, W., Ma, J., Xi, Z., Que, Z., & Liu, Y. (2017) · Journal of Hematology & Oncology · doi:10.1186/s13045-017-0422-2 · Cited by 216
“Circular RNAs (circRNAs), referred to as ncRNAs, are different from the linear RNAs with a circular structure by joining the 3′ end of the RNA to the 5′ end [10, 11].”
BackgroundPreclinical and Clinical Development of Noncoding RNA Therapeutics for Cardiovascular Disease
Huang, C.-K., Kafert-Kasting, S., & Thum, T. (2020) · Circulation Research · doi:10.1161/circresaha.119.315856 · Cited by 217
Competing Endogenous RNAs, Non-Coding RNAs and Diseases: An Intertwined Story
Ala, U. (2020) · Cells · doi:10.3390/cells9071574 · Cited by 206
“5 times longer than the median half-life of their linear counterparts [81].”
BackgroundComprehensive landscape and future perspectives of circular RNAs in colorectal cancer
Long, F., Lin, Z., Li, L., Ma, M., Lu, Z., Jing, L., Li, X., & Lin, C. (2021) · Molecular Cancer · doi:10.1186/s12943-021-01318-6 · Cited by 198
Circular RNAs as Therapeutic Agents and Targets
Holdt, L. M., Kohlmaier, A., & Teupser, D. (2018) · Frontiers in Physiology · doi:10.3389/fphys.2018.01262 · Cited by 189
Yi, Z., Qu, L., Tang, H., Liu, Z., Liu, Y., Tian, F., Wang, C., Zhang, X., Feng, Z., Yu, Y. F., et al. (2022) · Nature Biotechnology · doi:10.1038/s41587-021-01180-3 · Cited by 190
Mechanisms of Long Non-Coding RNAs in Cancers and Their Dynamic Regulations
Zhang, X., Liu, H., & Chen, S. (2020) · Cancers · doi:10.3390/cancers12051245 · Cited by 183
“Both a large non-coding transcriptome and extensive alternative splicing contribute to the complex genome and generation of a great diversity of lncRNAs [6,7].”
BackgroundRNA circles with minimized immunogenicity as potent PKR inhibitors
Liu, C., Guo, S.-K., Fang, N., Xu, Y.-F., Yang, L. C., & Chen, L. (2021) · Molecular Cell · doi:10.1016/j.molcel.2021.11.019 · Cited by 178
Dong, W., Dai, Z., Liu, F., Guo, X., Ge, C.-M., Ding, J., Liu, H., & Yang, F. (2019) · EBioMedicine · doi:10.1016/j.ebiom.2019.06.030 · Cited by 178
“However, circRNA abundance did not seem to be due to its long half-life with respect to the rapid growth of solid tumors [36,39,40].”
BackgroundThe potential of using blood circular RNA as liquid biopsy biomarker for human diseases
Wen, G., Zhou, T., & Gu, W. (2020) · Protein & Cell · doi:10.1007/s13238-020-00799-3 · Cited by 183
Kristensen, L. S., Okholm, T. L. H., Venø, M. T., & Kjems, J. (2017) · RNA Biology · doi:10.1080/15476286.2017.1409931 · Cited by 170
“The expression of these host genes is decreased while the circRNAs remain at similar levels, possibly due to their higher stability relative to mRNA [48].”
BackgroundRecent Advancement in mRNA Vaccine Development and Applications
Fayez, N. A., Nassar, M. S., Alshehri, A. A., Alnefaie, M. K., Almughem, F. A., Alshehri, B. Y., Alawad, A. O., & Tawfik, E. A. (2023) · Pharmaceutics · doi:10.3390/pharmaceutics15071972 · Cited by 187
Circular RNAs: Expression, localization, and therapeutic potentials
Yang, Q., Li, F., He, A. T., & Yang, B. B. (2021) · Molecular Therapy · doi:10.1016/j.ymthe.2021.01.018 · Cited by 166
Molecular mechanisms of circular RNA translation
Hwang, H. J., & Kim, Y. K. (2024) · Experimental & Molecular Medicine · doi:10.1038/s12276-024-01220-3 · Cited by 177
“Due to this property, circRNAs generally exhibit a longer half-life (ranging from 19 to 24 h) than do their cognate linear transcripts with identical nucleotide sequences (ranging from 4 to 7 h) 25 .”
BackgroundNaeli, P., Pourhanifeh, M. H., Karimzadeh, M. R., Shabaninejad, Z., Movahedpour, A., Tarrahimofrad, H., Mirzaei, H. R., Bafrani, H. H., Savardashtaki, A., Mirzaei, H., et al. (2019) · Critical Reviews in Oncology/Hematology · doi:10.1016/j.critrevonc.2019.102854 · Cited by 165
“As a result of the covalently closed-loop structure with no free 5′ and 3′ ends, circRNA molecules show high resistance to the exonuclease RNase R compared to linear RNAs (Enuka et al., 2015; Memczak et al., 2013).”
BackgroundResearch Advances on the Stability of mRNA Vaccines
Cheng, F., Wang, Y., Bai, Y., Liang, Z., Mao, Q., Liu, D., Wu, X., & Xu, M. (2023) · Viruses · doi:10.3390/v15030668 · Cited by 177
CircRNAs: a regulator of cellular stress
Fischer, J. W., & Leung, A. K. L. (2017) · Critical Reviews in Biochemistry and Molecular Biology · doi:10.1080/10409238.2016.1276882 · Cited by 156
“Additionally, the expression of most circRNAs was very low compared to that of linear mRNAs (Enuka et al., 2016).”
BackgroundInfluentialEmerging roles and context of circular RNAs
Panda, A. C., Grammatikakis, I., Munk, R. B., Gorospe, M., & Abdelmohsen, K. (2016) · Wiley Interdisciplinary Reviews - RNA · doi:10.1002/wrna.1386 · Cited by 154
Fang, L., Du, W. W., Awan, F. M., Dong, J., & Yang, B. B. (2019) · Cancer Letters · doi:10.1016/j.canlet.2019.05.036 · Cited by 150
Circular RNAs: The star molecules in cancer
Liu, J., Li, D., Luo, H., & Zhu, X. M. (2019) · Molecular Aspects of Medicine · doi:10.1016/j.mam.2019.10.006 · Cited by 148
Tailor made: the art of therapeutic mRNA design
Metkar, M., Pepin, C. S., & Moore, M. J. (2023) · Nature Reviews Drug Discovery · doi:10.1038/s41573-023-00827-x · Cited by 158
Nanomedicine-Based Approaches for mRNA Delivery
Uchida, S., Perche, F., Pichon, C., & Cabral, H. (2020) · Molecular Pharmaceutics · doi:10.1021/acs.molpharmaceut.0c00618 · Cited by 139
Circular RNAs: Novel Regulators of Neuronal Development
van Rossum, D., Verheijen, B. M., & Pasterkamp, R. J. (2016) · Frontiers in Molecular Neuroscience · doi:10.3389/fnmol.2016.00074 · Cited by 140
NUDT21 regulates circRNA cyclization and ceRNA crosstalk in hepatocellular carcinoma
Li, X., Ding, J., Wang, X., Cheng, Z., & Zhu, Q. (2019) · Oncogene · doi:10.1038/s41388-019-1030-0 · Cited by 138
circRNAs and Exosomes: A Mysterious Frontier for Human Cancer
Shi, X., Wang, B., Feng, X., Xu, Y., Lu, K., & Sun, M. (2019) · Molecular Therapy — Nucleic Acids · doi:10.1016/j.omtn.2019.11.023 · Cited by 137
“5-fold longer than that of their linear counterparts.(24,32) In addition, strict tissue, cell, developmental, and age expression specificity has been demonstrated for a number of circRNAs, supporting the hypothesis that these transcripts are of functional importance.”
BackgroundCircRNAs: biogenesis, functions, and role in drug-resistant Tumours
Ma, S., Kong, S., Wang, F., & Ju, S. (2020) · Molecular Cancer · doi:10.1186/s12943-020-01231-4 · Cited by 140
Circular RNAs in cancer: new insights into functions and implications in ovarian cancer
Shabaninejad, Z., Vafadar, A., Movahedpour, A., Ghasemi, Y., Namdar, A., Fathizadeh, H., Pourhanifeh, M. H., Savardashtaki, A., & Mirzaei, H. (2019) · Journal of Ovarian Research · doi:10.1186/s13048-019-0558-5 · Cited by 136
“The Circular essence of circRNAs make them more stable against RNase in comparison with linear RNA forms [5].”
BackgroundTissue-Dependent Expression and Translation of Circular RNAs with Recombinant AAV Vectors In Vivo
Meganck, R. M., Borchardt, E. K., Rivera, R. M. C., Scalabrino, M. L., Wilusz, J. E., Marzluff, W. F., & Asokan, A. (2018) · Molecular Therapy — Nucleic Acids · doi:10.1016/j.omtn.2018.08.008 · Cited by 137
“One of the distinguishing features of circRNAs is their increased stability compared with most linear mRNAs.(8,25) Indeed, we were able to demonstrate this in vitro with our vectors (Figure 2D).”
BackgroundClinical delivery of circular RNA: Lessons learned from RNA drug development
Young, T. L., Wang, K. C., Varley, A., & Li, B. (2023) · Advanced Drug Delivery Reviews · doi:10.1016/j.addr.2023.114826 · Cited by 130
Circular RNA: A promising new star of vaccine
Xie, J., Ye, F., Deng, X., Tang, Y., Liang, J., Huang, X., Sun, Y., Tang, H., Lei, J., Zheng, S., et al. (2023) · Journal of Translational Internal Medicine · doi:10.2478/jtim-2023-0122 · Cited by 129
“[56] 59] circRNAs such as circZNF609, [53] circMbl, [60] and circSfl [61] are associated with polyribosomes and can generate functional proteins that play a role in cell biology.”
BackgroundIntriguing circles: Conflicts and controversies in circular RNA research
Li, H., Ma, X., & Li, H. (2019) · Wiley Interdisciplinary Reviews - RNA · doi:10.1002/wrna.1538 · Cited by 121
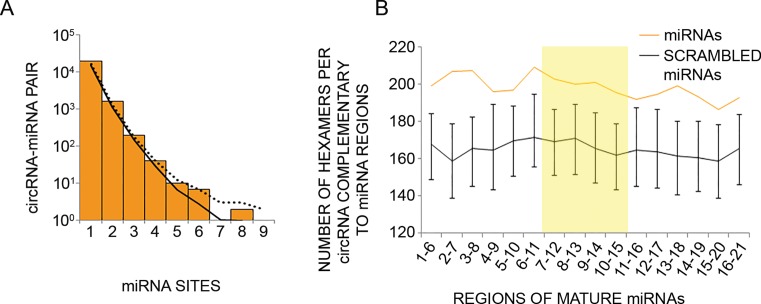
“Researchers (Enuka et al., 2016) found that no circRNA-miRNA pairs exceeded the upper limit of the negative control results, which suggests that circRNAs in mammary cells showed no enrichment in binding sites specific for miRNAs coexpressed in these cells.”
BackgroundOncogenic circRNA C190 Promotes Non–Small Cell Lung Cancer via Modulation of the EGFR/ERK Pathway
Ishola, A. A., Chien, C., Yang, Y.-P., Chien, Y., Yarmishyn, A. A., Tsai, P.-H., Chen, J. C.-Y., Hsu, P.-K., Luo, Y.-H., Chen, Y.-M., et al. (2021) · Cancer Research · doi:10.1158/0008-5472.can-21-1473 · Cited by 120
“Previously, it was shown that circRNAs in general do not respond to EGF stimulation as efficiently as linear mRNAs or miRNAs (32), which makes C190 an unusual case.”
BackgroundFOXP1 circular RNA sustains mesenchymal stem cell identity via microRNA inhibition
Cherubini, A., Barilani, M., Rossi, R. L., Jalal, M., Rusconi, F., Buono, G., Ragni, E., Cantarella, G., Simpson, H., Péault, B., et al. (2019) · Nucleic Acids Research · doi:10.1093/nar/gkz199 · Cited by 117
“Intriguingly, circFOXP1 showed the same trend of its linear counterpart (Supplementary Figure S2C), which may hint at a correlation between circFOXP1 and FOXP1 mRNA transcriptional levels, as already reported for other circRNAs and their linear counterparts (50,51).”
ResultNuclear export of circular RNA
Ngo, L. H., Bert, A. G., Dredge, B. K., Williams, T. D., Murphy, V. J., Li, W., Hamilton, W. B., Carey, K. T., Toubia, J., Pillman, K. A., et al. (2024) · Nature · doi:10.1038/s41586-024-07060-5 · Cited by 121
The therapeutic potential of circular RNAs
O’Leary, E. T., Jiang, Y., Kristensen, L. S., Hansen, T. B., & Kjems, J. (2025) · Nature Reviews Genetics · doi:10.1038/s41576-024-00806-x · Cited by 131
Circular RNAs: Unexpected outputs of many protein-coding genes
Wilusz, J. E. (2016) · RNA Biology · doi:10.1080/15476286.2016.1227905 · Cited by 116
“in response to stimulation by growth factors.(30) Backsplicing, like many alternative splicing events,(23) appears to largely occur post-transcriptionally after RNA polymerase II has reached its termination site.”
BackgroundCircular RNAs: Isolation, characterization and their potential role in diseases
Liu, L., Wang, J., Khanabdali, R., Kalionis, B., Tai, X., & Xia, S. (2017) · RNA Biology · doi:10.1080/15476286.2017.1367886 · Cited by 112
“Enuka, et al.39 found that inmammary cells, miRNA seedmatches in circRNAs didn’t significantly enrich, suggesting that circRNAs may have other biofunctions.”
Plasma circular RNA hsa_circ_0001445 and coronary artery disease: Performance as a biomarker
Viladés, D., Martínez‐Camblor, P., Ferrero‐Gregori, A., Bär, C., Lu, D., Xiao, K., Vea, À., Nasarre, L., Vega, J. S., Leta, R., et al. (2020) · The FASEB Journal · doi:10.1096/fj.201902507r · Cited by 113
Mammalian circular RNAs result largely from splicing errors
Xu, C., & Zhang, J. (2021) · Cell Reports · doi:10.1016/j.celrep.2021.109439 · Cited by 105
“First, the proposal that binding to microRNAs is a general function of circRNAs has been challenged (Enuka et al., 2016; Guo et al., 2014; Ragan et al., 2019).”
BackgroundNovel biomarkers for early detection of gastric cancer
Matsuoka, T., & Yashiro, M. (2023) · World Journal of Gastroenterology · doi:10.3748/wjg.v29.i17.2515 · Cited by 112
L’Abbate, A., Tolomeo, D., Cifola, I., Severgnini, M., Turchiano, A., Augello, B., Squeo, G. M., D’Addabbo, P., Traversa, D., Daniele, G., et al. (2018) · Leukemia · doi:10.1038/s41375-018-0033-0 · Cited by 106
“Remarkably, the transcriptional plasticity observed in our AML-amp cohort also includes circRNAs originated by back-splicing events [51], resistant to exonucleolytic degradation [52], and accumulating at relatively high levels within cells [47].”
BackgroundXu, S., Xu, Y., Solek, N. C., Chen, J., Gong, F., Varley, A., Golubovic, A., Pan, A., Dong, S., Zheng, G., et al. (2024) · Advanced Materials · doi:10.1002/adma.202400307 · Cited by 112
Rynkeviciene, R., Simiene, J., Strainiene, E., Stankevicius, V., Usinskiene, J., Miseikyte Kaubriene, E., Meskinyte, I., Cicenas, J., & Suziedelis, K. (2018) · Cancers · doi:10.3390/cancers11010017 · Cited by 136
“The circular RNA is another group of non-coding RNA serving as a miRNA sponges and sharing the same binding sites [238,239].”
BackgroundDWNN-RLS: regularized least squares method for predicting circRNA-disease associations
Yan, C., Wang, J., & Wu, F. (2018) · BMC Bioinformatics · doi:10.1186/s12859-018-2522-6 · Cited by 103
Nisar, S., Bhat, A. A., Singh, M. K., Karedath, T., Rizwan, A., Hashem, S., Bagga, P., Reddy, R. D., Jamal, F., Shahab Uddin, M. S., et al. (2021) · Frontiers in Cell and Developmental Biology · doi:10.3389/fcell.2021.617281 · Cited by 100
CircRNAs and their regulatory roles in cancers
Tao, M., Zheng, M., Xu, Y., Ma, S., Zhang, W., & Ju, S. (2021) · Molecular Medicine · doi:10.1186/s10020-021-00359-3 · Cited by 102
“2006) and have a longer half-life of more than 48 h (Cocquerelle et al. 1993; Jeck et al. 2013; Enuka et al. 2016).”
BackgroundGaffo, E., Boldrin, E., Molin, A. D., Bresolin, S., Bonizzato, A., Trentin, L., Frasson, C., Debatin, K., Meyer, L. H., Kronnie, G. T., et al. (2019) · Scientific Reports · doi:10.1038/s41598-019-50864-z · Cited by 97
Advancements in clinical RNA therapeutics: Present developments and prospective outlooks
Saw, P. E., & Song, E. (2024) · Cell Reports Medicine · doi:10.1016/j.xcrm.2024.101555 · Cited by 97
An integrated transcriptional analysis of the developing human retina
Mellough, C., Bauer, R., Collin, J., Dorgau, B., Zerti, D., Dolan, D., Jones, C. M., Izuogu, O. G., Yu, M., Hallam, D., et al. (2019) · Development · doi:10.1242/dev.169474 · Cited by 97
“They have much longer half-lives than linear transcripts (Enuka et al., 2016; Zhang et al., 2016), and although most are expressed at low levels, some accumulate to become more abundant than linear transcripts from the same loci in many cell types (Guo et al.”
Backgroundde Fraipont, F., Gazzéri, S., Cho, W. C. S., & Eymin, B. (2019) · Frontiers in Genetics · doi:10.3389/fgene.2019.00390 · Cited by 93
Small genomic insertions form enhancers that misregulate oncogenes
Abraham, B. J., Hnisz, D., Weintraub, A. S., Kwiatkowski, N. P., Li, C. H., Li, Z., Weichert‐Leahey, N., Rahman, S., Liu, Y., Etchin, J., et al. (2017) · Nature Communications · doi:10.1038/ncomms14385 · Cited by 96
Lauretti, E., Dabrowski, K. R., & Praticò, D. (2021) · Ageing Research Reviews · doi:10.1016/j.arr.2021.101425 · Cited by 97
CircRNA: A novel potential strategy to treat thyroid cancer (Review)
Zhu, G., Chang, X., Kang, Y., Zhao, X., Tang, X., Ma, C., & Fu, S. (2021) · International Journal of Molecular Medicine · doi:10.3892/ijmm.2021.5034 · Cited by 95
Non-coding transcript variants of protein-coding genes – what are they good for?
Dhamija, S., & Menon, M. B. (2018) · RNA Biology · doi:10.1080/15476286.2018.1511675 · Cited by 98
“which are generated as a product of pre-mRNA splicing is the circular RNAs (circRNAs) [21,22].”
BackgroundSignature of circular RNAs in human induced pluripotent stem cells and derived cardiomyocytes
Lei, W., Feng, T., Fang, X., You, Y., Yang, J., Zhao, Z., Liu, J., Shen, Z., Deng, W., & Hu, S. (2018) · Stem Cell Research & Therapy · doi:10.1186/s13287-018-0793-5 · Cited by 92
CircRNA accumulation: A new hallmark of aging?
Knupp, D., & Miura, P. (2018) · Mechanisms of Ageing and Development · doi:10.1016/j.mad.2018.05.001 · Cited by 92
Nuclear export and translation of circular repeat-containing intronic RNA in C9ORF72-ALS/FTD
Wang, S., Latallo, M. J., Zhang, Z., Huang, B., Bobrovnikov, D. G., Dong, D., Livingston, N. M., Tjoeng, W., Hayes, L. R., Rothstein, J. D., et al. (2021) · Nature Communications · doi:10.1038/s41467-021-25082-9 · Cited by 92
Metadata
- Authors
- Enuka, Y., Lauriola, M., Feldman, M. E., Sas-Chen, A., Ulitsky, I., & Yarden, Y.
- Affiliations
- Weizmann Institute of Science (IL)
- Corresponding author
- Yarden, Yosef
- Venue
- Nucleic Acids Research
- Publisher
- Oxford University Press (OUP)
- Published
- 2015-12-10
- Volume
- 44
- Issue
- 3
- Pages
- 1370-1383
- ISSN
- 0305-1048 (ISSN-L)
- 1362-4962
- PMC
- PMC4756822
- OpenAlex
- W2285247593
- Cited by
- 757
- References
- 64
- Citations by year
- 2026: 66 · 2025: 91 · 2024: 100 · 2023: 105 · 2022: 93 · 2021: 107 · 2020: 68 · 2019: 57 · 2018: 33 · 2017: 26 · 2016: 9
- FWCI
- 9.85
- Type
- journal article
- Language
- en
- Open access
- gold
- doi.org
- Licence
- Locations
- Nucleic Acids Research (publishedVersion, cc-by-nc)
- PubMed Central (publishedVersion, cc-by-nc)
- PubMed (publishedVersion)
- Archivio istituzionale della ricerca (Alma Mater Studiorum Università di Bologna) (submittedVersion, cc-by-nc)
- HighWire Press Open Archive (submittedVersion)
- Topics
- Life Sciences › Biochemistry, Genetics and Molecular Biology › Molecular Biology › Circular RNAs in diseases
- Life Sciences › Biochemistry, Genetics and Molecular Biology › Molecular Biology › RNA Research and Splicing
- Life Sciences › Biochemistry, Genetics and Molecular Biology › Cancer Research › Cancer-related molecular mechanisms research
- Keywords
- circular RNA, epidermal growth factor, mammary epithelial cells, RNA stability, non-coding RNA, microRNA, cell migration, growth factor signaling
- MeSH terms
- RNA, Circular, Breast, Cell Line, Epidermal Growth Factor, Epithelial Cells, Humans, RNA, RNA, Messenger, Gene Expression, Transforming Growth Factor alpha, Reverse Transcriptase Polymerase Chain Reaction, Oligonucleotide Array Sequence Analysis, Gene Expression Profiling, RNA Stability, MicroRNAs, Heparin-binding EGF-like Growth Factor
About these checks
Registry, retraction, Cites and statistics results are computed, not judged, with one exception: a printed reference that no index lists is read once by a model before it counts as a citation error. Claims are extracted by a model and kept only when their quote appears verbatim in the text; each cited source is then checked, with a model’s help, for whether it says what the claim relies on. Those verdicts can be wrong — read the claim’s quote and the cited source before relying on one.
Statistics and arithmetic are recomputed, not judged.
Confidence bands are shown only for fields calibrated on our annotated test set. None is calibrated yet, so no band is shown.
What counts as a claim ›How we measure confidence ›How we check this ›
Are you an author, or do you see a problem with this page? Request a review
