

The DOI matches its Crossref record; 224 of the 224 references it cites were found in a registry or an index; 116 of the 173 sources its claims cite were checked for support.
Rett syndrome: a neurological disorder with metabolic components
Open accessAbstract
Rett syndrome (RTT) is a neurological disorder caused by mutations in the X-linked gene methyl-CpG-binding protein 2 ( MECP2 ), a ubiquitously expressed transcriptional regulator. Despite remarkable scientific progress since its discovery, the mechanism by which MECP2 mutations cause RTT symptoms is largely unknown. Consequently, treatment options for patients are currently limited and centred on symptom relief. Thought to be an entirely neurological disorder, RTT research has focused on the role of MECP2 in the central nervous system. However, the variety of phenotypes identified in Mecp2 mutant mouse models and RTT patients implicate important roles for MeCP2 in peripheral systems. Here, we review the history of RTT, highlighting breakthroughs in the field that have led us to present day. We explore the current evidence supporting metabolic dysfunction as a component of RTT, presenting recent studies that have revealed perturbed lipid metabolism in the brain and peripheral tissues of mouse models and patients. Such findings may have an impact on the quality of life of RTT patients as both dietary and drug intervention can alter lipid metabolism. Ultimately, we conclude that a thorough knowledge of MeCP2's varied functional targets in the brain and body will be required to treat this complex syndrome.
Overview
AI snapshot
Written from the paper’s full text.
TL;DR
Rett syndrome (RTT) is caused by mutations in X-linked MECP2 and has traditionally been treated as a neurological disorder, but this review argues that metabolic dysfunction—especially perturbed lipid and cholesterol metabolism—is an important component. Evidence from Mecp2 mutant mice and patient subsets links MeCP2 to NCoR1/SMRT-HDAC3-mediated repression of lipogenic genes, suggesting lipid markers and statins as potential therapeutic avenues.
Key findings
- RTT occurs in 1:10,000–15,000 live female births; MECP2 mutations account for 95% of typical RTT cases, and 555 RTT-causing mutations have been identified, with eight common missense/nonsense mutations accounting for approximately 70% of cases, C-terminal deletions approximately 8%, and large deletions approximately 5%.
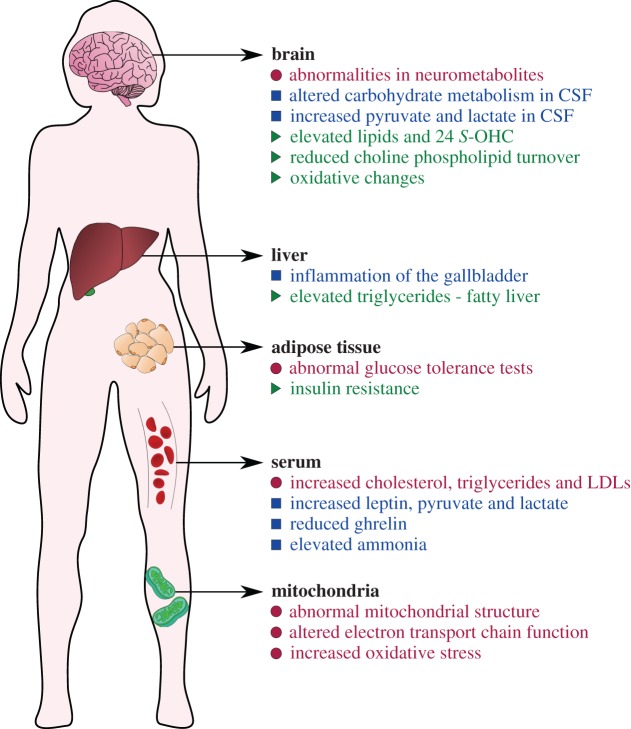
- Metabolic complications are common in RTT, including dyslipidaemia, elevated plasma leptin and adiponectin, elevated ammonia, gallbladder inflammation, altered brain carbohydrate metabolism, mitochondrial abnormalities, increased oxidative stress, and elevated lactate/pyruvate; patients also have a sudden unexpected death rate of 26%.
- A mouse suppressor screen linked MeCP2 to lipid metabolism: a Sqle mutation improved RTT-like motor phenotypes, overall health, and lifespan in Mecp2 null male mice; pre-symptomatic Mecp2 null brains show elevated cholesterol and increased Cyp46a1 expression (38% over wild-type), while post-symptomatic brains show decreased sterol synthesis.
- MeCP2 bridges methylated DNA to the NCoR1/SMRT-HDAC3 co-repressor complex to repress lipogenic genes; liver-specific Mecp2 deletion causes dyslipidaemia and fatty liver, and fluvastatin or lovastatin improves motor performance and lifespan in 129.Mecp2tm1.1Bird mice, leading to a phase 2 lovastatin trial (NCT02563860).
Methods
- Narrative review of RTT history, clinical features, MECP2 genetics, animal models, and metabolic evidence; no new primary data are presented.
- Synthesizes human clinical reports and studies in mouse, rat, zebrafish, and cynomolgus monkey models, including Mecp2 null and point-mutation alleles, conditional deletions, and pharmacological interventions.
- Main analysis is qualitative integration of cited literature; no systematic search strategy or meta-analysis is described.
Limitations
- The paper states that metabolic parameters vary greatly within the RTT patient population and among different mouse strains, indicating that genetic variation may play a large role in the penetrance of metabolic symptoms.
- The paper notes that whole-brain transcriptional profiling studies have not revealed dramatic gene expression changes, perhaps because the heterogeneous brain masks significant perturbations in subpopulations of cells, and definitive gene regulatory targets remain unclear.
- Evident from the text: as a review, it does not present new experimental data; many mechanistic conclusions rely on mouse models, and human metabolic findings come from subsets of patients, so causality and generalizability to all RTT patients remain uncertain.
Model-written summary. Check it against the paper before relying on it.
Integrity signals
Registry
Cites
Statistics
Figures
Verification
Claims the paper makes
48 Partly supported · 28 Supported · 14 No full text of the sources · 12 Own interpretation · 8 No basis given · 7 Supported so far · 2 Couldn’t confirm · 1 Not supported · accuracy not yet measured
The sources with a verdict support this claim; the rest weren’t checked yet, have no full text we could read, or their verdicts aren’t rated yet.
In the paper
“Therefore, MECP2 mutation status is a strong predictor of disease severity, but phenotype variation commonly occurs between individuals with the same MECP2 mutation and is attributed to differences in X chromosome inactivation (XCI) [97].”
§ Rett syndrome: a neurological disorder with metabolic components > Phenotype variation among people with MECP2 mutations
What the sources say
- Not checked — no full text of the sourcecites [38] Neul JL, Fang P, Barrish J, Lane J, Caeg EB, Smith EO, Zoghbi H, Percy A, Glaze DG 2008 Specific mutations in Methyl-CpG-Binding Protein 2 confer different severity in Rett syndrome. Neurology 70, 1313– 1321. (doi:10.1212/01.wnl.0000291011.54508.aa) 18337588 PMC2677974 source
- Supportedcites [96] Cuddapah VA et al. 2014 Methyl-CpG-binding protein 2 (MECP2) mutation type is associated with disease severity in Rett syndrome. J. Med. Genet. 51, 152– 158. (doi:10.1136/jmedgenet-2013-102113) 24399845 PMC4403764 source
The paper’s Abstract explicitly calls MECP2 mutation type a strong predictor of disease severity in Rett syndrome. The Discussion likewise reports a strong association between mutation type and phenotype in typical and atypical Rett syndrome. (LLM, conf=0.94)
boostedcorrelational- Asserted: passes — The authors put it forward as true.
- Checkable: passes — It can be checked against evidence.
- Load-bearing: passes — The paper’s conclusions depend on it.
- Based: passes — The paper gives a reason why it holds.
The cited sources support only part of this claim — read each source’s verdict below.
In the paper
“A number of patients present with dyslipidaemia [15,16], elevated plasma leptin and adiponectin [17,18], elevated ammonia [1] and inflammation of the gallbladder, an organ which stores bile for fat digestion [19].”
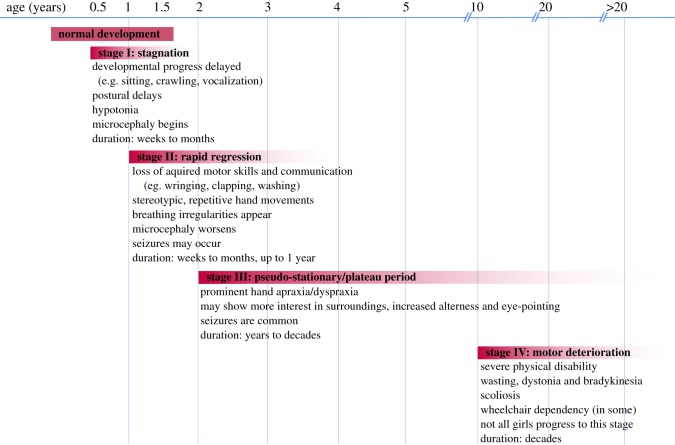
§ Rett syndrome: a neurological disorder with metabolic components > Rett syndrome: clinical features and stages
What the sources say
- Partly supportedcites [19] Freilinger M et al. 2014 Prevalence, clinical investigation, and management of gallbladder disease in Rett syndrome. Dev. Med. Child Neurol. 56, 756– 762. (doi:10.1111/dmcn.12358) 24528171 sourceExperimental — accuracy not yet measured
The Methods (Part 1; page unavailable) include cholecystitis—gallbladder inflammation—among the conditions assessed in people with RTT, and the assessment guidelines discuss its presentation and treatment. However, the reported cases in Part 1 are identified as gallstones and/or cholecystectomy; our copy does not specify how many patients, if any, had cholecystitis. The claim is therefore supported as a recognized possible gallbladder condition in RTT, but not as a documented finding in the study's patients. (LLM, conf=0.79)
plaincorrelational- Asserted: passes — The authors put it forward as true.
- Checkable: passes — It can be checked against evidence.
- Load-bearing: unclear — It is unclear whether the paper’s conclusions depend on it.
- Based: passes — The paper gives a reason why it holds.
- Partly supported
The cited sources support only part of this claim — read each source’s verdict below.
In the paper
“Interestingly, heterozygous female mice on all genetic backgrounds, as well as female rats, become significantly overweight as they age [115,117,125], although humans with RTT have a wide range in body mass index [15].”
§ Rett syndrome: a neurological disorder with metabolic components > Animal models inform MECP2 function
What the sources say
- Could not verifycites [115] Veeraragavan S et al. 2015 Loss of MeCP2 in the rat models regression, impaired sociability and transcriptional deficits of Rett syndrome. Hum. Mol. Genet. 25, 3284– 3302. (doi:10.1093/hmg/ddw178) PMC5179927 27365498 sourceExperimental — accuracy not yet measured
The Results comparison of juvenile female rats and mice (Table 1; page unavailable) reports behavioural phenotypes, not body weight. Searches for overweight, body weight, obesity, and age-related weight gain found no passage in our copy establishing that female rats become significantly overweight, or that mice do so on all genetic backgrounds. (LLM, conf=0.72)
- Partly supportedcites [117] Guy J, Hendrich B, Holmes M, Martin JE, Bird A 2001 A mouse Mecp2-null mutation causes neurological symptoms that mimic Rett syndrome. Nat. Genet. 27, 322– 326. (doi:10.1038/85899) 11242117 sourceExperimental — accuracy not yet measured
The body-weight discussion and Fig. 3 (p. 324) report that surviving Mecp2-null males on a C57BL/6×129 background became heavier than littermates. They do not establish weight gain in heterozygous females: the paper says weight effects depend on genetic background and reports underweight mutant mice on a C57BL/6 background. This mouse study provides no evidence about female rats. (LLM, conf=0.85)
- Partly supportedcites [125] Gigli CC, Scaramuzza L, Gandaglia A, Bellini E, Gabaglio M, Parolaro D, Kilstrup-Nielsen C, Landsberger N, Bedogni F 2016 MeCP2 related studies benefit from the use of CD1 as genetic background. PLoS ONE 11, e0153473 (doi:10.1371/journal.pone.0153473) 27097329 PMC4838291 sourceExperimental — accuracy not yet measured
The Results and Discussion (Fig. 4; page not provided) report that CD1 heterozygous female mice became overweight relative to wild-type controls beginning at three months of age. The paper does not establish this for female mice on all genetic backgrounds or for female rats. (LLM, conf=0.88)
plaincorrelational- Asserted: passes — The authors put it forward as true.
- Checkable: passes — It can be checked against evidence.
- Load-bearing: unclear — It is unclear whether the paper’s conclusions depend on it.
- Based: passes — The paper gives a reason why it holds.
- Could not verify
The sources with a verdict support this claim; the rest weren’t checked yet, have no full text we could read, or their verdicts aren’t rated yet.
In the paper
“It is now well established that mutations in MECP2 account for 95% of typical RTT cases and commonly occur de novo [36–38].”
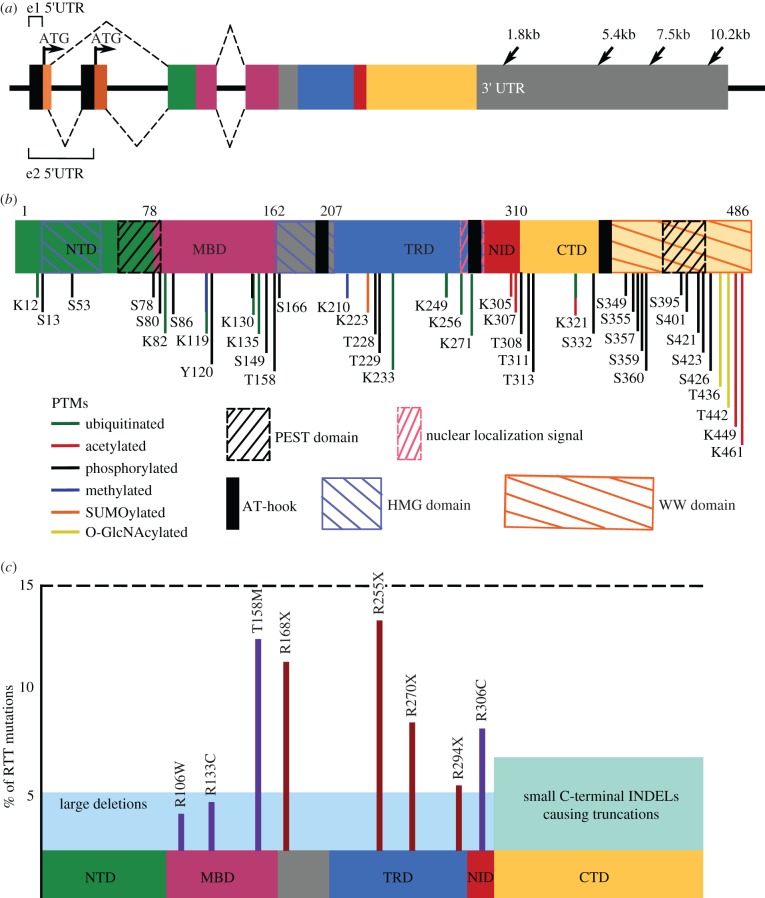
§ Rett syndrome: a neurological disorder with metabolic components > Mutations in MECP2 cause Rett syndrome
What the sources say
- Not checked — no full text of the sourcecites [36] Amir RE, Van den Veyver IB, Wan M, Tran CQ, Francke U, Zoghbi HY 1999 Rett syndrome is caused by mutations in X-linked MECP2, encoding methyl- CpG-binding protein 2. Nat. Genet. 23, 185– 188. (doi:10.1038/13810) 10508514 source
- Supportedcites [37] Wan M et al. 1999 Rett syndrome and beyond: recurrent spontaneous and familial MECP2 mutations at CpG hotspots. Am. J. Hum. Genet. 65, 1520– 1529. (doi:10.1086/302690) 10577905 PMC1288362 source
The Abstract reports de novo missense mutations and says that the high proportion of sporadic RTT cases requires a high rate of new mutations. The Discussion also describes independent de novo recurrences of MECP2 mutations, supporting the claim that they commonly arise de novo. (LLM, conf=0.92)
- Not checked — no full text of the sourcecites [38] Neul JL, Fang P, Barrish J, Lane J, Caeg EB, Smith EO, Zoghbi H, Percy A, Glaze DG 2008 Specific mutations in Methyl-CpG-Binding Protein 2 confer different severity in Rett syndrome. Neurology 70, 1313– 1321. (doi:10.1212/01.wnl.0000291011.54508.aa) 18337588 PMC2677974 source
boostedcorrelationaln = 7- Asserted: passes — The authors put it forward as true.
- Checkable: passes — It can be checked against evidence.
- Load-bearing: unclear — It is unclear whether the paper’s conclusions depend on it.
- Based: passes — The paper gives a reason why it holds.
The sources with a verdict support this claim; the rest weren’t checked yet, have no full text we could read, or their verdicts aren’t rated yet.
In the paper
“Consistently, altered electron transport chain complex function [27], increased oxidative stress [28–30], and elevated levels of lactate and pyruvate in blood and cerebrospinal fluid [20,27] have been observed in RTT patients (reviewed in [31]).”
§ Rett syndrome: a neurological disorder with metabolic components > Rett syndrome: clinical features and stages
What the sources say
- Not checked — no full text of the sourcecites [28] Sierra C, Vilaseca MA, Brandi N, Artuch R, Mira A, Nieto M, Pineda M 2001 Oxidative stress in Rett syndrome. Brain Dev. 23(Suppl 1), S236– S239. (doi:10.1016/S0387-7604(01)00369-2) 11738881 source
- Not checked — no full text of the sourcecites [29] De Felice C et al. 2009 Systemic oxidative stress in classic Rett syndrome. Free Radic. Biol. Med. 47, 440– 448. (doi:10.1016/j.freeradbiomed.2009.05.016) 19464363 source
- Supportedcites [30] Leoncini S, De Felice C, Signorini C, Pecorelli A, Durand T, Valacchi G, Ciccoli L, Hayek J 2011 Oxidative stress in Rett syndrome: natural history, genotype, and variants. Redox Rep. 16, 145– 153. (doi:10.1179/1351000211Y.0000000004) 21888765 PMC6837451 source
The paper’s “OS markers and MeCP2 gene mutations” section reports significantly increased oxidative-stress markers in RTT patients compared with controls. Its table of RTT clinical presentations also describes increases across several RTT forms. The cited claim is limited to increased oxidative stress; it does not attribute the sentence’s other findings to this source. (LLM, conf=0.94)
plain- Asserted: passes — The authors put it forward as true.
- Checkable: passes — It can be checked against evidence.
- Load-bearing: unclear — It is unclear whether the paper’s conclusions depend on it.
- Based: passes — The paper gives a reason why it holds.
The sources with a verdict support this claim; the rest weren’t checked yet, have no full text we could read, or their verdicts aren’t rated yet.
In the paper
“Rett syndrome (RTT) is a neurological disorder caused by mutations in the X-linked gene methyl-CpG-binding protein 2 (MECP2), a ubiquitously expressed transcriptional regulator.”
- Also stated in: § Mutations in MECP2 cause Rett syndrome · boosted
“It is now well established that mutations in MECP2 account for 95% of typical RTT cases and commonly occur de novo [36–38].”
§ Rett syndrome: a neurological disorder with metabolic components > Abstract
What the sources say
- Not checked — no full text of the sourcecites [36] Amir RE, Van den Veyver IB, Wan M, Tran CQ, Francke U, Zoghbi HY 1999 Rett syndrome is caused by mutations in X-linked MECP2, encoding methyl- CpG-binding protein 2. Nat. Genet. 23, 185– 188. (doi:10.1038/13810) 10508514 source
- Supportedcites [37] Wan M et al. 1999 Rett syndrome and beyond: recurrent spontaneous and familial MECP2 mutations at CpG hotspots. Am. J. Hum. Genet. 65, 1520– 1529. (doi:10.1086/302690) 10577905 PMC1288362 source
The Abstract identifies Rett syndrome as a neurodevelopmental disorder and MECP2 as the responsible gene. The Discussion states that mutations in MECP2 cause RTT, and the paper identifies MECP2 as X-linked. (LLM, conf=0.94)
- Not checked — no full text of the sourcecites [38] Neul JL, Fang P, Barrish J, Lane J, Caeg EB, Smith EO, Zoghbi H, Percy A, Glaze DG 2008 Specific mutations in Methyl-CpG-Binding Protein 2 confer different severity in Rett syndrome. Neurology 70, 1313– 1321. (doi:10.1212/01.wnl.0000291011.54508.aa) 18337588 PMC2677974 source
boosteddirectn = 7- Asserted: passes — The authors put it forward as true.
- Checkable: passes — It can be checked against evidence.
- Load-bearing: passes — The paper’s conclusions depend on it.
- Based: passes — The paper gives a reason why it holds.
- Also stated in: § Mutations in MECP2 cause Rett syndrome · boosted
Every source the paper cites for this claim was checked and supports it.
In the paper
“Curiously, body weight in Mecp2 null mice differs depending on genetic background; male Mecp2tm1.1Bird/Y mice on a C57BL/6J background are substantially underweight by four weeks of age compared with wild-type littermates.”
§ Rett syndrome: a neurological disorder with metabolic components > Animal models inform MECP2 function
What the sources say
- Supportedcites [117] Guy J, Hendrich B, Holmes M, Martin JE, Bird A 2001 A mouse Mecp2-null mutation causes neurological symptoms that mimic Rett syndrome. Nat. Genet. 27, 322– 326. (doi:10.1038/85899) 11242117 source
The phenotype discussion states that body weight in Mecp2-null mice depended on genetic background. It reports that mutants on a C57BL/6 background were substantially underweight from four weeks, whereas mice crossed to a 129 strain showed a different weight pattern; the Fig. 3 legend also compares mutant males with wild-type littermates. (LLM, conf=0.94)
- Supportedcites [125] Gigli CC, Scaramuzza L, Gandaglia A, Bellini E, Gabaglio M, Parolaro D, Kilstrup-Nielsen C, Landsberger N, Bedogni F 2016 MeCP2 related studies benefit from the use of CD1 as genetic background. PLoS ONE 11, e0153473 (doi:10.1371/journal.pone.0153473) 27097329 PMC4838291 source
The Results and Discussion (Fig. 4A; page not provided) directly compare body weight across genetic backgrounds: CD1 Mecp2-null mice are moderately underweight at P35 and later reach wild-type weight, whereas B6 null mice are strongly underweight from birth. This supports the attributed claim that body weight in Mecp2-null mice differs by genetic background. (LLM, conf=0.94)
plaincorrelational- Asserted: passes — The authors put it forward as true.
- Checkable: passes — It can be checked against evidence.
- Load-bearing: unclear — It is unclear whether the paper’s conclusions depend on it.
- Based: passes — The paper gives a reason why it holds.
- Supported
The cited sources support only part of this claim — read each source’s verdict below.
In the paper
“Metabolic complications are also common in RTT.”
§ Rett syndrome: a neurological disorder with metabolic components > Rett syndrome: clinical features and stages
What the sources say
- Supportedcites [15] Justice MJ, Buchovecky CM, Kyle SM, Djukic A 2013 A role for metabolism in Rett syndrome pathogenesis: new clinical findings and potential treatment targets. Rare Dis. 1, e27265 (doi:10.4161/rdis.27265) 25003017 PMC3978897 source
The section “A Subset of Rett Patients Display Dyslipidemia” reports that pediatric RTT patients commonly had elevated cholesterol, triglycerides, or LDL. At least one of these lipid measures was elevated in 52%, 44%, and 30% of the three age groups studied. The authors note that these retrospective findings are preliminary. (LLM, conf=0.92)
- Partly supportedcites [16] Segatto M, Trapani L, Di Tunno I, Sticozzi C, Valacchi G, Hayek J, Pallottini V 2014 Cholesterol metabolism is altered in Rett syndrome: a study on plasma and primary cultured fibroblasts derived from patients. PLoS ONE 9, e104834 (doi:10.1371/journal.pone.0104834) 25118178 PMC4130597 sourceExperimental — accuracy not yet measured
The Results and Discussion report significantly higher total and LDL cholesterol in the studied RTT patients than in healthy controls, supporting a specific metabolic alteration. The paper does not establish how common metabolic complications are across people with RTT, or address metabolic complications broadly. (LLM, conf=0.82)
- Not checked — no full text of the sourcecites [17] Acampa M, Guideri F, Hayek J, Blardi P, De Lalla A, Zappella M, Auteri A 2008 Sympathetic overactivity and plasma leptin levels in Rett syndrome. Neurosci. Lett. 432, 69– 72. (doi:10.1016/j.neulet.2007.12.030) 18226448 source
- Not checked — no full text of the sourcecites [18] Blardi P, De Lalla A, D'Ambrogio T, Vonella G, Ceccatelli L, Auteri A, Hayek J 2009 Long-term plasma levels of leptin and adiponectin in Rett syndrome. Clin. Endocrinol. 70, 706– 709. (doi:10.1111/j.1365-2265.2008.03386.x) 18710461 source
- Could not verifycites [19] Freilinger M et al. 2014 Prevalence, clinical investigation, and management of gallbladder disease in Rett syndrome. Dev. Med. Child Neurol. 56, 756– 762. (doi:10.1111/dmcn.12358) 24528171 sourceExperimental — accuracy not yet measured
The Introduction reports that gastrointestinal problems are common in RTT, but does not establish that metabolic complications are common. The Discussion mentions abnormal cholesterol metabolism in Mecp2-mutant mice and describes gallbladder disease in RTT as infrequent; neither establishes the claimed prevalence of metabolic complications in people with RTT. (LLM, conf=0.76)
plain- Asserted: passes — The authors put it forward as true.
- Checkable: passes — It can be checked against evidence.
- Load-bearing: passes — The paper’s conclusions depend on it.
- Based: passes — The paper gives a reason why it holds.
- Supported
The cited sources support only part of this claim — read each source’s verdict below.
In the paper
“It is now well established that mutations in MECP2 account for 95% of typical RTT cases and commonly occur de novo [36–38].”
§ Rett syndrome: a neurological disorder with metabolic components > Mutations in MECP2 cause Rett syndrome
What the sources say
- Not checked — no full text of the sourcecites [36] Amir RE, Van den Veyver IB, Wan M, Tran CQ, Francke U, Zoghbi HY 1999 Rett syndrome is caused by mutations in X-linked MECP2, encoding methyl- CpG-binding protein 2. Nat. Genet. 23, 185– 188. (doi:10.1038/13810) 10508514 source
- Partly supportedcites [37] Wan M et al. 1999 Rett syndrome and beyond: recurrent spontaneous and familial MECP2 mutations at CpG hotspots. Am. J. Hum. Genet. 65, 1520– 1529. (doi:10.1086/302690) 10577905 PMC1288362 sourceExperimental — accuracy not yet measured
The Discussion (Mutation Detection) reports that MECP2 mutations were detected in approximately 50% of patients with RTT, not 95% of typical cases. It also says screening covered only the coding region, so that detection rate does not establish a contrary overall rate. The Abstract supports the link between MECP2 mutations and RTT, but not the claimed 95% figure. (LLM, conf=0.87)
- Not checked — no full text of the sourcecites [38] Neul JL, Fang P, Barrish J, Lane J, Caeg EB, Smith EO, Zoghbi H, Percy A, Glaze DG 2008 Specific mutations in Methyl-CpG-Binding Protein 2 confer different severity in Rett syndrome. Neurology 70, 1313– 1321. (doi:10.1212/01.wnl.0000291011.54508.aa) 18337588 PMC2677974 source
boosteddirectn = 7- Asserted: passes — The authors put it forward as true.
- Checkable: passes — It can be checked against evidence.
- Load-bearing: unclear — It is unclear whether the paper’s conclusions depend on it.
- Based: passes — The paper gives a reason why it holds.
Every source the paper cites for this claim was checked and supports it.
In the paper
“A number of patients present with dyslipidaemia [15,16], elevated plasma leptin and adiponectin [17,18], elevated ammonia [1] and inflammation of the gallbladder, an organ which stores bile for fat digestion [19].”
§ Rett syndrome: a neurological disorder with metabolic components > Rett syndrome: clinical features and stages
What the sources say
- Supportedcites [15] Justice MJ, Buchovecky CM, Kyle SM, Djukic A 2013 A role for metabolism in Rett syndrome pathogenesis: new clinical findings and potential treatment targets. Rare Dis. 1, e27265 (doi:10.4161/rdis.27265) 25003017 PMC3978897 source
The section “A Subset of Rett Patients Display Dyslipidemia” reports elevated cholesterol, triglycerides, or LDL in some of the 84 female RTT patients whose lipid panels were analyzed. It explicitly characterizes these findings as dyslipidemia, while noting that the retrospective data are preliminary. (LLM, conf=0.94)
- Supportedcites [16] Segatto M, Trapani L, Di Tunno I, Sticozzi C, Valacchi G, Hayek J, Pallottini V 2014 Cholesterol metabolism is altered in Rett syndrome: a study on plasma and primary cultured fibroblasts derived from patients. PLoS ONE 9, e104834 (doi:10.1371/journal.pone.0104834) 25118178 PMC4130597 source
The Results and Discussion report significantly higher total cholesterol and LDL-cholesterol in the 15 RTT patients than in healthy controls. This directly supports the claim that some RTT patients present with dyslipidaemia; the paper does not report a prevalence for RTT patients generally. (LLM, conf=0.93)
plaincorrelational- Asserted: passes — The authors put it forward as true.
- Checkable: passes — It can be checked against evidence.
- Load-bearing: unclear — It is unclear whether the paper’s conclusions depend on it.
- Based: passes — The paper gives a reason why it holds.
- Supported
- It may state two separate claims as one. 41
- Probably not a substantial claim. 6
- The quote only partly states this claim. 1
At least one cited source doesn’t support this claim or points to a different paper, and none confirmed it — see the verdicts below.
In the paper
“Interestingly, lovastatin does not have a strong therapeutic effect on B6.Mecp2tm1.1Bird male mice, supporting the idea that elevated peripheral lipids may be a biomarker for those patients who may respond to statin drugs [188].”
§ Rett syndrome: a neurological disorder with metabolic components > Cholesterol-lowering statin drugs may be repurposed to treat RTT
What the sources say
- Disputedcites [188] Villani C, Sacchetti G, Bagnati R, Passoni A, Fusco F, Carli M, Invernizzi RW 2016 Lovastatin fails to improve motor performance and survival in methyl-CpG-binding protein2-null mice. Elife 5, e22409 (doi:10.7554/eLife.22409) 27892851 PMC5132339 sourceExperimental — accuracy not yet measured
The Discussion argues against using elevated serum cholesterol to identify statin responders: it reports improved motor deficits with fluvastatin in female mice whose serum cholesterol was unchanged. It instead proposes investigating plasma 24S-hydroxycholesterol as a possible biomarker of brain cholesterol metabolism that might help identify patients for treatment; that is not a claim that elevated peripheral lipids predict response. (LLM, conf=0.86)
Checked by a reasoning model — may be wrong.
hedgedcorrelational- Asserted: passes — The authors put it forward as true.
- Checkable: passes — It can be checked against evidence.
- Load-bearing: passes — The paper’s conclusions depend on it.
- Based: passes — The paper gives a reason why it holds.
It may state two separate claims as one.
- Disputed
Every source the paper cites for this claim was checked and supports it.
In the paper
“However, MeCP2 may also facilitate transcriptional activation [77], chromatin compaction [78,79] and mRNA splicing [80,81], while also interacting with a host of other regulatory proteins involved in a variety of molecular pathways [81–84].”
§ Rett syndrome: a neurological disorder with metabolic components > Mutations in MECP2 cause Rett syndrome
What the sources say
- Supportedcites [77] Chahrour M, Jung SYY, Shaw C, Zhou X, Wong STCTC, Qin J, Zoghbi HYY 2008 MeCP2, a key contributor to neurological disease, activates and represses transcription. Science 320, 1224– 1229. (doi:10.1126/science.1153252) 18511691 PMC2443785 source
The Abstract reports that MeCP2 can function as a transcriptional activator as well as a repressor in the mouse hypothalamus. It also reports MeCP2 binding with CREB1 at the promoter of an activated target, supporting the cited claim that MeCP2 may facilitate transcriptional activation. The other functions in the citing sentence have separate citations and are not attributed to this source. (LLM, conf=0.94)
- Supportedcites [78] Georgel PT, Horowitz-Scherer RA, Adkins N, Woodcock CL, Wade PA, Hansen JC 2003 Chromatin compaction by human MeCP2: asssembly of novel secondary chromatin structures in the absence of DNA methylation. J. Biol. Chem. 278, 32 181– 32 188. (doi:10.1074/jbc.M305308200) 12788925 source
The citation to this paper supports the chromatin-compaction clause, not the separately cited claims about activation, splicing, or regulatory proteins. The Abstract and the section “Human MeCP2 Is a Unique Architectural Chromatin-binding Protein” report that MeCP2 compacted unmethylated nucleosomal arrays in vitro. (LLM, conf=0.94)
- Supportedcites [79] Baker SA, Chen L, Wilkins AD, Yu P, Lichtarge O, Zoghbi HY 2013 An AT-hook domain in MeCP2 determines the clinical course of Rett syndrome and related disorders. Cell 152, 984– 996. (doi:10.1016/j.cell.2013.01.038) 23452848 PMC3641682 source
This source supports the chromatin-compaction portion of the sentence, to which citations [78,79] are attached. The Results section (‘MeCP2-R270X and MeCP2-G273X differ in their activity towards nucleosomal arrays’) reports that wild-type MeCP2 greatly facilitated oligomerization of nucleosomal arrays in an assay used to model compacted chromatin; the Introduction also describes MeCP2 compacting nucleosomal arrays in vitro. (LLM, conf=0.93)
- Supportedcites [80] Li R et al. 2016 Misregulation of alternative splicing in a mouse model of Rett syndrome. PLoS Genet. 12, e1006129 (doi:10.1371/journal.pgen.1006129) 27352031 PMC4924826 source
The Results section reports MeCP2-interacting proteins involved in transcriptional regulation, chromatin remodeling and RNA splicing. The Discussion states that the study provides strong evidence for MeCP2’s involvement in regulating RNA splicing. Transcriptional activation and chromatin compaction are assigned to other citations in the citing sentence, not to this source. (LLM, conf=0.92)
- Supportedcites [81] Young JI et al. 2005 Regulation of RNA splicing by the methylation-dependent transcriptional repressor methyl-CpG binding protein 2. Proc. Natl Acad. Sci. USA 102, 17 551– 17 558. (doi:10.1073/pnas.0507856102) PMC1266160 16251272 source
For this source, the citing sentence attributes mRNA splicing and interactions with regulatory proteins to MeCP2; its activation and chromatin-compaction claims cite other sources. The Results show that MeCP2 affects splicing of a CD44 reporter, and the Discussion reports its interaction with YB-1, a protein involved in RNA processing (page numbers unavailable in our copy). (LLM, conf=0.92)
hedgedconditional- Asserted: passes — The authors put it forward as true.
- Checkable: passes — It can be checked against evidence.
- Load-bearing: unclear — It is unclear whether the paper’s conclusions depend on it.
- Based: passes — The paper gives a reason why it holds.
It may state two separate claims as one.
- Supported
The cited sources support only part of this claim — read each source’s verdict below.
In the paper
“Consistently, MeCP2 represses transcription in a gene-specific manner, interacting with the co-repressor complexes mSIN3A and NCoR1/SMRT [70,76].”
§ Rett syndrome: a neurological disorder with metabolic components > Mutations in MECP2 cause Rett syndrome
What the sources say
- Partly supportedcites [70] Lyst MJ et al. 2013 Rett syndrome mutations abolish the interaction of MeCP2 with the NCoR/SMRT co-repressor. Nat. Neurosci. 16, 898– 902. (doi:10.1038/nn.3434) 23770565 PMC3786392 sourceExperimental — accuracy not yet measured
The Results (page unavailable) confirm MeCP2’s interactions with both SIN3A and NCoR/SMRT and show repression of a reporter gene. The Discussion (page unavailable) describes silencing of specific genes as a possibility, alongside global inhibition of transcriptional noise; it does not establish gene-specific repression as a general fact. (LLM, conf=0.88)
- Not checked — no full text of the sourcecites [76] Nan X, Ng H-HH, Johnson CA, Laherty CD, Turner BM, Eisenman RN, Bird A 1998 Transcriptional repression by the methyl-CpG-binding protein MeCP2 involves a histone deacetylase complex. Nature 393, 386– 389. (doi:10.1038/30764) 9620804 source
plaindirect- Asserted: passes — The authors put it forward as true.
- Checkable: passes — It can be checked against evidence.
- Load-bearing: unclear — It is unclear whether the paper’s conclusions depend on it.
- Based: passes — The paper gives a reason why it holds.
It may state two separate claims as one.
- Partly supported
The cited sources support only part of this claim — read each source’s verdict below.
In the paper
“Though Mecp2 null mice are asymptomatic prior to four weeks of age, there are subtle but consistent defects in transcription, ionotropic receptor signalling, and neuronal responsiveness during late embryogenesis and the perinatal period [122–124].”
§ Rett syndrome: a neurological disorder with metabolic components > Animal models inform MECP2 function
What the sources say
- Not checked — no full text of the sourcecites [122] Bedogni F et al. 2016 Defects during Mecp2 null embryonic cortex development precede the onset of overt neurological symptoms. Cereb. Cortex 26, 2517– 2529. (doi:10.1093/cercor/bhv078) 25979088 source
- Partly supportedcites [123] Santos M, Silva-Fernandes A, Oliveira P, Sousa N, Maciel P 2007 Evidence for abnormal early development in a mouse model of Rett syndrome. Genes Brain Behav. 6, 277– 286. (doi:10.1111/j.1601-183X.2006.00258.x) 16848781 sourceExperimental — accuracy not yet measured
The Abstract (page unavailable) reports subtle developmental differences from the first postnatal week despite an apparently normal phenotype, and the milestone results describe early reflex deficits in Mecp2-null mice. The paper does not establish defects in ionotropic receptor signalling or neuronal responsiveness, nor does it demonstrate that the reported deficits occurred during late embryogenesis; its transcription discussion does not establish a defect at that stage. (LLM, conf=0.88)
- Not checked — no full text of the sourcecites [124] Chao H-TT, Zoghbi HYY, Rosenmund C 2007 MeCP2 controls excitatory synaptic strength by regulating glutamatergic synapse number. Neuron 56, 58– 65. (doi:10.1016/j.neuron.2007.08.018) 17920015 PMC2198899 source
plain- Asserted: passes — The authors put it forward as true.
- Checkable: passes — It can be checked against evidence.
- Load-bearing: unclear — It is unclear whether the paper’s conclusions depend on it.
- Based: passes — The paper gives a reason why it holds.
It may state two separate claims as one.
Every source the paper cites for this claim was checked and supports it.
In the paper
“Altogether, multiple studies suggest that genes can be activated or repressed by MeCP2, depending upon the cellular context [77,89,90], suggesting that MeCP2 may be defined as a transcriptional modulator.”
§ Rett syndrome: a neurological disorder with metabolic components > Mutations in MECP2 cause Rett syndrome
What the sources say
- Supportedcites [77] Chahrour M, Jung SYY, Shaw C, Zhou X, Wong STCTC, Qin J, Zoghbi HYY 2008 MeCP2, a key contributor to neurological disease, activates and represses transcription. Science 320, 1224– 1229. (doi:10.1126/science.1153252) 18511691 PMC2443785 source
The paper’s Abstract says MeCP2 regulates gene expression in the mouse hypothalamus and can function as both a transcriptional activator and a repressor. That supports the citing sentence’s characterization of MeCP2 as a transcriptional modulator. (LLM, conf=0.94)
- Supportedcites [89] Ben-Shachar S, Chahrour M, Thaller C, Shaw CA, Zoghbi HY 2009 Mouse models of MeCP2 disorders share gene expression changes in the cerebellum and hypothalamus. Hum. Mol. Genet. 18, 2431– 2442. (doi:10.1093/hmg/ddp181) 19369296 PMC2694691 source
The Abstract describes MeCP2 as a modulator that can both increase and decrease gene expression. The Results also report MeCP2 binding to the promoters of an activated target and a repressed target, supporting the citing sentence's characterization. (LLM, conf=0.94)
- Supportedcites [90] Pacheco NL, Heaven MR, Holt LM, Crossman DK, Boggio KJ, Shaffer SA, Flint DL, Olsen ML 2017 RNA sequencing and proteomics approaches reveal novel deficits in the cortex of Mecp2-deficient mice, a model for Rett syndrome. Mol. Autism 8, 56 (doi:10.1186/s13229-017-0174-4) 29090078 PMC5655833 source
The Background describes MeCP2 as a global transcription factor that can both activate and repress transcription. This supports the citing sentence’s description of MeCP2 as a transcriptional modulator. (LLM, conf=0.93)
hedged- Asserted: passes — The authors put it forward as true.
- Checkable: passes — It can be checked against evidence.
- Load-bearing: fails — The paper’s conclusions may not depend on it.
- Based: passes — The paper gives a reason why it holds.
Probably not a substantial claim. The paper’s conclusions may not depend on it.
- Supported
The cited sources that could be checked couldn’t confirm or dispute this claim.
In the paper
“Importantly, cholesterol cannot cross the blood–brain barrier (BBB), so any cholesterol that the brain requires must be synthesized in situ [161].”
§ Rett syndrome: a neurological disorder with metabolic components > A mouse mutagenesis screen links MeCP2 to lipid metabolism
What the sources say
- Could not verifycites [161] Zlokovic BV 2008 The blood-brain barrier in health and chronic neurodegenerative disorders. Neuron 57, 178– 201. (doi:10.1016/j.neuron.2008.01.003) 18215617 sourceExperimental — accuracy not yet measured
The Introduction discusses cholesterol in caveolar membranes and BBB transport generally, but does not say whether cholesterol crosses the BBB or whether the brain must synthesize its own. Searches for cholesterol crossing the barrier and synthesis in the brain found no passage addressing either point. (LLM, conf=0.76)
plaindirect- Asserted: passes — The authors put it forward as true.
- Checkable: passes — It can be checked against evidence.
- Load-bearing: passes — The paper’s conclusions depend on it.
- Based: passes — The paper gives a reason why it holds.
It may state two separate claims as one.
- Could not verify
The cited sources support only part of this claim — read each source’s verdict below.
In the paper
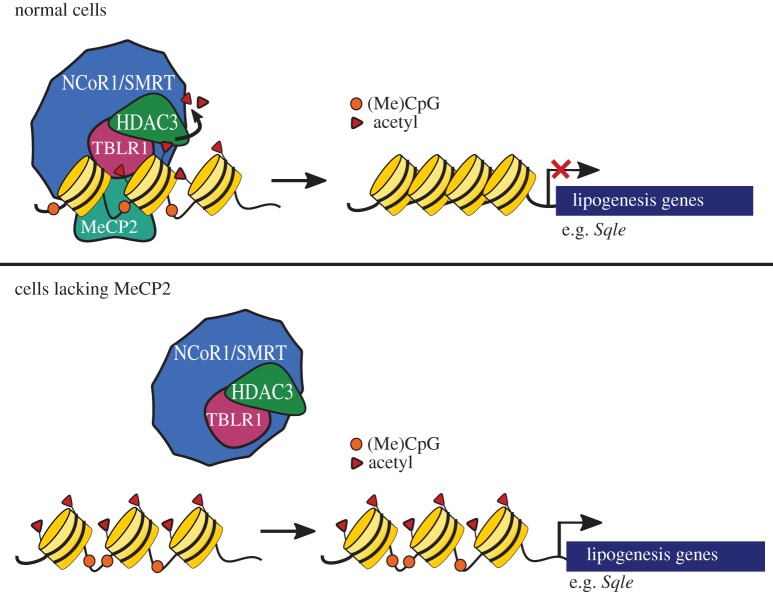
“During the fasting cycle, the NCoR1/SMRT-HDAC3 complex maximally occupies hepatocyte chromatin, repressing the expression of genes involved in lipid synthesis and sequestration. However, during the feeding cycle, it releases chromatin, allowing for expression of its targeted loci [177].”
§ Rett syndrome: a neurological disorder with metabolic components > MeCP2 regulates lipid metabolism with NCoR1/SMRT-HDAC3
What the sources say
- Partly supportedcites [177] Feng D, Liu T, Sun Z, Bugge A, Mullican SE, Alenghat T, Liu XS, Lazar MA 2011 A circadian rhythm orchestrated by histone deacetylase 3 controls hepatic lipid metabolism. Science 331, 1315– 1319. (doi:10.1126/science.1198125) 21393543 PMC3389392 sourceExperimental — accuracy not yet measured
Split into 2 atoms — 0 confirmed, 2 partially supported, 0 disputed, 0 misattributed, 0 unverifiable. Expand the claim to see per-atom verdicts.
plaindirect- Asserted: passes — The authors put it forward as true.
- Checkable: passes — It can be checked against evidence.
- Load-bearing: passes — The paper’s conclusions depend on it.
- Based: passes — The paper gives a reason why it holds.
It may state two separate claims as one.
- Partly supported
The cited sources support only part of this claim — read each source’s verdict below.
In the paper
“Remarkably, treatment with either fluvastatin or lovastatin improves subjective health scores, motor performance (measured by rotarod and open field activity) and increases lifespan in 129.Mecp2tm1.1Bird male and female mutant mice when compared with control mice receiving a vehicle [156].”
§ Rett syndrome: a neurological disorder with metabolic components > Cholesterol-lowering statin drugs may be repurposed to treat RTT
What the sources say
- Partly supportedcites [156] Buchovecky CM et al. 2013 A suppressor screen in Mecp2 mutant mice implicates cholesterol metabolism in Rett syndrome. Nat. Genet. 45, 1013– 1020. (doi:10.1038/ng.2714) 23892605 PMC3837522 sourceExperimental — accuracy not yet measured
The Results section (page unavailable) reports that fluvastatin improved subjective health scores, rotarod performance, open-field activity, and lifespan in male mutant mice versus sham-dosed controls. It reports rotarod and open-field improvements with lovastatin in males, but not improved health scores or lifespan. In females, it reports improved rotarod performance and survival through the fluvastatin trial, but not the full set of outcomes claimed for both drugs and sexes. (LLM, conf=0.90)
plaindirect- Asserted: passes — The authors put it forward as true.
- Checkable: passes — It can be checked against evidence.
- Load-bearing: passes — The paper’s conclusions depend on it.
- Based: passes — The paper gives a reason why it holds.
It may state two separate claims as one.
- Partly supported
The cited sources support only part of this claim — read each source’s verdict below.
In the paper
“Consequently, the expression of Cyp46a1 is increased, indicating a heightened need for cholesterol turnover.”
§ Rett syndrome: a neurological disorder with metabolic components > A mouse mutagenesis screen links MeCP2 to lipid metabolism
What the sources say
- Partly supportedcites [156] Buchovecky CM et al. 2013 A suppressor screen in Mecp2 mutant mice implicates cholesterol metabolism in Rett syndrome. Nat. Genet. 45, 1013– 1020. (doi:10.1038/ng.2714) 23892605 PMC3837522 sourceExperimental — accuracy not yet measured
The Results section reports that Cyp46a1 expression was 38% higher in P28 Mecp2 null mouse brains and interprets this as indicating a heightened need for neuronal cholesterol turnover. It describes the mice at P28 as displaying mild symptoms, however, not as pre-symptomatic. Page numbers were not supplied. (LLM, conf=0.88)
hedgeddirect- Asserted: passes — The authors put it forward as true.
- Checkable: passes — It can be checked against evidence.
- Load-bearing: passes — The paper’s conclusions depend on it.
- Based: passes — The paper gives a reason why it holds.
It may state two separate claims as one.
- Partly supported
The cited sources support only part of this claim — read each source’s verdict below.
In the paper
“Triglycerides accumulate in the liver, and fatty liver disease develops, as indicated by pale liver.”
§ Rett syndrome: a neurological disorder with metabolic components > A mouse mutagenesis screen links MeCP2 to lipid metabolism
What the sources say
- Partly supportedcites [156] Buchovecky CM et al. 2013 A suppressor screen in Mecp2 mutant mice implicates cholesterol metabolism in Rett syndrome. Nat. Genet. 45, 1013– 1020. (doi:10.1038/ng.2714) 23892605 PMC3837522 sourceExperimental — accuracy not yet measured
The Results section reports greatly increased liver triglycerides in symptomatic 129.Mecp2 null males by postnatal day 56, and the Discussion refers to fatty liver disease in these mice. The copy does not report pale liver as the indication of disease, so that detail is unsupported. (LLM, conf=0.83)
plaindirect- Asserted: passes — The authors put it forward as true.
- Checkable: passes — It can be checked against evidence.
- Load-bearing: passes — The paper’s conclusions depend on it.
- Based: passes — The paper gives a reason why it holds.
It may state two separate claims as one.
- Partly supported
The cited sources support only part of this claim — read each source’s verdict below.
In the paper
“In support of this, Sqle, the suppressor of RTT-like phenotypes in mice, is a target of HDAC3, and its transcription increases approximately 170-fold in response to Hdac3 liver deletion [156,178].”
§ Rett syndrome: a neurological disorder with metabolic components > MeCP2 regulates lipid metabolism with NCoR1/SMRT-HDAC3
What the sources say
- Partly supportedcites [156] Buchovecky CM et al. 2013 A suppressor screen in Mecp2 mutant mice implicates cholesterol metabolism in Rett syndrome. Nat. Genet. 45, 1013– 1020. (doi:10.1038/ng.2714) 23892605 PMC3837522 sourceExperimental — accuracy not yet measured
The Results identify a Sqle mutation that rescues Rett-like phenotypes in mice. The Discussion says Sqle promoter regions appear to be HDAC3 targets in the liver, but our copy does not report an approximately 170-fold increase in Sqle transcription after liver-specific Hdac3 deletion; it also frames the targeting as tentative. (LLM, conf=0.88)
- Supportedcites [178] Knutson SK, Chyla BJ, Amann JM, Bhaskara S, Huppert SS, Hiebert SW 2008 Liver-specific deletion of histone deacetylase 3 disrupts metabolic transcriptional networks. EMBO J. 27, 1017– 1028. (doi:10.1038/emboj.2008.51) 18354499 PMC2323257 source
The section on lipid and cholesterol biosynthesis reports an approximately 173-fold increase in Sqle expression in Hdac3-null livers. The histone-acetylation section also identifies Sqle among the genes de-repressed after Hdac3 inactivation, supporting its description as an HDAC3-regulated target. (LLM, conf=0.93)
plaindirect- Asserted: passes — The authors put it forward as true.
- Checkable: passes — It can be checked against evidence.
- Load-bearing: passes — The paper’s conclusions depend on it.
- Based: passes — The paper gives a reason why it holds.
It may state two separate claims as one.
- Partly supported
Every source the paper cites for this claim was checked and supports it.
In the paper
“Loss of MeCP2 decreases HDAC3 binding to DNA, resulting in hyperacetylated histones, and increases transcription of numerous lipid-regulating genes.”
§ Rett syndrome: a neurological disorder with metabolic components > MeCP2 regulates lipid metabolism with NCoR1/SMRT-HDAC3
What the sources say
- Supportedcites [180] Kyle SM, Saha PK, Brown HM, Chan LC, Justice MJ 2016 MeCP2 co-ordinates liver lipid metabolism with the NCoR1/HDAC3 corepressor complex. Hum. Mol. Genet. 25, 3029– 3041. (doi:10.1093/hmg/ddw156) 27288453 PMC5181597 source
The Results report that MeCP2 loss reduces HDAC3 binding near the Sqle, Fasn, and Cd36 transcription start sites and increases the activating histone-acetylation mark H3K27ac at those loci. The Results also report increased expression of multiple genes involved in fatty-acid and cholesterol metabolism in Mecp2-null mouse liver; the Discussion’s Figure 6 describes the same proposed sequence from reduced HDAC3 binding to aberrant transcription. (LLM, conf=0.92)
plaindirect- Asserted: passes — The authors put it forward as true.
- Checkable: passes — It can be checked against evidence.
- Load-bearing: passes — The paper’s conclusions depend on it.
- Based: passes — The paper gives a reason why it holds.
It may state two separate claims as one.
- Supported
Every source the paper cites for this claim was checked and supports it.
In the paper
“Additionally, CD1.Mecp2tm1.1Bird mice have an increase in serum triglycerides with no corresponding change in serum cholesterol [125].”
§ Rett syndrome: a neurological disorder with metabolic components > A mouse mutagenesis screen links MeCP2 to lipid metabolism
What the sources say
- Supportedcites [125] Gigli CC, Scaramuzza L, Gandaglia A, Bellini E, Gabaglio M, Parolaro D, Kilstrup-Nielsen C, Landsberger N, Bedogni F 2016 MeCP2 related studies benefit from the use of CD1 as genetic background. PLoS ONE 11, e0153473 (doi:10.1371/journal.pone.0153473) 27097329 PMC4838291 source
The Results and Discussion state that CD1 Mecp2tm1.1Bird/Y mice had unaltered cholesterol levels at pre- and post-symptomatic stages, while triglycerides were increased at P60, when symptoms were evident. The claim accurately summarizes that finding, though the observed triglyceride increase is specific to P60. (LLM, conf=0.94)
plain- Asserted: passes — The authors put it forward as true.
- Checkable: passes — It can be checked against evidence.
- Load-bearing: passes — The paper’s conclusions depend on it.
- Based: passes — The paper gives a reason why it holds.
It may state two separate claims as one.
- Supported
The cited sources support only part of this claim — read each source’s verdict below.
In the paper
“Remarkably, restoration of MeCP2 expression reversed symptoms: neurological assessments and overall health improved and 80% of TM-treated animals survived beyond 30 weeks of age (end of study).”
§ Rett syndrome: a neurological disorder with metabolic components > Animal models inform MECP2 function
What the sources say
- Partly supportedcites [145] Guy J, Gan J, Selfridge J, Cobb S, Bird A 2007 Reversal of neurological defects in a mouse model of Rett syndrome. Science 315, 1143– 1147. (doi:10.1126/science.1138389) 17289941 PMC7610836 sourceExperimental — accuracy not yet measured
The passage describing the symptomatic male mice (indexed as Abstract; page unavailable) reports improved symptom scores after MeCP2 restoration and says five of six TM-treated animals survived well beyond the untreated mice’s maximum recorded lifespan of 17 weeks. It does not establish that 80% survived beyond 30 weeks of age or identify 30 weeks as the end of the study. (LLM, conf=0.86)
plaindirect- Asserted: passes — The authors put it forward as true.
- Checkable: passes — It can be checked against evidence.
- Load-bearing: passes — The paper’s conclusions depend on it.
- Based: passes — The paper gives a reason why it holds.
It may state two separate claims as one.
- Partly supported
The cited sources support only part of this claim — read each source’s verdict below.
In the paper
“A number of conditional deletions in different subsets of neurons highlight the essential role of MeCP2 in neuronal function, yet their milder presentation suggests additional roles outside the CNS (reviewed in [143]).”
§ Rett syndrome: a neurological disorder with metabolic components > Animal models inform MECP2 function
What the sources say
- Partly supportedcites [143] Li W 2012 Beyond widespread Mecp2 deletions to model Rett syndrome: conditional spatio-temporal knockout, single-point mutations and transgenic rescue mice. Autism Open Access 2012(Suppl. 1), 5 (doi:10.4172/2165-7890.S1-005) 23946910 PMC3740402 sourceExperimental — accuracy not yet measured
The Specific Spatio-Temporal Deletions section reports that forebrain-neuron Mecp2 deletion produces a milder phenotype and that deletion in other neuronal subsets causes neurological symptoms. It does not infer from those milder phenotypes that MeCP2 has roles outside the CNS. The Widespread Mecp2 Deletions section instead reports that brain-specific deletion in neuronal and glial lineages produces a phenotype similar to widespread deficiency. (LLM, conf=0.86)
hedgeddirect- Asserted: passes — The authors put it forward as true.
- Checkable: passes — It can be checked against evidence.
- Load-bearing: passes — The paper’s conclusions depend on it.
- Based: passes — The paper gives a reason why it holds.
It may state two separate claims as one.
- Partly supported
The cited sources support only part of this claim — read each source’s verdict below.
In the paper
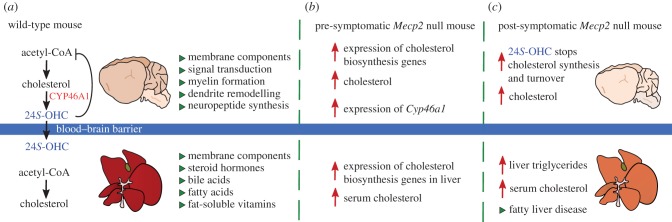
“Owing to decreased synthesis, brain cholesterol remains high, but not as high as at younger ages (smaller red arrow).”
§ Rett syndrome: a neurological disorder with metabolic components > A mouse mutagenesis screen links MeCP2 to lipid metabolism
What the sources say
- Partly supportedcites [156] Buchovecky CM et al. 2013 A suppressor screen in Mecp2 mutant mice implicates cholesterol metabolism in Rett syndrome. Nat. Genet. 45, 1013– 1020. (doi:10.1038/ng.2714) 23892605 PMC3837522 sourceExperimental — accuracy not yet measured
The Results section reports elevated brain cholesterol at P56, when Mecp2 mutant males were severely symptomatic, along with downregulation of cholesterol-biosynthesis genes. But by P70, brain cholesterol in the null mice had returned to wild-type levels; the paper does not support saying it remained high at that later age. (LLM, conf=0.86)
plaindirect- Asserted: passes — The authors put it forward as true.
- Checkable: passes — It can be checked against evidence.
- Load-bearing: unclear — It is unclear whether the paper’s conclusions depend on it.
- Based: passes — The paper gives a reason why it holds.
It may state two separate claims as one.
- Partly supported
The cited sources support only part of this claim — read each source’s verdict below.
In the paper
“Outside of the central nervous system, serum cholesterol is elevated, and expression of cholesterol biosynthesis genes is elevated in the liver.”
§ Rett syndrome: a neurological disorder with metabolic components > A mouse mutagenesis screen links MeCP2 to lipid metabolism
What the sources say
- Partly supportedcites [156] Buchovecky CM et al. 2013 A suppressor screen in Mecp2 mutant mice implicates cholesterol metabolism in Rett syndrome. Nat. Genet. 45, 1013– 1020. (doi:10.1038/ng.2714) 23892605 PMC3837522 sourceExperimental — accuracy not yet measured
The Results section (‘Mecp2 null males have abnormal cholesterol metabolism’; page unavailable) reports elevated serum cholesterol and liver Hmgcr and Sqle expression in 129.Mecp2 null males at P56, when the mice were severely symptomatic. Liver gene expression was unchanged at P28, and the reported peripheral elevations were not seen in the B6 strain. The paper therefore supports the abnormalities, but not the claim that they occur in pre-symptomatic mice. (LLM, conf=0.90)
plaincorrelational- Asserted: passes — The authors put it forward as true.
- Checkable: passes — It can be checked against evidence.
- Load-bearing: passes — The paper’s conclusions depend on it.
- Based: passes — The paper gives a reason why it holds.
It may state two separate claims as one.
- Partly supported
The cited sources support only part of this claim — read each source’s verdict below.
In the paper
“Oxysterols can pass lipophilic membranes more easily than cholesterol, allowing for one-way egress across the BBB and into the body [163].”
§ Rett syndrome: a neurological disorder with metabolic components > A mouse mutagenesis screen links MeCP2 to lipid metabolism
What the sources say
- Partly supportedcites [163] Lund EG, Guileyardo JM, Russell DW 1999 cDNA cloning of cholesterol 24-hydroxylase, a mediator of cholesterol homeostasis in the brain. Proc. Natl Acad. Sci. USA 96, 7238– 7243. (doi:10.1073/pnas.96.13.7238) 10377398 PMC22064 sourceExperimental — accuracy not yet measured
The Discussion (page unavailable) says that 24S-hydroxycholesterol is readily secreted across the blood–brain barrier into circulation and then taken up by the liver. It does not establish that oxysterols generally cross lipophilic membranes more easily than cholesterol, or that passage across the barrier is one-way. (LLM, conf=0.85)
plaindirect- Asserted: passes — The authors put it forward as true.
- Checkable: passes — It can be checked against evidence.
- Load-bearing: unclear — It is unclear whether the paper’s conclusions depend on it.
- Based: passes — The paper gives a reason why it holds.
It may state two separate claims as one.
- Partly supported
Every source the paper cites for this claim was checked and supports it.
In the paper
“This mutation in Sqle improved RTT-like motor phenotypes, overall health and lifespan in Mecp2 null male mice [156].”
§ Rett syndrome: a neurological disorder with metabolic components > A mouse mutagenesis screen links MeCP2 to lipid metabolism
What the sources say
- Supportedcites [156] Buchovecky CM et al. 2013 A suppressor screen in Mecp2 mutant mice implicates cholesterol metabolism in Rett syndrome. Nat. Genet. 45, 1013– 1020. (doi:10.1038/ng.2714) 23892605 PMC3837522 source
The Results section ('Whole exome sequencing reveals a stop codon mutation that confers rescue'; page unavailable) reports improved rotarod performance, open-field activity, and longevity in Mecp2-null male mice carrying the Sqle mutation. The 'ENU screen identifies five suppressors of Mecp2' Results section also reports health-trait rescue in the suppressor lines. The paper cautions that the Sqle mutation did not improve every symptom, but the claim does not assert that it did. (LLM, conf=0.90)
plaindirect- Asserted: passes — The authors put it forward as true.
- Checkable: passes — It can be checked against evidence.
- Load-bearing: passes — The paper’s conclusions depend on it.
- Based: passes — The paper gives a reason why it holds.
It may state two separate claims as one.
- Supported
The cited sources support only part of this claim — read each source’s verdict below.
In the paper
“Mice with a liver-specific deletion of Hdac3 display an increased expression of de novo lipogenesis enzymes due to a constitutively active transcriptional environment, resulting in fatty liver disease and elevated serum cholesterol [178,179].”
§ Rett syndrome: a neurological disorder with metabolic components > MeCP2 regulates lipid metabolism with NCoR1/SMRT-HDAC3
What the sources say
- Supportedcites [178] Knutson SK, Chyla BJ, Amann JM, Bhaskara S, Huppert SS, Hiebert SW 2008 Liver-specific deletion of histone deacetylase 3 disrupts metabolic transcriptional networks. EMBO J. 27, 1017– 1028. (doi:10.1038/emboj.2008.51) 18354499 PMC2323257 source
The section on lipid and cholesterol biosynthesis reports increased expression of fatty-acid synthesis enzymes after liver-specific Hdac3 deletion. The Discussion describes de-repression of metabolic genes with increased histone acetylation, while “Loss of Hdac3 disrupts metabolic homeostasis” reports liver lipid accumulation and significantly increased serum cholesterol. Together, these support the citing sentence’s account of the transcriptional and metabolic effects. (LLM, conf=0.87)
- Partly supportedcites [179] Sun Z et al. 2012 Hepatic Hdac3 promotes gluconeogenesis by repressing lipid synthesis and sequestration. Nat. Med. 18, 934– 942. (doi:10.1038/nm.2744) 22561686 PMC3411870 sourceExperimental — accuracy not yet measured
The Results sections on Hdac3-depleted fatty liver and metabolic rerouting report that liver-specific Hdac3 deletion increases expression of lipid-synthesis genes and causes hepatosteatosis. The paper describes derepression of lipogenic genes, but does not establish the claimed constitutively active transcriptional environment; no passage found reports elevated serum cholesterol (searched: cholesterol, plasma cholesterol). Page numbers were not available in our copy. (LLM, conf=0.86)
plaindirect- Asserted: passes — The authors put it forward as true.
- Checkable: passes — It can be checked against evidence.
- Load-bearing: passes — The paper’s conclusions depend on it.
- Based: passes — The paper gives a reason why it holds.
It may state two separate claims as one.
- Supported
The cited sources support only part of this claim — read each source’s verdict below.
In the paper
“Similar to Mecp2 null mice and a liver-specific deletion of Hdac3, these mice develop dyslipidaemia, fatty liver and metabolic disease.”
§ Rett syndrome: a neurological disorder with metabolic components > MeCP2 regulates lipid metabolism with NCoR1/SMRT-HDAC3
What the sources say
- Partly supportedcites [180] Kyle SM, Saha PK, Brown HM, Chan LC, Justice MJ 2016 MeCP2 co-ordinates liver lipid metabolism with the NCoR1/HDAC3 corepressor complex. Hum. Mol. Genet. 25, 3029– 3041. (doi:10.1093/hmg/ddw156) 27288453 PMC5181597 sourceExperimental — accuracy not yet measured
The Discussion reports that liver-specific Mecp2 deletion causes fatty liver and increased serum cholesterol, supporting the dyslipidaemia and fatty-liver parts of the claim. But the Introduction says these mice remain insulin sensitive, so the paper does not support a broader claim that they develop metabolic disease such as insulin resistance; it reports insulin resistance in whole-body Mecp2-null mice instead. No page numbers are available in our copy. (LLM, conf=0.86)
plaindirect- Asserted: passes — The authors put it forward as true.
- Checkable: passes — It can be checked against evidence.
- Load-bearing: passes — The paper’s conclusions depend on it.
- Based: passes — The paper gives a reason why it holds.
It may state two separate claims as one.
- Partly supported
The cited sources support only part of this claim — read each source’s verdict below.
In the paper
“Curiously, a dominant nonsense mutation was found in squalene epoxidase (Sqle), a monooxygenase and rate-limiting cholesterol biosynthesis enzyme, which requires an electron donor from mitochondria for its function [157].”
§ Rett syndrome: a neurological disorder with metabolic components > A mouse mutagenesis screen links MeCP2 to lipid metabolism
What the sources say
- Partly supportedcites [157] Porter TD 2012 New insights into the role of cytochrome P450 reductase (POR) in microsomal redox biology. Acta Pharm. Sin. B 2, 102– 106. (doi:10.1016/j.apsb.2012.02.002) sourceExperimental — accuracy not yet measured
Section 2.2 (page unavailable) identifies squalene monooxygenase as an enzyme in sterol synthesis that requires an electron-transfer partner. It does not report a dominant nonsense mutation, a forward genetic suppressor screen, or findings in Mecp2-null mice. Its discussion of POR and a second microsomal reductase also does not support the citing sentence’s claim that the electron donor comes from mitochondria. (LLM, conf=0.84)
plain- Asserted: passes — The authors put it forward as true.
- Checkable: passes — It can be checked against evidence.
- Load-bearing: passes — The paper’s conclusions depend on it.
- Based: passes — The paper gives a reason why it holds.
The quote only partly states this claim.
- Partly supported
The cited sources support only part of this claim — read each source’s verdict below.
In the paper
“Curiously, a dominant nonsense mutation was found in squalene epoxidase (Sqle), a monooxygenase and rate-limiting cholesterol biosynthesis enzyme, which requires an electron donor from mitochondria for its function [157].”
§ Rett syndrome: a neurological disorder with metabolic components > A mouse mutagenesis screen links MeCP2 to lipid metabolism
What the sources say
- Partly supportedcites [157] Porter TD 2012 New insights into the role of cytochrome P450 reductase (POR) in microsomal redox biology. Acta Pharm. Sin. B 2, 102– 106. (doi:10.1016/j.apsb.2012.02.002) sourceExperimental — accuracy not yet measured
Section 2.2 identifies Sqle as squalene monooxygenase, an enzyme in sterol synthesis that requires an electron-transfer partner. It describes POR and a second, unidentified microsomal reductase—not an electron donor from mitochondria—and does not call Sqle rate-limiting. Page numbers are unavailable in our copy. (LLM, conf=0.90)
plain- Asserted: passes — The authors put it forward as true.
- Checkable: passes — It can be checked against evidence.
- Load-bearing: unclear — It is unclear whether the paper’s conclusions depend on it.
- Based: passes — The paper gives a reason why it holds.
It may state two separate claims as one.
- Partly supported
The cited sources support only part of this claim — read each source’s verdict below.
In the paper
“To maintain homeostasis, cholesterol can be converted into the oxysterol 24(S)-hydroxycholesterol (24S-OHC) by the neuron-specific enzyme CYP46A1 (figure 4a) [162].”
§ Rett syndrome: a neurological disorder with metabolic components > A mouse mutagenesis screen links MeCP2 to lipid metabolism
What the sources say
- Partly supportedcites [162] Lund EG, Xie C, Kotti T, Turley SD, Dietschy JM, Russell DW 2003 Knockout of the cholesterol 24-hydroxylase gene in mice reveals a brain-specific mechanism of cholesterol turnover. J. Biol. Chem. 278, 22 980– 22 988. (doi:10.1074/jbc.M303415200) 12686551 sourceExperimental — accuracy not yet measured
The Abstract states that CYP46A1 converts cholesterol to 24(S)-hydroxycholesterol, and the Discussion links this pathway to maintaining brain cholesterol homeostasis. The paper reports expression in neurons of the adult brain, but also reports low-level expression in the liver and testis, so it does not establish that the enzyme is strictly neuron-specific. (LLM, conf=0.88)
plaindirect- Asserted: passes — The authors put it forward as true.
- Checkable: passes — It can be checked against evidence.
- Load-bearing: fails — The paper’s conclusions may not depend on it.
- Based: passes — The paper gives a reason why it holds.
Probably not a substantial claim. The paper’s conclusions may not depend on it.
- Partly supported
The cited sources that could be checked couldn’t confirm or dispute this claim.
In the paper
“The C57BL/6 J inbred strain and the 129/Sv substrains manage peripheral cholesterol metabolism differently, presumably due to differences in the transport of cholesterol breakdown products [172].”
§ Rett syndrome: a neurological disorder with metabolic components > A mouse mutagenesis screen links MeCP2 to lipid metabolism
What the sources say
- Could not verifycites [172] Dietschy JM 2009 Central nervous system: cholesterol turnover, brain development and neurodegeneration. Biol. Chem. 390, 287– 293. (doi:10.1515/BC.2009.035) 19166320 PMC3066069 sourceExperimental — accuracy not yet measured
The section on cholesterol flux through tissues outside the central nervous system describes peripheral cholesterol transport in mice generally, but does not compare C57BL/6J with 129/Sv or link strain differences to transport of cholesterol breakdown products. Searches for both strain names and that proposed mechanism found no passage addressing the claim. (LLM, conf=0.76)
hedgedconditional- Asserted: passes — The authors put it forward as true.
- Checkable: passes — It can be checked against evidence.
- Load-bearing: unclear — It is unclear whether the paper’s conclusions depend on it.
- Based: passes — The paper gives a reason why it holds.
It may state two separate claims as one.
- Could not verify
The cited sources support only part of this claim — read each source’s verdict below.
In the paper
“Interestingly, some RTT patients have bone abnormalities, severe gastrointestinal problems and biliary tract disorders [174–176].”
§ Rett syndrome: a neurological disorder with metabolic components > A mouse mutagenesis screen links MeCP2 to lipid metabolism
What the sources say
- Supportedcites [174] Shapiro JR et al. 2010 Bone mass in Rett syndrome: association with clinical parameters and MECP2 mutations. Pediatr. Res. 68, 446– 451. (doi:10.1203/PDR.0b013e3181f2edd2) 20661168 PMC3074246 source
The citation to this bone-mass study supports the bone-abnormalities part of the sentence. The Discussion (page not provided) reports decreased bone mineral content and density in approximately half of the RTT females studied. The gastrointestinal and biliary conditions are not treated as claims attributed specifically to this source. (LLM, conf=0.91)
- Partly supportedcites [175] Motil KJ et al. 2011 Vitamin D deficiency is prevalent in girls and women with Rett syndrome. J. Pediatr. Gastroenterol. Nutr. 53, 569– 574. (doi:10.1097/MPG.0b013e3182267a66) 21637127 PMC3638258 sourceExperimental — accuracy not yet measured
The Discussion reports low bone mineral density and increased fracture risk in females with Rett syndrome, and the Results report scoliosis in 54% of the cohort. Our copy does not report severe gastrointestinal problems or biliary tract disorders in these patients, so it supports only the bone-abnormalities part of the sentence. (LLM, conf=0.88)
- Supportedcites [176] Motil KJ et al. 2012 Gastrointestinal and nutritional problems occur frequently throughout life in girls and women with Rett syndrome. J. Pediatr. Gastroenterol. Nutr. 55, 292– 298. (doi:10.1097/MPG.0b013e31824b6159) 22331013 PMC3393805 source
The Study Design lists skeletal abnormalities and biliary tract disorders among the conditions assessed. The Results report gastrointestinal problems in the majority of the RTT cohort and biliary tract disease in a small number; the Discussion also describes serious complications, including gastric and intestinal perforations. Page numbers were not provided in the copy. (LLM, conf=0.91)
plaincorrelational- Asserted: passes — The authors put it forward as true.
- Checkable: passes — It can be checked against evidence.
- Load-bearing: unclear — It is unclear whether the paper’s conclusions depend on it.
- Based: passes — The paper gives a reason why it holds.
It may state two separate claims as one.
- Supported
The cited sources support only part of this claim — read each source’s verdict below.
In the paper
“Additionally, both RTT patients and Mecp2 mutant mice present with metabolic syndrome [15,180], oxidative stress [27,29], cardiac defects [211,212], decreased bone density [174,213] and urological dysfunction [214,215].”
§ Rett syndrome: a neurological disorder with metabolic components > Implications for understanding and treating childhood neurological disorders
What the sources say
- Partly supportedcites [15] Justice MJ, Buchovecky CM, Kyle SM, Djukic A 2013 A role for metabolism in Rett syndrome pathogenesis: new clinical findings and potential treatment targets. Rare Dis. 1, e27265 (doi:10.4161/rdis.27265) 25003017 PMC3978897 sourceExperimental — accuracy not yet measured
For the metabolic-syndrome portion of the sentence, “Considerations for Other Therapies that May Affect Metabolism in RTT Patients” explicitly describes metabolic-syndrome phenotypes in Mecp2-null mice. “A Subset of Rett Patients Display Dyslipidemia” reports elevated lipids in some RTT patients, but does not establish that RTT patients present with metabolic syndrome. No page numbers are provided in our copy. (LLM, conf=0.88)
- Partly supportedcites [180] Kyle SM, Saha PK, Brown HM, Chan LC, Justice MJ 2016 MeCP2 co-ordinates liver lipid metabolism with the NCoR1/HDAC3 corepressor complex. Hum. Mol. Genet. 25, 3029– 3041. (doi:10.1093/hmg/ddw156) 27288453 PMC5181597 sourceExperimental — accuracy not yet measured
The Introduction and Discussion explicitly describe metabolic syndrome in Mecp2 mutant mice. For RTT patients, the Discussion reports abnormal cholesterol and triglyceride levels and glucose intolerance, but says systemic metabolic involvement remains a possibility requiring further examination; it does not establish that patients present with metabolic syndrome. The other conditions in the citing sentence have separate citations and are not assessed here. (LLM, conf=0.88)
- Not checked — no full text of the sourcecites [27] Haas RH, Nasirian F, Hua X, Nakano K, Hennessy M 1995 Oxidative metabolism in Rett syndrome. 2. Biochemical and molecular studies. Neuropediatrics 26, 95– 99. (doi:10.1055/s-2007-979735) 7566465 source
- Not checked — no full text of the sourcecites [29] De Felice C et al. 2009 Systemic oxidative stress in classic Rett syndrome. Free Radic. Biol. Med. 47, 440– 448. (doi:10.1016/j.freeradbiomed.2009.05.016) 19464363 source
- Supportedcites [211] Hara M et al. 2015 Disturbance of cardiac gene expression and cardiomyocyte structure predisposes Mecp2-null mice to arrhythmias. Sci. Rep. 5, e11204 (doi:10.1038/srep11204) PMC4466896 26073556 source
The citation is attached to “cardiac defects,” not to the other conditions in the sentence. The Abstract reports cardiac dysfunction in both RTT patients and animal models, and cardiac gene-expression and structural alterations in Mecp2-null mice. No page numbers are provided in our copy. (LLM, conf=0.92)
- Supportedcites [212] Crosson J et al. 2017 Evaluation of QTc in Rett syndrome: correlation with age, severity, and genotype. Am. J. Med. Genet. 173, 1495– 1501. (doi:10.1002/ajmg.a.38191) 28394409 PMC5444992 source
This source is cited for the cardiac-defects portion of the sentence, not for the other listed conditions. The Introduction reports ECG and rhythm abnormalities in RTT patients, while the Discussion describes QTc prolongation and inducible ventricular arrhythmias in Mecp2-deletion mice. (LLM, conf=0.90)
plaincorrelational- Asserted: passes — The authors put it forward as true.
- Checkable: passes — It can be checked against evidence.
- Load-bearing: passes — The paper’s conclusions depend on it.
- Based: passes — The paper gives a reason why it holds.
It may state two separate claims as one.
- Partly supported
The cited sources support only part of this claim — read each source’s verdict below.
In the paper
“RTT patients have increased oxidative burden and abnormal mitochondrial structure, while RTT animal models have defects in the mitochondrial respiratory chain [23,26,200–202] and oxidative changes in the brain [203].”
§ Rett syndrome: a neurological disorder with metabolic components > Implications for understanding and treating childhood neurological disorders
What the sources say
- Not checked — no full text of the sourcecites [23] Eeg-Olofsson O, Al-Zuhair AG, Teebi AS, Al-Essa MM 1988 Abnormal mitochondria in the Rett syndrome. Brain Dev.. 10, 260– 262. (doi:10.1016/S0387-7604(88)80010-X) 3218707 source
- Not checked — no full text of the sourcecites [26] Cardaioli E, Dotti MT, Hayek G, Zappella M, Federico A 1999 Studies on mitochondrial pathogenesis of Rett syndrome: ultrastructural data from skin and muscle biopsies and mutational analysis at mtDNA nucleotides 10463 and 2835. J. Submicrosc. Cytol. Pathol. 31, 301– 304. 10457616
- Partly supportedcites [200] Kriaucionis S, Paterson A, Curtis J, Guy J, MacLeod N, Bird A 2006 Gene expression analysis exposes mitochondrial abnormalities in a mouse model of Rett syndrome. Mol. Cell. Biol. 26, 5033– 5042. (doi:10.1128/MCB.01665-05) 16782889 PMC1489175 sourceExperimental — accuracy not yet measured
The Discussion (page unavailable) reports earlier findings of abnormal mitochondrial structure in biopsies from RTT patients. It does not report increased oxidative burden in RTT patients; its mention of oxidative stress concerns other human disorders. The paper’s own respiratory-chain findings concern a mouse model. (LLM, conf=0.86)
- Not checked — no full text of the sourcecites [201] Gold WA, Williamson SL, Kaur S, Hargreaves IP, Land JM, Pelka GJ, Tam PPL, Christodoulou J 2014 Mitochondrial dysfunction in the skeletal muscle of a mouse model of Rett syndrome (RTT): implications for the disease phenotype. Mitochondrion 15, 10– 17. (doi:10.1016/j.mito.2014.02.012) 24613463 source
- Not checked — no full text of the sourcecites [202] Müller M, Can K 2014 Aberrant redox homoeostasis and mitochondrial dysfunction in Rett syndrome. Biochem. Soc. Trans. 42, 959– 964. (doi:10.1042/BST20140071) 25109986 source
plaincorrelational- Asserted: passes — The authors put it forward as true.
- Checkable: passes — It can be checked against evidence.
- Load-bearing: passes — The paper’s conclusions depend on it.
- Based: passes — The paper gives a reason why it holds.
It may state two separate claims as one.
The cited sources support only part of this claim — read each source’s verdict below.
In the paper
“Moreover, deletion of MeCP2 from glial cells induces a RTT-like phenotype, and re-introducing MeCP2 to astrocytes of Mecp2 null mice using GFAP-Cre improves symptoms and restores dendritic morphology [193,194].”
§ Rett syndrome: a neurological disorder with metabolic components > Implications for understanding and treating childhood neurological disorders
What the sources say
- Partly supportedcites [193] Lioy DT et al. 2011 A role for glia in the progression of Rett's syndrome. Nature 475, 497– 500. (doi:10.1038/nature10214) 21716289 PMC3268776 sourceExperimental — accuracy not yet measured
The paper reports that tamoxifen-induced MeCP2 re-expression using hGFAPcreT2 improved RTT-like symptoms and restored the number of apical dendritic branches (passages 2, 3, and 6). However, the rescue mice carried a Mecp2Stop allele, not a true null allele: the paper distinguishes them from Mecp2-/y mice and reports residual MeCP2 expression from the stop locus (passage 8). (LLM, conf=0.88)
- Partly supportedcites [194] Nguyen MVC, Felice CA, Du F, Covey MV, Robinson JK, Mandel G, Ballas N 2013 Oligodendrocyte lineage cells contribute unique features to Rett syndrome neuropathology. J. Neurosci. 33, 18 764– 18 774. (doi:10.1523/JNEUROSCI.2657-13.2013) PMC3841446 24285883 sourceExperimental — accuracy not yet measured
The Introduction reports that re-expressing MeCP2 in astrocytes of RTT mice improves motor activity and behavior. It does not specify GFAP-Cre or report restoration of dendritic morphology; this paper's own rescue experiments instead use NG2Cre to target oligodendrocyte-lineage cells (Results, 'MeCP2 expression is restored specifically...'). (LLM, conf=0.86)
plaindirect- Asserted: passes — The authors put it forward as true.
- Checkable: passes — It can be checked against evidence.
- Load-bearing: passes — The paper’s conclusions depend on it.
- Based: passes — The paper gives a reason why it holds.
It may state two separate claims as one.
- Partly supported
The cited sources support only part of this claim — read each source’s verdict below.
In the paper
“Notably, six of these mutations in TBLR1 mapped to the WD40 domain of the protein and disrupted MeCP2-binding [150].”
§ Rett syndrome: a neurological disorder with metabolic components > Implications for understanding and treating childhood neurological disorders
What the sources say
- Partly supportedcites [150] Kruusvee V, Lyst MJ, Taylor C, Tarnauskaitė Ž, Bird AP, Cook AG 2017 Structure of the MeCP2–TBLR1 complex reveals a molecular basis for Rett syndrome and related disorders. Proc. Natl. Acad. Sci. USA 114, E3243– E3250. (doi:10.1073/pnas.1700731114) 28348241 PMC5402415 sourceExperimental — accuracy not yet measured
The section “Disease-Associated TBLR1 Mutations Block MeCP2 Binding” (page unavailable) identifies six TBLR1 mutations and says all map to the WD40 domain. It demonstrates disrupted MeCP2 binding for two of those mutations, D369E and P444R, but does not establish that all six disrupt binding; the Discussion likewise says “at least two.” (LLM, conf=0.90)
plaindirect- Asserted: passes — The authors put it forward as true.
- Checkable: passes — It can be checked against evidence.
- Load-bearing: passes — The paper’s conclusions depend on it.
- Based: passes — The paper gives a reason why it holds.
It may state two separate claims as one.
- Partly supported
The cited sources support only part of this claim — read each source’s verdict below.
In the paper
“For example, the treatment of Mecp2 null mice with a protein-tyrosine phosphatase 1B (PTP1B) antagonist that was developed to treat Type II diabetes extended lifespan, decreased hindlimb clasping and improved motor performance [207].”
§ Rett syndrome: a neurological disorder with metabolic components > Implications for understanding and treating childhood neurological disorders
What the sources say
- Partly supportedcites [207] Krishnan N, Krishnan K, Connors CR, Choy MS, Page R, Peti W, Van Aelst L, Shea SD, Tonks NK 2015 PTP1B inhibition suggests a therapeutic strategy for Rett syndrome. J. Clin. Invest. 125, 3163– 3177. (doi:10.1172/JCI80323) 26214522 PMC4563751 sourceExperimental — accuracy not yet measured
The Results section, “Inhibition of PTP1B improved survival in Mecp2 -/y mice” (page not provided), reports extended survival in male Mecp2-null mice. The paw-clasping and rotarod passages (“Volume 125 Number 8 August 2015,” page not provided) report those improvements in heterozygous female Mecp2 -/+ mice, not null mice. The cited passages also do not establish that the inhibitor was developed to treat type II diabetes. (LLM, conf=0.92)
plaindirect- Asserted: passes — The authors put it forward as true.
- Checkable: passes — It can be checked against evidence.
- Load-bearing: passes — The paper’s conclusions depend on it.
- Based: passes — The paper gives a reason why it holds.
It may state two separate claims as one.
- Partly supported
The sources with a verdict support this claim; the rest weren’t checked yet, have no full text we could read, or their verdicts aren’t rated yet.
In the paper
“Not surprisingly, both RTT patients and Mecp2 mutant mice have abnormal responses to glucose tolerance tests, and mutant mice are also insulin-resistant [180,195].”
§ Rett syndrome: a neurological disorder with metabolic components > Implications for understanding and treating childhood neurological disorders
What the sources say
- Supportedcites [180] Kyle SM, Saha PK, Brown HM, Chan LC, Justice MJ 2016 MeCP2 co-ordinates liver lipid metabolism with the NCoR1/HDAC3 corepressor complex. Hum. Mol. Genet. 25, 3029– 3041. (doi:10.1093/hmg/ddw156) 27288453 PMC5181597 source
The Results section reports glucose intolerance and insulin resistance in Mecp2 mutant mice. The Discussion reports glucose intolerance in pediatric RTT patients. The copy does not specify the patient testing procedure, but its reported finding supports the claim’s description of abnormal glucose tolerance. (LLM, conf=0.86)
- Not checked — no full text of the sourcecites [195] Cooke DW, Naidu S, Plotnick L, Berkovitz GD 1995 Abnormalities of thyroid function and glucose control in subjects with Rett syndrome. Horm. Res. 43, 273– 278. (doi:10.1159/000184309) 7607612 source
plaincorrelational- Asserted: passes — The authors put it forward as true.
- Checkable: passes — It can be checked against evidence.
- Load-bearing: passes — The paper’s conclusions depend on it.
- Based: passes — The paper gives a reason why it holds.
It may state two separate claims as one.
- Supported
Every source the paper cites for this claim was checked and supports it.
In the paper
“Similarly, Trolox, a vitamin E derivative, normalized blood glucose levels, reduced oxidative stress and improved exploratory behaviour in Mecp2 mice [208].”
§ Rett syndrome: a neurological disorder with metabolic components > Implications for understanding and treating childhood neurological disorders
What the sources say
- Supportedcites [208] Janc OA, Hüser MA, Dietrich K, Kempkes B, Menzfeld C, Hülsmann S, Müller M 2016 Systemic radical scavenger treatment of a mouse model of Rett syndrome: merits and limitations of the vitamin E derivative Trolox. Front. Cell. Neurosci. 10, 266 (doi:10.3389/fncel.2016.00266) 27895554 PMC5109403 source
The Results (Systemic Parameters; page unavailable) report that Trolox abolished the blood-glucose difference between Mecp2−/y and wild-type mice. The Results (Lipid Peroxidation and Protein Carbonylation; page unavailable) report reduced markers of oxidative damage, and Behavioral Testing reports improved exploration in high-dose-treated Mecp2−/y mice. The glucose increase was a trend, and the exploration benefit was dose-specific. (LLM, conf=0.90)
plaindirect- Asserted: passes — The authors put it forward as true.
- Checkable: passes — It can be checked against evidence.
- Load-bearing: unclear — It is unclear whether the paper’s conclusions depend on it.
- Based: passes — The paper gives a reason why it holds.
It may state two separate claims as one.
- Supported
The cited sources support only part of this claim — read each source’s verdict below.
In the paper
“Interestingly, wild-type neurons have abnormal dendritic morphology when co-cultured with MeCP2-deficient astrocytes, yet MeCP2-deficient neurons have normal dendritic morphology when co-cultured with wild-type astrocytes [192].”
§ Rett syndrome: a neurological disorder with metabolic components > Implications for understanding and treating childhood neurological disorders
What the sources say
- Partly supportedcites [192] Ballas N, Lioy DT, Grunseich C, Mandel G 2009 Non-cell autonomous influence of MeCP2-deficient glia on neuronal dendritic morphology. Nat. Neurosci. 12, 311– 317. (doi:10.1038/nn.2275) 19234456 PMC3134296 sourceExperimental — accuracy not yet measured
The Results section (“RTT astrocytes cannot support normal neuronal growth”; page unavailable) reports abnormal dendritic morphology in wild-type neurons co-cultured with MeCP2-deficient astrocytes. The Results section (“RTT ACM cannot support normal neuronal growth”; page unavailable) also reports normal morphology in MeCP2-null neurons exposed to conditioned medium from wild-type astrocytes, but does not establish that result for co-culture with the astrocytes themselves. (LLM, conf=0.88)
plaindirect- Asserted: passes — The authors put it forward as true.
- Checkable: passes — It can be checked against evidence.
- Load-bearing: passes — The paper’s conclusions depend on it.
- Based: passes — The paper gives a reason why it holds.
It may state two separate claims as one.
- Partly supported
The paper states this without a source or data behind it here, so there is nothing to check it against. The quote shows it is in the paper.
In the paper
“Known target genes of the complex in the liver include Sqle and other lipogenesis enzymes.”
§ Rett syndrome: a neurological disorder with metabolic components > MeCP2 modulates transcription by bridging DNA with regulatory complexes
plain- Asserted: passes — The authors put it forward as true.
- Checkable: passes — It can be checked against evidence.
- Load-bearing: fails — The paper’s conclusions may not depend on it.
- Based: fails — The paper may give no reason why it holds.
Probably not a substantial claim. The paper’s conclusions may not depend on it. The paper may give no reason why it holds.
The paper states this without a source or data behind it here, so there is nothing to check it against. The quote shows it is in the paper.
In the paper
“Mecp2 mutant rodents recapitulate many hallmark symptoms of RTT and are the most widely accepted tool to study the disorder.”
§ Rett syndrome: a neurological disorder with metabolic components > Animal models inform MECP2 function
plaindirect- Asserted: passes — The authors put it forward as true.
- Checkable: passes — It can be checked against evidence.
- Load-bearing: unclear — It is unclear whether the paper’s conclusions depend on it.
- Based: unclear — It is unclear why the paper says it holds.
It may state two separate claims as one.
The paper states this without a source or data behind it here, so there is nothing to check it against. The quote shows it is in the paper.
In the paper
“Despite remarkable scientific progress since its discovery, the mechanism by which MECP2 mutations cause RTT symptoms is largely unknown.”
§ Rett syndrome: a neurological disorder with metabolic components > Abstract
plain- Asserted: passes — The authors put it forward as true.
- Checkable: passes — It can be checked against evidence.
- Load-bearing: passes — The paper’s conclusions depend on it.
- Based: passes — The paper gives a reason why it holds.
Probably not a substantial claim.
The paper states this without a source or data behind it here, so there is nothing to check it against. The quote shows it is in the paper.
In the paper
“At four weeks of age, null mice begin to develop uncoordinated gait, hypoactivity, tremors, hindlimb clasping reminiscent of the hand stereotypies seen in RTT patients, and irregular breathing. These phenotypes progress in severity until death.”
§ Rett syndrome: a neurological disorder with metabolic components > Animal models inform MECP2 function
plaindirect- Asserted: passes — The authors put it forward as true.
- Checkable: passes — It can be checked against evidence.
- Load-bearing: unclear — It is unclear whether the paper’s conclusions depend on it.
- Based: passes — The paper gives a reason why it holds.
It may state two separate claims as one.
A claim is checked only against the cited paper’s full text, never its abstract, and none is available for its sources.
In the paper
“MeCP2 is an abundant nuclear protein that was originally identified in a screen for proteins with methyl-DNA-specific binding activity. It is ubiquitously expressed throughout all human tissues, but is particularly abundant within neurons [52,53].”
§ Rett syndrome: a neurological disorder with metabolic components > Mutations in MECP2 cause Rett syndrome
What the sources say
- Not checked — no full text of the sourcecites [52] Tate P, Skarnes W, Bird A 1996 The methyl-CpG binding protein MeCP2 is essential for embryonic development in the mouse. Nat. Genet. 12, 205– 208. (doi:10.1038/ng0296-205) 8563762 source
- Not checked — no full text of the sourcecites [53] Lewis JD et al. 1992 Purification, sequence, and cellular localization of a novel chromosomal protein that binds to Methylated DNA. Cell 69, 905– 914. (doi:10.1016/0092-8674(92)90610-O) 1606614 source
plain- Asserted: passes — The authors put it forward as true.
- Checkable: passes — It can be checked against evidence.
- Load-bearing: unclear — It is unclear whether the paper’s conclusions depend on it.
- Based: passes — The paper gives a reason why it holds.
It may state two separate claims as one.
A claim is checked only against the cited paper’s full text, never its abstract, and none is available for its sources.
In the paper
“In the central nervous system (CNS), MeCP2 is expressed at low levels prenatally, but progressively increases during neuronal maturation and synaptogenesis reaching its peak in mature, post-migratory neurons, suggesting a role for MeCP2 in maintaining neuronal maturation, activity and plasticity [54–57].”
§ Rett syndrome: a neurological disorder with metabolic components > Mutations in MECP2 cause Rett syndrome
What the sources say
- Not checked — no full text of the sourcecites [54] Cohen DRS, Matarazzo V, Palmer AM, Tu Y, Jeon O-H, Pevsner J, Ronnett GV 2003 Expression of MeCP2 in olfactory receptor neurons is developmentally regulated and occurs before synaptogenesis. Mol. Cell. Neurosci. 22, 417– 429. (doi:10.1016/S1044-7431(03)00026-5) 12727440 source
- Not checked — no full text of the sourcecites [55] Jung BP, Jugloff DGM, Zhang G, Logan R, Brown S, Eubanks JH 2003 The expression of methyl CpG binding factor MeCP2 correlates with cellular differentiation in the developing rat brain and in cultured cells. J. Neurobiol. 55, 86– 96. (doi:10.1002/neu.10201) 12605461 source
- Not checked — no full text of the sourcecites [56] Samaco RC, Nagarajan RP, Braunschweig D, LaSalle JM 2004 Multiple pathways regulate MeCP2 expression in normal brain development and exhibit defects in autism-spectrum disorders. Hum. Mol. Genet. 13, 629– 639. (doi:10.1093/hmg/ddh063) 14734626 source
- Not checked — no full text of the sourcecites [57] Kishi N, Macklis JD 2005 Dissecting MECP2 function in the central nervous system. J. Child Neurol. 20, 753– 759. (doi:10.1177/08830738050200091001) 16225831 source
hedgeddirect- Asserted: passes — The authors put it forward as true.
- Checkable: passes — It can be checked against evidence.
- Load-bearing: unclear — It is unclear whether the paper’s conclusions depend on it.
- Based: passes — The paper gives a reason why it holds.
It may state two separate claims as one.
The paper states this without a source or data behind it here, so there is nothing to check it against. The quote shows it is in the paper.
In the paper
“Targets in the brain remain unknown.”
§ Rett syndrome: a neurological disorder with metabolic components > MeCP2 modulates transcription by bridging DNA with regulatory complexes
plain- Asserted: passes — The authors put it forward as true.
- Checkable: passes — It can be checked against evidence.
- Load-bearing: fails — The paper’s conclusions may not depend on it.
- Based: passes — The paper gives a reason why it holds.
Probably not a substantial claim. The paper’s conclusions may not depend on it.
A conclusion the paper draws from its own results — it cites no other source for it, so there is none to check. The quote shows it is in the paper.
In the paper
“Despite this, metabolic parameters vary greatly within the RTT patient population and among different mouse strains indicating that genetic variation may play a large role in the penetrance of metabolic symptoms.”
§ Rett syndrome: a neurological disorder with metabolic components > Implications for understanding and treating childhood neurological disorders
hedgedconditional- Asserted: passes — The authors put it forward as true.
- Checkable: passes — It can be checked against evidence.
- Load-bearing: passes — The paper’s conclusions depend on it.
- Based: passes — The paper gives a reason why it holds.
It may state two separate claims as one.
In the paper
“RTT patients show abnormal neuronal morphology, but not neuronal death, giving legitimacy to the possibility that defective MeCP2-deficient cells can recover [144].”
§ Rett syndrome: a neurological disorder with metabolic components > Animal models inform MECP2 function
What the sources say
- Not checked — no full text of the sourcecites [144] Armstrong D, Dunn JK, Antalffy B, Trivedi R 1995 Selective dendritic alterations in the cortex of Rett syndrome. J. Neuropathol. Exp. Neurol. 54, 195– 201. (doi:10.1097/00005072-199503000-00006) 7876888 source
plain- Asserted: passes — The authors put it forward as true.
- Checkable: passes — It can be checked against evidence.
- Load-bearing: passes — The paper’s conclusions depend on it.
- Based: passes — The paper gives a reason why it holds.
It may state two separate claims as one.
In the paper
“The primary mechanism of action for statin drugs is to competitively inhibit 3-hydroxy-3-methylglutaryl coenzyme A reductase (HMGCR), a rate-limiting step in cholesterol biosynthesis [181], effectively reducing the endogenous production of cholesterol.”
§ Rett syndrome: a neurological disorder with metabolic components > Cholesterol-lowering statin drugs may be repurposed to treat RTT
What the sources say
- Not checked — no full text of the sourcecites [181] Istvan ES, Deisenhofer J 2001 Structural mechanism for statin inhibition of HMG-CoA reductase. Science 292, 1160– 1164. (doi:10.1126/science.1059344) 11349148 source
plaindirect- Asserted: passes — The authors put it forward as true.
- Checkable: passes — It can be checked against evidence.
- Load-bearing: passes — The paper’s conclusions depend on it.
- Based: passes — The paper gives a reason why it holds.
Probably not a substantial claim. It may state two separate claims as one.
A claim is checked only against the cited paper’s full text, never its abstract, and none is available for its sources.
In the paper
“As cholesterol synthesis is a resource-expensive process, current data suggest that newborn neurons must produce cholesterol in a cell-autonomous manner, but as they mature they outsource production to astrocytes (reviewed in [160,191]).”
§ Rett syndrome: a neurological disorder with metabolic components > Implications for understanding and treating childhood neurological disorders
What the sources say
- Not checked — no full text of the sourcecites [160] Pfrieger FW, Ungerer N 2011 Cholesterol metabolism in neurons and astrocytes. Prog. Lipid Res. 50, 357– 371. (doi:10.1016/j.plipres.2011.06.002) 21741992 source
- Not checked — no full text of the sourcecites [191] Pfrieger FW 2003 Outsourcing in the brain: do neurons depend on cholesterol delivery by astrocytes? Bioessays 25, 72– 78. (doi:10.1002/bies.10195) 12508285 source
hedgeddirect- Asserted: passes — The authors put it forward as true.
- Checkable: passes — It can be checked against evidence.
- Load-bearing: passes — The paper’s conclusions depend on it.
- Based: passes — The paper gives a reason why it holds.
It may state two separate claims as one.
A conclusion the paper draws from its own results — it cites no other source for it, so there is none to check. The quote shows it is in the paper.
In the paper
“As CNS-targeted gene therapy becomes a more realistic therapeutic approach, peripheral deficiency of MeCP2 must be considered more than ever as these symptoms are likely to persist following targeted genetic treatment to the brain.”
§ Rett syndrome: a neurological disorder with metabolic components > Implications for understanding and treating childhood neurological disorders
hedgeddirect- Asserted: passes — The authors put it forward as true.
- Checkable: passes — It can be checked against evidence.
- Load-bearing: passes — The paper’s conclusions depend on it.
- Based: passes — The paper gives a reason why it holds.
It may state two separate claims as one.
A conclusion the paper draws from its own results — it cites no other source for it, so there is none to check. The quote shows it is in the paper.
In the paper
“However, despite this progress, no single treatment has yet fixed every phenotype in Mecp2 mice or yet proved to effectively treat RTT symptoms.”
§ Rett syndrome: a neurological disorder with metabolic components > Implications for understanding and treating childhood neurological disorders
plain- Asserted: passes — The authors put it forward as true.
- Checkable: passes — It can be checked against evidence.
- Load-bearing: passes — The paper’s conclusions depend on it.
- Based: passes — The paper gives a reason why it holds.
It may state two separate claims as one.
The paper relies on this without support.
Treatment options for RTT patients are currently limited and centred on symptom relief.
“Consequently, treatment options for patients are currently limited and centred on symptom relief.”
The paper relies on this without support.
Dietary and drug intervention can alter lipid metabolism.
“Such findings may have an impact on the quality of life of RTT patients as both dietary and drug intervention can alter lipid metabolism.”
The paper relies on this without support.
RTT research has focused on the role of MECP2 in the central nervous system.
“Thought to be an entirely neurological disorder, RTT research has focused on the role of MECP2 in the central nervous system.”
The paper relies on this without support.
RTT has been thought to be an entirely neurological disorder.
“Thought to be an entirely neurological disorder, RTT research has focused on the role of MECP2 in the central nervous system.”
The paper relies on this without support.
Lipid anomalies had never before been described in RTT, and whether cholesterol played a primary role in the pathology of RTT was unknown.
“However, lipid anomalies had never before been described in RTT and whether cholesterol played a primary role in the pathology of the disease was unknown.”
Claims other papers make about this one
Each is checked against this paper’s own text: does it say what the citing paper says it does?
The cited source says what the claim attributes to it.
In the citing paper
“It is becoming increasingly clear that RTT is deeply associated to important metabolic alterations [67].”
From Loss of Mevalonate/Cholesterol Homeostasis in the Brain: A Focus on Autism Spectrum Disorder and Rett Syndrome (2019) · cites this paper as [67]
Self-check
Percentages, sums and reported differences re-computed from the paper’s own numbers.
Each contradiction between two passages listed here was confirmed by an independent check.
Rated minor: it would not touch a result — a value no result rests on, a p-value that stays on the same side of the significance level, or a conflict that is clerical, resolved elsewhere in the paper, or outside its own findings.
In the paper
§ Rett syndrome: a neurological disorder with metabolic components > Animal models inform MECP2 function
“| Mecp2tm1.1Mitoh | deletion of MeCP2 exon 2 | asymptomatic but have placental defects | >1 year | [95] |”
§ Rett syndrome: a neurological disorder with metabolic components > Animal models inform MECP2 function
“| point mutation alleles | point mutation alleles | point mutation alleles | point mutation alleles | point mutation alleles |”
Citations
Cites
The Human Genome Browser at UCSC
Kent, W. J., Sugnet, C. W., Furey, T. S., Roskin, K. M., Pringle, T. H., Zahler, A. M., & Haussler, A. D. (2002) · Genome Research · doi:10.1101/gr.229102 · Cited by 10,400
Shrestha, S., & Offer, S. M. (2016) · Medical Epigenetics · doi:10.1159/000444713 · Cited by 8,951
Rett syndrome is caused by mutations in X-linked MECP2, encoding methyl-CpG-binding protein 2
Amir, R. E., Van den Veyver, I. B., Wan, M., Tran, C. Q., Francke, U., & Zoghbi, H. Y. (1999) · Nature Genetics · doi:10.1038/13810 · Cited by 4,990
Nan, X., Ng, H.-H., Johnson, C. A., Laherty, C. D., Turner, B. M., Eisenman, R. N., & Bird, A. (1998) · Nature · doi:10.1038/30764 · Cited by 3,440
The Blood-Brain Barrier in Health and Chronic Neurodegenerative Disorders
Zlokovic, B. V. (2008) · Neuron · doi:10.1016/j.neuron.2008.01.003 · Cited by 3,280
Human Gene Mutation Database (HGMD®): 2003 update
Stenson, P., Ball, E. V., Mort, M., Phillips, A. D., Shiel, J. A., Thomas, N., Abeysinghe, S. S., Krawczak, M., & Cooper, D. (2003) · Human Mutation · doi:10.1002/humu.10212 · Cited by 1,887
MeCP2, a Key Contributor to Neurological Disease, Activates and Represses Transcription
Chahrour, M., Jung, S. Y., Shaw, C., Zhou, X., Wong, S. T. C., Qin, J., & Zoghbi, H. Y. (2008) · Science · doi:10.1126/science.1153252 · Cited by 1,823
Structural mechanism for statin inhibition of HMG-CoA reductase
Istvan, E. S., & Deisenhofer, J. (2001) · Science · doi:10.1126/science.1059344 · Cited by 1,644
A mouse Mecp2-null mutation causes neurological symptoms that mimic Rett syndrome
Guy, J., Hendrich, B., Holmes, M., Martin, J. E., & Bird, A. (2001) · Nature Genetics · doi:10.1038/85899 · Cited by 1,558
Hagberg, B. A., Aicardi, J. F., Dias, K., & Ramos, O. (1983) · Annals of Neurology · doi:10.1002/ana.410140412 · Cited by 1,515
Cited by
Sorted by citations
Items 101–200 of 214
Steinkellner, H., Schönegger, A., Etzler, J., Kempaiah, P., Huber, A., Hahn, K., Rose, K., Duerr, M. A., Christodoulou, J., Beribisky, A. V., et al. (2019) · Scientific Reports · doi:10.1038/s41598-019-44372-3 · Cited by 5
Enikanolaiye, A., Ruston, J., Zeng, R., Taylor, C., Schrock, M., Buchovecky, C. M., Shendure, J., Acar, E. F., & Justice, M. J. (2019) · bioRxiv (Cold Spring Harbor Laboratory) · doi:10.1101/810929 · Cited by 5
“the nervous system leads to a number of systemic problems, including metabolic syndrome (Kyle et al. 2016; Ross et al. 2016; Kyle et al. 2018).”
BackgroundSelf-citationSette, C., Urbinati, C., Lanzillotta, C., Prestia, F., Ciafardini, L., Cosentino, L., Pietraforte, D., Quattrini, M. C., Marzia Perluigi, A., Domenico, F. D., et al. (2025) · Free Radical Biology and Medicine · doi:10.1016/j.freeradbiomed.2025.12.042 · Cited by 4
Ali, N. E., Tariq, N., Naz, G., Abalkhail, A., Kausar, T., Mazhar, I., Zia, S. K., Aqib, A. I., & Khan, N. U. (2025) · Molecular Biology Reports · doi:10.1007/s11033-025-10802-x · Cited by 5
Sharaf‐Eldin, W. E., Soliman, H. N., Abdelaziz, N., Elbendary, H. M., Issa, M. Y., & Zaki, M. S. (2019) · Meta Gene · doi:10.1016/j.mgene.2019.100620 · Cited by 4
Spennato, M., Roggero, O. M., Varriale, S., et al. (2022) · Molecules · doi:10.3390/molecules27248772 · Cited by 4
“instance of Rett syndrome in which multiple mutations exist (more than 100, with 8 being the most frequent ones) leading to a variety of symptoms and disease severity [45].”
BackgroundAkiyama, M., Akiyama, T., Saitsu, H., et al. (2023) · Brain and Development · doi:10.1016/j.braindev.2023.07.006 · Cited by 4
Mietto, M., Montanari, S., Falzarano, M. S., Manzati, E., Rimessi, P., Fabris, M., Selvatici, R., Gualandi, F., Neri, M., Fortunato, F., et al. (2025) · Biomolecules · doi:10.3390/biom15050687 · Cited by 5
“Predominantly affecting females, RTT has an estimated prevalence of 1 in 10,000 to 15,000 live births [1] and is one of the most common genetic causes of intellectual disability (ID) in females.”
Pasqui, A., Cicaloni, V., Tinti, L., Guiotto, A., Tinti, C., Mori, A., Bruttini, M., Hayek, J., Pecorelli, A., Salvini, L., et al. (2023) · Archives of Biochemistry and Biophysics · doi:10.1016/j.abb.2023.109860 · Cited by 4
Pramanik, S., Bala, A., & Pradhan, A. (2024) · The Journal of Gene Medicine · doi:10.1002/jgm.3677 · Cited by 5
“In 62 – 64 It was observed that the most reflective symptoms in human patients and most Mecp2-mutant mice are motor abnormalities, including reduced mobility, impaired motor coordination, ataxic gait and tremors.”
BackgroundInfluentialVarderidou‐Minasian, S., Hinz, L., Hagemans, D., Posthuma, D., Altelaar, M. A. F., & Heine, V. M. (2019) · bioRxiv (Cold Spring Harbor Laboratory) · doi:10.1101/603647 · Cited by 4
“Proteins involved in immunity and metabolism, also in line with previous studies on RTT pathology [33, 34], are differentially expressed at all time points.”
BackgroundResultMonteiro‐Fernandes, D., Charles, I., Guerreiro, S. R., Cunha‐Garcia, D., Pereira‐Sousa, J., Oliveira, S., Teixeira‐Castro, A., Varney, M. A., Kleven, M. S., Newman‐Tancredi, A., et al. (2025) · Biomedicine & Pharmacotherapy · doi:10.1016/j.biopha.2025.117989 · Cited by 3
Multilevel evidence of MECP2-associated mitochondrial dysfunction and its therapeutic implications
Balicza, P., Gézsi, A., Fedor, M., Sági, J. C., Gál, A., Varga, N. Á., & Molnár, M. J. (2024) · Frontiers in Psychiatry · doi:10.3389/fpsyt.2023.1301272 · Cited by 3
An Irak1-Mecp2 tandem duplication mouse model for the study of MECP2 duplication syndrome
Maino, E., Scott, O., Rizvi, S. Z., Chan, W. S., Visuvanathan, S., Zablah, Y. B., Li, H., Sengar, A. S., Salter, M. W., Jia, Z., et al. (2024) · Disease Models & Mechanisms · doi:10.1242/dmm.050528 · Cited by 3
“RTT affects one in 10,000 females and manifests as developmental regression, breathing abnormalities, seizures, anxiety and metabolic dysfunction (Kyle et al., 2018).”
Yıldız, N., Serdaroğlu, E., Kart, P. Ö., et al. (2024) · Epilepsy Research · doi:10.1016/j.eplepsyres.2024.107399 · Cited by 3
Tamaoki, Y., Kroon, S. L., Williams, B. M., et al. (2025) · Neurobiology of Disease · doi:10.1016/j.nbd.2025.106926 · Cited by 3
“During the regression stage, children start to show loss-of-function in motor, cognitive, and communication skills, as well as development of seizures (Chahrour and Zoghbi, 2007; Ip et al., 2018; Kyle et al., 2018).”
Strategies for in Silico Drug Discovery to Modulate Macromolecular Interactions Altered by Mutations
Poudel, P., Miteva, M. A., & Alexov, E. (2025) · Frontiers in Bioscience-Landmark · doi:10.31083/fbl26339 · Cited by 3
IRSF 2023 - Rett Syndrome Scientific Meeting Report
Garg, N., Zhou, Z., Marsh, E. D., Niswender, C. M., & Pichard, D. C. (2023) · Translational Science of Rare Diseases · doi:10.3233/trd-230063 · Cited by 3
Drug repurposing in Rett and Rett-like syndromes: a promising yet underrated opportunity?
Fuchs, C., Hoen, P. A. C. ’., Müller, A. R., Ehrhart, F., & van Karnebeek, C. (2024) · Frontiers in Medicine · doi:10.3389/fmed.2024.1425038 · Cited by 3
Cittadini, C., Germinario, E. A. P., Maroccia, Z., Cosentino, L., Maselli, V., Gambardella, L., Giambenedetti, M., Guidotti, M., Travaglione, S., Fallerini, C., et al. (2023) · Journal of Cellular and Molecular Medicine · doi:10.1111/jcmm.17624 · Cited by 2
Bone health and bisphosphonate treatment in females with Rett syndrome in a national center
Levy‐Shraga, Y., Goldmann, S., Gruber, N., et al. (2025) · Pediatric Research · doi:10.1038/s41390-025-04001-4 · Cited by 2
Ahmad, B., Dumbuya, J. S., Tang, J., Li, W., Chen, X., & Lu, J. (2025) · Mutation Research/Reviews in Mutation Research · doi:10.1016/j.mrrev.2025.108553 · Cited by 2
Shahib, A. K., & Rastegar, M. (2026) · Biology · doi:10.3390/biology15090687 · Cited by 2
“There is also current research with metabolic drugs (such as metformin and statins) indicating potential beneficial effects for RTT using mouse models [102–105].”
Petkar, M. A., & Rodrigo, T. (2020) · Journal of Cutaneous Pathology · doi:10.1111/cup.13943 · Cited by 2
“tially described by Andreas Rett, an Austrian pediatric neurologist in 1966,(4) RTT is a progressive neurodevelopmental disorder, caused by mutations in the X-linked gene MECP2, a ubiquitously expressed transcriptional regulator.(5) It is one of the most common causes of mental retardation in females.”
BackgroundBouzroud, W., Tazzite, A., Berrada, S., Gazzaz, B., & Dehbi, H. (2022) · Clinical Pathology · doi:10.1177/2632010x221124269 · Cited by 3
Experimental Zebrafish Models of Synaptopathies
Lebedev, A. S., Kotova, M. M., Kolesnikova, T. O., Ilyin, N. P., Galstyan, D. S., V’yunova, T. V., Petersen, E. V., & Kalueff, A. V. (2023) · Journal of Evolutionary Biochemistry and Physiology · doi:10.1134/s0022093023060169 · Cited by 2
Quirke, M. B., Alexander, D., Cassidy, L., Walsh, C., Masterson, K., Hill, K., & Brenner, M. (2024) · European Journal of Paediatric Neurology · doi:10.1016/j.ejpn.2024.02.015 · Cited by 2
Genomic insights into Rett syndrome-like features in Bangladeshi participants
Akter, H., Rahman, M. M., Mim, R. A., Rahaman, A., Eshaque, T. B., Hossain, S. A., Ganguly, A., Omar, F. B., Taniya, M. A., Hasan, N., et al. (2025) · Genetics in Medicine Open · doi:10.1016/j.gimo.2025.103438 · Cited by 2
Beyad, F., Bonyadi, M. J., & Barzegar, M. (2025) · International Journal of Developmental Neuroscience · doi:10.1002/jdn.70053 · Cited by 2
“Notable genetic factors associated with DD include the FMR1 gene located on the X chromosome, which causes fragile X syndrome, and the MECP2 gene (Kyle et al. 2018), responsible for Rett syndrome.”
Darwish, M., Obianom, O. N., Youakim, J. M., Darling, I. M., Lukáčová, V., & Bradley, H. (2024) · Advances in Therapy · doi:10.1007/s12325-024-02926-6 · Cited by 2
“Despite evidence of perturbations in cholesterol metabolism and fatty liver disease in Mecp2 -deficient mice [17], hepatic disease is rarely reported as a comorbidity in individuals with RTT.”
BackgroundSÍNDROME DE RETT NA ATENÇÃO PRIMÁRIA À SAÚDE: RELATO DE CASO
Toaza, E., Cella, G., Albarello, C. Z., et al. (2020) · Revista Interdisciplinar em Ciências da Saúde e Biológicas · doi:10.31512/ricsb.v4i2.190 · Cited by 2
Spectrum of MECP2 mutations in Iranian Azeri Turkish Rett syndrome patients
Nazm, S. A., Jahanafrooz, Z., Bonyadi, M. J., et al. (2023) · Neurology Asia · doi:10.54029/2023xvm · Cited by 1
Síndrome de Rett: uma abordagem diagnóstica, evolução clínica e revisão
Faleiro, I. D. F., Dultra, J. R., Abreu, V. L., Oliveira, L. H. D., Zambrin, G. C. V. B., Nicolai, N. L., Vargas, I. C., Frazão, C. Q., Gaboardi, K. R., de Souza, A. A., et al. (2023) · Brazilian Journal of Health Review · doi:10.34119/bjhrv6n5-174 · Cited by 1
Tan, X. Y., Zhu, B., Li, Y., et al. (2024) · BMC Anesthesiology · doi:10.1186/s12871-023-02379-4 · Cited by 1
“Many patients are wheelchair and/or gastrostomy-tube dependent in their motor deterioration stage [3].”
BackgroundKaraosmanoğlu, B., İmren, G., Ozisin, M. S., Reçber, T., Şimşek‐Kiper, P. Ö., Haliloğlu, G., Alikaşifoğlu, M., Nemutlu, E., Taşkıran, E. Z., & Ütine, G. E. (2024) · Molecular Biology Reports · doi:10.1007/s11033-024-09915-6 · Cited by 1
Roggero, O. M., Gualandi, N., Ciraci, V., Berutto, V., Carosati, E., & Tongiorgi, E. (2025) · Journal of Neurochemistry · doi:10.1111/jnc.70093 · Cited by 1
“…have recently reported that altered lipid and cholesterol biosynthesis is a hallmark of RTT (Pejhan and Rastegar 2021), that MeCP2 is involved in circadian clock regulation (Kyle et al. 2018) and that restoration of WNT signaling was beneficial in a RTT mouse model (Martínez de Paz et al. 2015).”
5-mC DNA methylation in neurodevelopment: from molecular mechanisms to therapeutic implications
Huang, D., Zhao, W., Sun, H. Y., Yang, C., & Jiang, L. (2025) · Molecular Biology Reports · doi:10.1007/s11033-025-10809-4 · Cited by 3
Deng, Y., Bu, C., Basang, Z., et al. (2025) · Birth Defects Research · doi:10.1002/bdr2.2521 · Cited by 1
Blagojevic-Stokic, N., Whiteley, P., Marlow, B. P., & Wills, J. (2026) · Brain Network Disorders · doi:10.1016/j.bnd.2026.04.002 · Cited by 2
Characteristics of “chūnibyō” identified by a questionnaire
Shimoda, M., Morimoto, K., Tanaka, Y., et al. (2021) · PLoS ONE · doi:10.1371/journal.pone.0260375 · Cited by 1
Rett syndrome – advances in gene and trofinetide therapy
Dąbrowska, A., Kruszewski, A., Paduszyńska, N., et al. (2024) · Aktualności Neurologiczne · doi:10.15557/an.2024.0010 · Cited by 1
Bricker, K., & Vaughn, B. V. (2024) · Sleep Medicine Research · doi:10.17241/smr.2024.02509 · Cited by 1
Steatotic liver disease diagnosed in a 24-year-old woman with Rett syndrome: a case report
Albino, L., Adatia, A., Thiesen, A., Halloran, B. P., Dong, V. M., & Moctezuma‐Velázquez, C. (2025) · Journal of International Medical Research · doi:10.1177/03000605241310158 · Cited by 1
“4,5 However, the clinical presentation and symptom severity vary, likely influenced by factors such as non-random X-inactivation, mutation type, and modifier genes.”
Espinoza, S., Kerr, B., Navia, C., Torres, R. F., Llontop, N., Valladares, V., Silva, C., Vivero, A., Novoa-Padilla, E., Mella, J., et al. (2025) · Biomolecules · doi:10.3390/biom15050748 · Cited by 2
“These mouse models recapitulate most but not all the RTT phenotype observed in RTT patients and have been extensively characterized [16,17,19–21].”
Myelolipoma After Infliximab Treatment for Crohn's Disease
Cesa, K. T., Puppa, E. L., Eslami, K., et al. (2022) · ACG Case Reports Journal · doi:10.14309/crj.0000000000000791 · Cited by 1
“Rett disease is a neurodevelopmental disorder caused by mutations in the X-linked gene methyl-CpG-binding protein 2, resulting in a range of phenotypes including regression of previously acquired speech and motor skills, repetitive hand movements, breathing irregularities, and seizures.(20) We were unable to identify…”
BackgroundBreathing Disturbances as Comorbidity of Rett Syndrome
Куликова, С. Л., Кузнецова, А. В., Савченко, М. А., Sa, L., Плешко, И. В., & Miasnikov, S. O. (2020) · Неврология и нейрохирургия Восточная Европа · doi:10.34883/pi.2020.10.1.043 · Cited by 1
Kamdar, P., Thomas, M. M., Yoganathan, S., Muthusamy, K., Koshy, B., Oommen, S. P., Aaron, R., Barney, A. M., Abraham, S. S. C., & Danda, S. (2020) · Journal of Genetics · doi:10.1007/s12041-020-01244-4
Song, N., Duan, C., Li, Y., Qian, T., Wang, Q., Zhao, W., & Wang, X. (2020) · Chinese Herbal Medicines · doi:10.1016/j.chmed.2020.05.012
“Particularly, Rett animal models which develop progressive neurological defects should be used to testify the hypothesis (Kyle et al., 2018; Guy et al., 2007; Kee et al., 2018; Rakela et al., 2018).”
BackgroundUrbinati, C., Cosentino, L., Evoli, M., et al. (2021) · European Neuropsychopharmacology · doi:10.1016/j.euroneuro.2021.01.048
Lung Defects Contribute to Respiratory Symptoms in a Mecp2-mutant Mouse Model of Rett Syndrome
Vashi, N. (2021) · TSpace (University of Toronto)
Self-citationInduced pluripotent stem cells for modeling of Rett Syndrome
Shekhar, B. R., & Das, D. K. (2021) · Elsevier eBooks · doi:10.1016/b978-0-323-85764-2.00014-4
Transcriptomic and epigenetic changes after the phenotypic rescue of a Rett Syndrome mouse model
Vargas-Landín, D. B. (2021) · UWA Profiles and Research Repository (UWA) · doi:10.26182/9kh2-8h70
Genetic determinants of autism spectrum disorders - a review
Stanicki, P., Goliszek, K., Kasprzak, K., & Makarewicz, A. (2021) · Current Problems of Psychiatry · doi:10.2478/cpp-2021-0011
“Disturbance of MECP2 expression has a negative impact on the formation and stabilization of synapses - synaptic plasticity - responsible mainly for learning and memory processes [57].”
BackgroundC5 単位量あたりの大きさの概念形成における記号論的連鎖に関する研究(C.【問題解決2(数学的考え方・活動等)】,論文発表の部)
稲田, 直. (2008) · 数学教育論文発表会論文集
Roza, E., ANDREI, R., & Teleanu, R. I. (2022) · Medicina Moderna - Modern Medicine · doi:10.31689/rmm.2021.29.2.149
Varderidou, S. (2022) · Utrecht University Repository (Utrecht University) · doi:10.33540/1458
Role of the gut microbiome in Rett syndrome
Albright, C., Friend, A., Peters, B., Reed, M. N., Suppiramaniam, V. D., & Bhattacharya, S. (2022) · Elsevier eBooks · doi:10.1016/b978-0-12-822238-6.00012-1
Maino, E., Scott, O., Rizvi, S. Z., Visuvanathan, S., Zablah, Y. B., Li, H., Sengar, A. S., Salter, M. W., Jia, Z., Rossant, J., et al. (2023) · bioRxiv (Cold Spring Harbor Laboratory) · doi:10.1101/2023.02.07.527511
The role of ketogenic therapy in developmental disorders
Taoulost, S., Rasgon, N., Ferretti, C. J., & Hollander, E. (2023) · Journal of Psychiatric Research · doi:10.1016/j.jpsychires.2023.03.025
Rose, K. (2023) · Elsevier eBooks · doi:10.1016/b978-0-443-18813-8.00020-7
An Overview of Rett Syndrome with its Homoeopathic Management
Das, M., & Verma, D. K. (2023) · International Journal of Health Sciences and Research · doi:10.52403/ijhsr.20230632
Braga, V. L. L., Pinheiro, M. D. A., Mariano, T. C., et al. (2023) · Brazilian Journal of Development · doi:10.34117/bjdv9n6-84
Role of MeCP2 in oligodendrocyte lineage cells in Rett syndrome: review and inference
Zhang, Z., Li, P., & Chen, Y. (2023) · Ageing and Neurodegenerative Diseases · doi:10.20517/and.2023.13
Cordone, V., Pecorelli, A., & Valacchi, G. (2023) · Elsevier eBooks · doi:10.1016/b978-0-443-19247-0.00011-4
Galisteo, R. P. R., Pinto, E. P., Palomo‐Carrión, R., Luque-Moreno, C., Molina‐Torres, G., & González‐Sánchez, M. (2023) · European Journal of Paediatric Neurology · doi:10.1016/j.ejpn.2023.09.008
Comparative analysis of the mitochondrial proteome in a mouse model of Rett syndrome
Golubiani, G. (2023) · eDiss (Georg-August-Universität Göttingen) · doi:10.53846/goediss-10054
Análisis del impacto emocional del Síndrome de Rett en el contexto familiar
González, N. G., & Abad, M. F. (2024) · Revista Complutense de Educación · doi:10.5209/rced.82975
Psychological Assessment of Autism Spectrum Disorders using Machine Learning
Thalor, M. A., & Patil, S. (2024) · International Journal of Educational and Psychological Sciences · doi:10.59890/ijeps.v2i1.1297
Glycosphingolipids and central nervous system–related diseases
Guo, Z. (2024) · Elsevier eBooks · doi:10.1016/b978-0-443-16156-8.00007-9
Experimental Models of Synaptopathies Based on Zebrafish
Lebedev, A. S., Kotova, M. M., Ilyin, N. P., Kolesnikova, T. O., Galstyan, D. S., V’yunova, T. V., Petersen, E. V., & Kalueff, A. V. (2023) · Российский физиологический журнал им И М Сеченова · doi:10.31857/s0869813923110092
The molecular signature of Rett syndrome
Sangani, N. B. (2024) · Research Publications (Maastricht University) · doi:10.26481/dis.20240702ns
Frucht, S. J., & Termsarasab, P. (2024) · Springer eBooks · doi:10.1007/978-3-031-52573-5_9
Sleep and Genetic Neurodevelopmental Disorders
Morse, A. M., & Strong, E. (2024) · Springer eBooks · doi:10.1007/978-3-031-62723-1_16
Complex dystonia in an adolescent male with a MECP2 variant
Baviera‐Muñoz, R., Jaijo, T., Campins‐Romeu, M., et al. (2024) · Neurología · doi:10.1016/j.nrl.2023.03.007
ABNORMALITAS SELULER DAN MOLEKULER PADA RETT SYNDROME YANG DIPENGARUHI MUTASI GEN MeCP2
Lestari, I. C., & Mustika, S. E. (2025) · Jurnal Kedokteran STM (Sains dan Teknologi Medik) · doi:10.30743/stm.v8i1.763
Mecp2: An Important Role in the Pathogenesis of RETT Syndrome
Zhou, Y. (2025) · Theoretical and Natural Science · doi:10.54254/2753-8818/2024.gu20117
Neuroglia pathology in genetic and epigenetic disorders of the central nervous system
Sarnat, H. B., & Rao, V. T. S. (2025) · Handbook of clinical neurology · doi:10.1016/b978-0-443-19102-2.00003-x · Cited by 1
Taoulost, S., Ferretti, C. J., Rasgon, N., & Hollander, E. (2025) · Current Treatment Options in Psychiatry · doi:10.1007/s40501-025-00349-w
Análise fenotípica e desafios clínicos associados a Síndrome de Rett: uma revisão de literatura
Pinheiro, J. A., de Sousa, L. L., & de Souza, L. K. M. (2025) · STUDIES IN HEALTH SCIENCES · doi:10.54022/shsv6n2-041
Vaccination of a Patient with Rett Syndrome: Case Report
Kaliuzhnaia, T. A., Fedoseenko, М. V., Vashakmadze, N. D., et al. (2025) · Педиатрическая фармакология · doi:10.15690/pf.v22i3.2913
Chaudhary, P. M., Pingale, R., Dongare, D., et al. (2025) · Research Journal of Pharmacology and Pharmacodynamics · doi:10.52711/2321-5836.2025.00034
Zlatic, S. A., Dammer, E. B., Crocker, A. J., Duong, D. M., Selfridge, J., Gadalla, K. K. E., Gokhale, A., Tobin, B. R., Wood, L. B., Zandl‐Lang, M., et al. (2025) · bioRxiv (Cold Spring Harbor Laboratory) · doi:10.1101/2025.08.30.673242 · Cited by 1
AbdelMaksoud, E., El-Saba, E., El-Maksoud, S. A., Eladrosy, W., & Elmogy, M. M. (2025) · Lecture notes in networks and systems · doi:10.1007/978-981-96-5013-2_3
Atypical Rett syndrome with chorea: a case report
Erdogan, M., Olinger, E. G., & Santos, S. F. (2025) · Acta Neurologica Belgica · doi:10.1007/s13760-025-02901-0
“MECP2 dysfunction alters synaptic activity by disrupting neurotransmitter release, excit - atory/inhibitory balance, and dopamine pathways [3].”
Communication and feeding skills in Rett syndrome: Case report
Voniati, L., & Georgiou, R. (2025) · Journal of Intellectual & Developmental Disability · doi:10.3109/13668250.2025.2568297
“…are characterised by specific developmental phases that delineate the progression of RTT: (i). stagnation (age 6–18 months); (ii) rapid regression (age 1–4 years); (iii) stationary (age 2 – potentially life); and (iv) motor deterioration (age 10 – life) (Kyle et al., 2018; Voniati et al., 2023).”
Rajagopalan, K., Rashid, N., Doshi, D., et al. (2025) · Frontiers in Pediatrics · doi:10.3389/fped.2025.1681103
Complex dystonia in an adolescent male with a MECP2 variant
Baviera‐Muñoz, R., Jaijo, T., Campins‐Romeu, M., et al. (2025) · Neurología (English Edition) · doi:10.1016/j.nrleng.2025.08.004
Wright, R., Li, J., Blankenship, J. M., Richards, J. C., Coenraads, M., von Hehn, J., Clay, I., Lyden, K. A., & Leonard-Corzo, K. S. (2025) · Digital Biomarkers · doi:10.1159/000548358
X chromosome: genetics, function, and health
Hanafi, W. N. W., & Ismail, N. H. (2025) · Elsevier eBooks · doi:10.1016/b978-0-443-33947-9.00011-6
Additional file 3 of Identification of chromosomal abnormalities in miscarriages by CNV-Seq
Shao, Y., Yang, S., Cheng, L., et al. (2024) · Figshare · doi:10.6084/m9.figshare.26682448
Additional file 1 of Identification of chromosomal abnormalities in miscarriages by CNV-Seq
Shao, Y., Yang, S., Cheng, L., et al. (2024) · Figshare · doi:10.6084/m9.figshare.25242213
Tan, X., Zhu, B., Li, Y., et al. (2024) · Figshare · doi:10.6084/m9.figshare.26657803
Su, T.-Y., Huang, Y.-C., Ko, J.-Y., et al. (2024) · Figshare · doi:10.6084/m9.figshare.24940917
Musokhranova, U., Grau, C., Vergara, C., Rodríguez‐Pascau, L., Xiol, C., Castells, A. A., Alcántara, S., Rodríguez‐Pombo, P., Pizcueta, P. M., Martinell, M., et al. (2024) · Figshare · doi:10.6084/m9.figshare.26632621
Su, T.-Y., Huang, Y.-C., Ko, J.-Y., et al. (2024) · Figshare · doi:10.6084/m9.figshare.24940682
Additional file 2 of Identification of chromosomal abnormalities in miscarriages by CNV-Seq
Shao, Y., Yang, S., Cheng, L., et al. (2024) · Figshare · doi:10.6084/m9.figshare.25242417
Deletion of Alg13 disrupts postnatal development and migration of GABAergic cortical interneurons
Liu, H., Qian, X., Ma, H., Liu, A. J., Li, S., Wang, X., Zhang, J., & Gao, P. (2026) · Frontiers in Neurology · doi:10.3389/fneur.2026.1757800
“Aberrations in interneuron development and maturation have been associated with various neuropsychiatric disorders, including epilepsy, Rett syndrome (40), West syndrome, autism spectrum disorder, and Alzheimer’s disease (41–43).”
Syndrome de Rett et implication des organes périphériques : de la physiopathologie à la thérapie
Borloz, E. (2021) · theses.fr (ABES) · doi:10.70675/6910a242za2edz4509zbc5aze548081377dd
Uncovering the sleep pathway in the social profile of Rett syndrome
Zhang, X. (2022) · theses.fr (ABES) · doi:10.70675/5bb1442czcae0z4a69zb3a7zf6e99af7583e
Metadata
- Authors
- Kyle, S. M., Vashi, N., & Justice, M. J.
- Affiliations
- Baylor College of Medicine (US)
- University of Toronto (CA)
- Corresponding author
- Justice, Monica J.
- Venue
- Open Biology
- Publisher
- The Royal Society
- Published
- 2018-02
- Volume
- 8
- Issue
- 2
- ISSN
- 2046-2441 (ISSN-L)
- PMC
- PMC5830535
- OpenAlex
- W2787504356
- Cited by
- 213
- References
- 224
- Citations by year
- 2026: 15 · 2025: 34 · 2024: 40 · 2023: 36 · 2022: 23 · 2021: 23 · 2020: 22 · 2019: 16 · 2018: 3
- FWCI
- 8.87
- Type
- journal article
- Language
- en
- Open access
- gold
- doi.org
- Locations
- Open Biology (publishedVersion, cc-by)
- PubMed (publishedVersion)
- Europe PMC (PubMed Central) (submittedVersion, cc-by)
- PubMed Central (submittedVersion, cc-by)
- DOAJ (DOAJ: Directory of Open Access Journals) (submittedVersion, cc-by-sa)
- Funders
- Angel Ava Fund
- Rett Syndrome Research Trust
- Topics
- Life Sciences › Biochemistry, Genetics and Molecular Biology › Genetics › Genetics and Neurodevelopmental Disorders
- Life Sciences › Neuroscience › Cellular and Molecular Neuroscience › Hereditary Neurological Disorders
- Life Sciences › Neuroscience › Cellular and Molecular Neuroscience › Genetic Neurodegenerative Diseases
- Keywords
- Rett syndrome, MeCP2, X-linked disorders, lipid metabolism, metabolic dysfunction, dietary intervention, pharmacological interventions, transcriptional regulation
- MeSH terms
- Animals, Brain, Disease Models, Animal, Female, Humans, Lovastatin, Mutation, Quality of Life, Rett Syndrome, Disease Progression, History, 20th Century, Lipid Metabolism, Mice, Methyl-CpG-Binding Protein 2, Drug Repositioning
About these checks
Registry, retraction, Cites and statistics results are computed, not judged, with one exception: a printed reference that no index lists is read once by a model before it counts as a citation error. Claims are extracted by a model and kept only when their quote appears verbatim in the text; each cited source is then checked, with a model’s help, for whether it says what the claim relies on. Those verdicts can be wrong — read the claim’s quote and the cited source before relying on one.
A language model drew the claims from the paper on 2026-10-27, under version 3 of the claim definition (model deepseek-v4.1-flash, prompt extract-v3).
A second model labelled each claim on 2026-10-27 (model jev-1.13-20260917, definition revision gold-guideline-v0.2).
Cited sources are checked with a language model’s help (gpt-6-sol).
Statistics and arithmetic are recomputed, not judged.
Confidence bands are shown only for fields calibrated on our annotated test set. None is calibrated yet, so no band is shown.
What counts as a claim ›How we measure confidence ›How we check this ›
Are you an author, or do you see a problem with this page? Request a review
