

The DOI matches its Crossref record; 159 of the 161 references it cites were found in a registry or an index.
Genome-wide scans for footprints of natural selection
Open accessAbstract
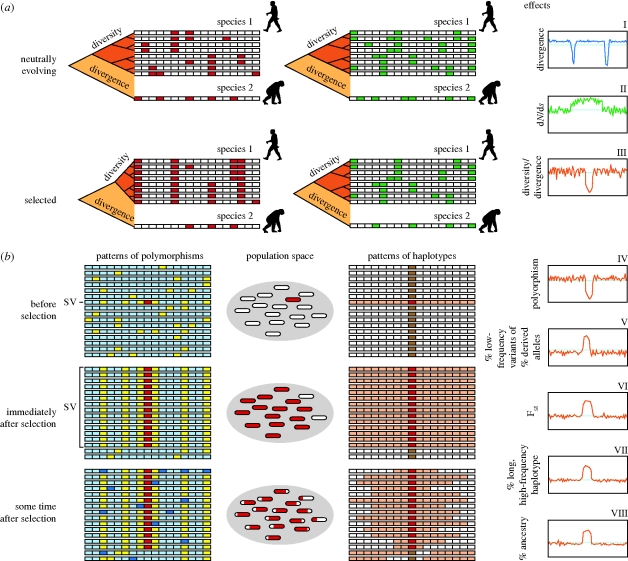
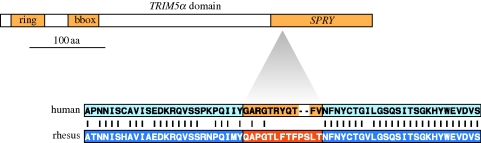
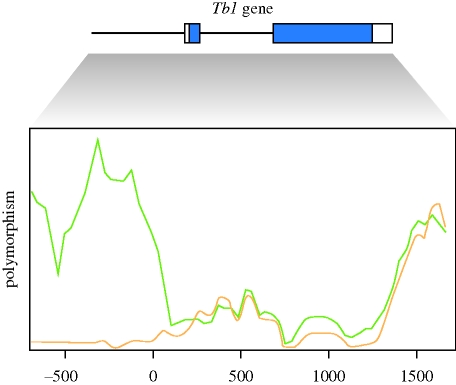
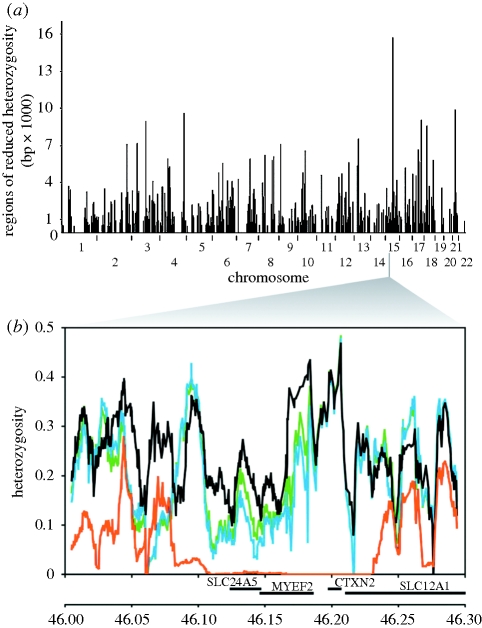
Detecting recent selected ‘genomic footprints’ applies directly to the discovery of disease genes and in the imputation of the formative events that molded modern population genetic structure. The imprints of historic selection/adaptation episodes left in human and animal genomes allow one to interpret modern and ancestral gene origins and modifications. Current approaches to reveal selected regions applied in genome-wide selection scans (GWSSs) fall into eight principal categories: (I) phylogenetic footprinting, (II) detecting increased rates of functional mutations, (III) evaluating divergence versus polymorphism, (IV) detecting extended segments of linkage disequilibrium, (V) evaluating local reduction in genetic variation, (VI) detecting changes in the shape of the frequency distribution (spectrum) of genetic variation, (VII) assessing differentiating between populations ( F ST ), and (VIII) detecting excess or decrease in admixture contribution from one population. Here, we review and compare these approaches using available human genome-wide datasets to provide independent verification (or not) of regions found by different methods and using different populations. The lessons learned from GWSSs will be applied to identify genome signatures of historic selective pressures on genes and gene regions in other species with emerging genome sequences. This would offer considerable potential for genome annotation in functional, developmental and evolutionary contexts.
Overview
The claims and statistics of this paper haven’t been checked yet.
Run the check — free, no account needed. It reads the open-access text and checks the sources it cites.
Integrity signals
Registry
Cites
Statistics
Figures
Verification
Claims the paper makes
The claims and statistics of this paper haven’t been checked yet.
Run the check — free, no account needed. It reads the open-access text and checks the sources it cites.
Claims other papers make about this one
Each is checked against this paper’s own text: does it say what the citing paper says it does?
The check wasn’t confident either way, so it gives no verdict — never disputed.
In the citing paper
“in agreement with Rsb being a powerful method to detect selection signature when the selected allele has reached fixation (Tang et al., 2007; Oleksyk et al., 2010; Bahbahani et al., 2018).”
From Identification of Candidate Signature Genes and Key Regulators Associated With Trypanotolerance in the Sheko Breed (2019) · cites this paper as Oleksyk et al., 2010
Experimental — accuracy not yet measured
Self-check
Percentages, sums and reported differences re-computed from the paper’s own numbers.
The self-check needs the paper’s full text.
Citations
Cites
Initial sequencing and analysis of the human genome
International Human Genome Sequencing Consortium, Whitehead Institute for Biomedical Research, C. F. G. R., Lander, E. S., Linton, L. M., Birren, B., Nusbaum, C., Zody, M. C., Baldwin, J., Devon, K., Dewar, K., et al. (2001) · Nature · doi:10.1038/35057062 · Cited by 24,216
Statistical method for testing the neutral mutation hypothesis by DNA polymorphism.
Tajima, F. (1989) · Genetics · doi:10.1093/genetics/123.3.585 · Cited by 14,056
THE GENETICAL STRUCTURE OF POPULATIONS
Wright, S. (1949) · Annals of Eugenics · doi:10.1111/j.1469-1809.1949.tb02451.x · Cited by 6,729
A haplotype map of the human genome
The International HapMap Consortium (2005) · Nature · doi:10.1038/nature04226 · Cited by 5,858
A second generation human haplotype map of over 3.1 million SNPs
The International HapMap Consortium (2007) · Nature · doi:10.1038/nature06258 · Cited by 4,438
Statistical tests of neutrality of mutations.
Fu, Y., & Li, W. (1993) · Genetics · doi:10.1093/genetics/133.3.693 · Cited by 4,067
The hitch-hiking effect of a favourable gene
Smith, J. M., & Haigh, J. (1974) · Genetical Research · doi:10.1017/s0016672300014634 · Cited by 3,415
Adaptive protein evolution at the Adh locus in Drosophila
McDonald, J. H., & Kreitman, M. (1991) · Nature · doi:10.1038/351652a0 · Cited by 3,313
A Map of Recent Positive Selection in the Human Genome
Voight, B. F., Kudaravalli, S., Wen, X., & Pritchard, J. K. (2006) · PLoS Biology · doi:10.1371/journal.pbio.0040072 · Cited by 2,925
The hitch-hiking effect of a favourable gene
Smith, J. M., & Haigh, J. (2007) · Genetics Research · doi:10.1017/s0016672308009579 · Cited by 2,675
Genome sequence, comparative analysis and haplotype structure of the domestic dog
members, B. S. P., Lindblad-Toh, K., Wade, C. M., Mikkelsen, T. S., Karlsson, E. K., Jaffe, D. B., Kamal, M., Clamp, M., Chang, J. L., Kulbokas, E. J., et al. (2005) · Nature · doi:10.1038/nature04338 · Cited by 2,568
Dean, M. C., Carrington, M. N., Winkler, C. A., Huttley, G. A., Smith, M. W., Allikmets, R. L., Goedert, J. J., Buchbinder, S., Vittinghoff, E., Gomperts, E. D., et al. (1996) · Science · doi:10.1126/science.273.5283.1856 · Cited by 2,503
Self-citationInitial sequence of the chimpanzee genome and comparison with the human genome
The Chimpanzee Sequencing and Analysis Consortium (2005) · Nature · doi:10.1038/nature04072 · Cited by 2,459
Genome-wide detection and characterization of positive selection in human populations
The International HapMap Consortium, Sabeti, P. C., Varilly, P., Fry, B., Lohmueller, J., Hostetter, E., Cotsapas, C., Xie, X., Byrne, E. H., McCarroll, S. A., et al. (2007) · Nature · doi:10.1038/nature06250 · Cited by 2,131
Detecting recent positive selection in the human genome from haplotype structure
Sabeti, P. C., Reich, D. E., Higgins, J. M., Levine, H. Z. P., Richter, D. J., Schaffner, S. F., Gabriel, S. B., Platko, J. V., Patterson, N. J., McDonald, G. J., et al. (2002) · Nature · doi:10.1038/nature01140 · Cited by 2,106
Hitchhiking Under Positive Darwinian Selection
Fay, J. C., & Wu, C.-I. (2000) · Genetics · doi:10.1093/genetics/155.3.1405 · Cited by 1,819
Evaluating loci for use in the genetic analysis of population structure
(1996) · Proceedings of the Royal Society B Biological Sciences · doi:10.1098/rspb.1996.0237 · Cited by 1,768
A Test of Neutral Molecular Evolution Based on Nucleotide Data
Hudson, R. R., Kreitman, M., & Aguadé, M. (1987) · Genetics · doi:10.1093/genetics/116.1.153 · Cited by 1,759
Nielsen, R., & Yang, Z. (1998) · Genetics · doi:10.1093/genetics/148.3.929 · Cited by 1,622
Convergent adaptation of human lactase persistence in Africa and Europe
Tishkoff, S. A., Reed, F. A., Ranciaro, A., Voight, B. F., Babbitt, C. C., Silverman, J. S., Powell, K., Mortensen, H. M., Hirbo, J. B., Osman, M., et al. (2007) · Nature Genetics · doi:10.1038/ng1946 · Cited by 1,615
Molecular evolution of FOXP2, a gene involved in speech and language
Enard, W., Przeworski, M., Fisher, S. E., Lai, C. S. L., Wiebe, V., Kitano, T., Monaco, A. P., & Pääbo, S. (2002) · Nature · doi:10.1038/nature01025 · Cited by 1,603
DISTRIBUTION OF GENE FREQUENCY AS A TEST OF THE THEORY OF THE SELECTIVE NEUTRALITY OF POLYMORPHISMS
Lewontin, R. C., & Krakauer, J. (1973) · Genetics · doi:10.1093/genetics/74.1.175 · Cited by 1,181
Genetic Signatures of Strong Recent Positive Selection at the Lactase Gene
Bersaglieri, T., Sabeti, P. C., Patterson, N. J., Vanderploeg, T. N., Schaffner, S. F., Drake, J. A., Rhodes, M. E., Reich, D., & Hirschhorn, J. N. (2004) · The American Journal of Human Genetics · doi:10.1086/421051 · Cited by 1,169
Identifying adaptive genetic divergence among populations from genome scans
Beaumont, M., & Balding, D. J. (2004) · Molecular Ecology · doi:10.1111/j.1365-294x.2004.02125.x · Cited by 1,161
Positive Natural Selection in the Human Lineage
Sabeti, P. C., Schaffner, S. F., Fry, B., Lohmueller, J., Varilly, P., Shamovsky, O., Palma, A., Mikkelsen, T. S., Altshuler, D., & Lander, E. S. (2006) · Science · doi:10.1126/science.1124309 · Cited by 1,157
How Malaria Has Affected the Human Genome and What Human Genetics Can Teach Us about Malaria
Kwiatkowski, D. P. (2005) · The American Journal of Human Genetics · doi:10.1086/432519 · Cited by 1,149
SLC24A5, a putative cation exchanger, affects pigmentation in zebrafish and humans
Lamason, R. L., Mohideen, M.-A. P. K., Mest, J. R., Wong, A. C., Norton, H. L., Aros, M. C., Jurynec, M. J., Mao, X., Humphreville, V. R., Humbert, J. E., et al. (2005) · Science · doi:10.1126/science.1116238 · Cited by 1,043
Identification of a variant associated with adult-type hypolactasia
Enattah, N. S., Sahi, T., Savilahti, E., Terwilliger, J. D., Peltonen, L., & Järvelä, I. E. (2002) · Nature Genetics · doi:10.1038/ng826 · Cited by 1,029
Genomic scans for selective sweeps using SNP dataPreprint
Nielsen, R., Williamson, S., Kim, Y., Hubisz, M. J., Clark, A. G., & Bustamante, C. D. (2005) · Genome Research · doi:10.1101/gr.4252305 · Cited by 1,026
VISTA : visualizing global DNA sequence alignments of arbitrary length
Mayor, C., Brudno, M., Schwartz, J. R., Poliakov, A., Rubin, E. M., Frazer, K. A., Pachter, L. S., & Dubchak, I. L. (2000) · Bioinformatics · doi:10.1093/bioinformatics/16.11.1046 · Cited by 1,017
Simple methods for testing the molecular evolutionary clock hypothesis.
Tajima, F. (1993) · Genetics · doi:10.1093/genetics/135.2.599 · Cited by 942
Interrogating a high-density SNP map for signatures of natural selection.Preprint
Akey, J., Zhang, G., Zhang, K., Jin, L., & Shriver, M. (2002) · Genome Research · doi:10.1101/gr.631202 · Cited by 932
Robbins, L. S. (1993) · Cell · doi:10.1016/0092-8674(93)90572-8 · Cited by 880
Natural selection on protein-coding genes in the human genome
Bustamante, C. D., Fledel-Alon, A., Williamson, S., Nielsen, R., Hubisz, M. J., Glanowski, S., Tanenbaum, D. M., White, T. J., Sninsky, J. J., Hernandez, R. D., et al. (2005) · Nature · doi:10.1038/nature04240 · Cited by 794
Lander, E., Linton, L., Birren, B. W., & Nusbaum, C. (2001) · Cited by 772
Genetic determinants of hair, eye and skin pigmentation in Europeans
Sulem, P., Gudbjartsson, D. F., Stacey, S. N., Helgason, A., Rafnar, T., Magnusson, K. P., Manolescu, A., Karason, A., Palsson, A., Thorleifsson, G., et al. (2007) · Nature Genetics · doi:10.1038/ng.2007.13 · Cited by 750
Tournamille, C., Colin, Y., Cartron, J. P., & Le Van Kim, C. (1995) · Nature Genetics · doi:10.1038/ng0695-224 · Cited by 741
The limits of selection during maize domestication
Wang, R.-L., Stec, A., Hey, J., Lukens, L., & Doebley, J. (1999) · Nature · doi:10.1038/18435 · Cited by 740
Beutler, E. (1994) · Blood · doi:10.1182/blood.v84.11.3613.bloodjournal84113613 · Cited by 737
Sawyer, S. L., Wu, L. I., Emerman, M., & Malik, H. S. (2005) · Proceedings of the National Academy of Sciences · doi:10.1073/pnas.0409853102 · Cited by 688
Synonymous and nonsynonymous rate variation in nuclear genes of mammals
Yang, Z., & Nielsen, R. (1998) · Journal of Molecular Evolution · doi:10.1007/pl00006320 · Cited by 640
Tishkoff, S. A., Varkonyi, R., Cahinhinan, N., Abbes, S., Argyropoulos, G., Destro-Bisol, G., Drousiotou, A., Dangerfield, B., Lefranc, G., Loiselet, J., et al. (2001) · Science · doi:10.1126/science.1061573 · Cited by 630
Genome 10K: A Proposal to Obtain Whole-Genome Sequence for 10 000 Vertebrate Species
Scientists, G. 1. C. O. (2009) · Journal of Heredity · doi:10.1093/jhered/esp086 · Cited by 552
CCR5 deficiency increases risk of symptomatic West Nile virus infection
Glass, W. G., McDermott, D., Lim, J. K., Lekhong, S., Yu, S., Frank, W. A., Pape, J., Cheshier, R. C., & Murphy, P. (2006) · Journal of Experimental Medicine · doi:10.1084/jem.20051970 · Cited by 543
Dating the Origin of the CCR5-Δ32 AIDS-Resistance Allele by the Coalescence of Haplotypes
Stephens, J. C., Reich, D. E., Goldstein, D. B., Shin, H. D., Smith, M. W., Carrington, M., Winkler, C., Huttley, G. A., Allikmets, R., Schriml, L., et al. (1998) · The American Journal of Human Genetics · doi:10.1086/301867 · Cited by 520
Self-citationOvcharenko, I., Nobrega, M. A., Loots, G. G., & Stubbs, L. (2004) · Nucleic Acids Research · doi:10.1093/nar/gkh355 · Cited by 519 · cited 3×
“Selection signatures can be observed by plotting the between-species divergence of homologous segments and comparing it with the genome-wide average: phylogenetic shadowing (Mayor et al. 2000; Ovcharenko et al. 2004).”
BackgroundRecent and ongoing selection in the human genome
Nielsen, R., Hellmann, I., Hubisz, M. J., Bustamante, C. D., & Clark, A. G. (2007) · Nature Reviews Genetics · doi:10.1038/nrg2187 · Cited by 513
The Signature of Positive Selection at Randomly Chosen Loci
Przeworski, M. (2002) · Genetics · doi:10.1093/genetics/160.3.1179 · Cited by 509
Evidence of positive selection acting at the human dopamine receptor D4 gene locus
Ding, Y. C., Chi, H. C., Grady, D., Morishima, A., Kidd, J., Kidd, K., Flodman, P., Spence, M., Schuck, S., Swanson, J., et al. (2001) · Proceedings of the National Academy of Sciences of the United States of America · doi:10.1073/pnas.012464099 · Cited by 506
Genomic insights into positive selection
Biswas, S., & Akey, J. M. (2006) · Trends in Genetics · doi:10.1016/j.tig.2006.06.005 · Cited by 483
Genetic Acceleration of AIDS Progression by a Promoter Variant of CCR5
Martin, M. P. (1998) · Science · doi:10.1126/science.282.5395.1907 · Cited by 473
Ongoing Adaptive Evolution of ASPM , a Brain Size Determinant in Homo sapiens
Mekel-Bobrov, N., Gilbert, S. L., Evans, P. D., Vallender, E. J., Anderson, J. R., Hudson, R. R., Tishkoff, S. A., & Lahn, B. T. (2005) · Science · doi:10.1126/science.1116815 · Cited by 463
A High-Density Admixture Map for Disease Gene Discovery in African Americans
Smith, M. W., Patterson, N., Lautenberger, J. A., Truelove, A. L., McDonald, G. J., Waliszewska, A., Kessing, B. D., Malasky, M. J., Scafe, C., Le, E., et al. (2004) · The American Journal of Human Genetics · doi:10.1086/420856 · Cited by 459
Self-citationLong-Range LD Can Confound Genome Scans in Admixed Populations
Price, A. L., Weale, M. E., Patterson, N., Myers, S. R., Need, A. C., Shianna, K. V., Ge, D., Rotter, J. I., Torres, E., Taylor, K. D., et al. (2008) · The American Journal of Human Genetics · doi:10.1016/j.ajhg.2008.06.005 · Cited by 443
Drift, admixture, and selection in human evolution: a study with DNA polymorphisms.
Bowcock, A. M., Kidd, J. R., Mountain, J. L., Hebert, J. M., Carotenuto, L., Kídd, K. K., & Cavalli-Sforza, L. L. (1991) · Proceedings of the National Academy of Sciences · doi:10.1073/pnas.88.3.839 · Cited by 415
The Genetic Architecture of Selection at the Human Dopamine Receptor D4 (DRD4) Gene Locus
Wang, E., Ding, Y.-C., Flodman, P. L., Kidd, J. R., Kídd, K. K., Grady, D. L., Ryder, O. A., Spence, M. A., Swanson, J. M., & Moyzis, R. K. (2004) · The American Journal of Human Genetics · doi:10.1086/420854 · Cited by 406
Chakraborty, R., & Weiss, K. (1988) · Proceedings of the National Academy of Sciences of the United States of America · doi:10.1073/pnas.85.23.9119 · Cited by 404
Evidence for Variable Selective Pressures at MC1R
Harding, R. M., Healy, E., Ray, A. J., Ellis, N. S., Flanagan, N., Todd, C., Dixon, C., Sajantila, A., Jackson, I. J., Birch-Machin, M. A., et al. (2000) · The American Journal of Human Genetics · doi:10.1086/302863 · Cited by 389
Melanocortin‐1 receptor structure and functional regulation
García-Borrón, J. C., Sánchez‐Laorden, B. L., & Jiménez‐Cervantes, C. (2005) · Pigment Cell Research · doi:10.1111/j.1600-0749.2005.00278.x · Cited by 382
Melanocortin Receptor 1 (MC1R) Mutations and Coat Color in Pigs
Kijas, J. M. H., Wales, R., Törnsten, A., Chardon, P., Moller, M. J., & Andersson, L. (1998) · Genetics · doi:10.1093/genetics/150.3.1177 · Cited by 377
Global landscape of recent inferred Darwinian selection for Homo sapiens
Wang, E. T., Kodama, G., Baldi, P., & Moyzis, R. K. (2005) · Proceedings of the National Academy of Sciences · doi:10.1073/pnas.0509691102 · Cited by 376
Initial sequence and comparative analysis of the cat genome
Pontius, J. U., Mullikin, J. C., Smith, D. R., Agencourt Sequencing Team, Lindblad-Toh, K., Gnerre, S., Clamp, M., Chang, J., Stephens, R., Neelam, B., et al. (2007) · Genome Research · doi:10.1101/gr.6380007 · Cited by 368
Self-citationThe genetics of pigmentation: from fancy genes to complex traits
Barsh, G. S. (1996) · Trends in Genetics · doi:10.1016/0168-9525(96)10031-7 · Cited by 358
Detection of the Signature of Natural Selection in Humans: Evidence from the Duffy Blood Group Locus
Hamblin, M. T., & Rienzo, A. D. (2000) · The American Journal of Human Genetics · doi:10.1086/302879 · Cited by 346
Marklund, L., Moller, M. J., Sandberg, K., & Andersson, L. (1996) · Mammalian Genome · doi:10.1007/s003359900264 · Cited by 322
Molecular Genetics and Evolution of Melanism in the Cat Family
Eduardo Eizirik, C., Yuhki, N., Johnson, W. E., Menotti-Raymond, M. A., Hannah, S. S., & O’Brien, S. J. (2003) · Current Biology · doi:10.1016/s0960-9822(03)00128-3 · Cited by 320
Self-citationO’Brien, S. J., & Nelson, G. W. (2004) · Nature Genetics · doi:10.1038/ng1369 · Cited by 319
Self-citationCYP3A variation and the evolution of salt-sensitivity variants.
Thompson, E., Kuttab-Boulos, H., Witonsky, D., Yang, L., Roe, B., & Rienzo, A. D. (2004) · American Journal of Human Genetics · doi:10.1086/426406 · Cited by 313
Evidence for Selective Advantage of Pathogenic FGFR2 Mutations in the Male Germ Line
Goriely, A., McVean, G., Rojmyr, M., Ingemarsson, B., & Wilkie, A. O. M. (2003) · Science · doi:10.1126/science.1085710 · Cited by 310
Genomic regions exhibiting positive selection identified from dense genotype data
Carlson, C. S., Thomas, D. J., Eberle, M. A., Swanson, J. E., Livingston, R. J., Rieder, M. J., & Nickerson, D. A. (2005) · Genome Research · doi:10.1101/gr.4326505 · Cited by 298
Libert, F. (1998) · Human Molecular Genetics · doi:10.1093/hmg/7.3.399 · Cited by 292
From Malaria to Chemokine Receptor: The Emerging Physiologic Role of the Duffy Blood Group Antigen
Hadley, T. J., & Peiper, S. C. (1997) · Blood · doi:10.1182/blood.v89.9.3077 · Cited by 291
High Polymorphism at the Human Melanocortin 1 Receptor Locus
Rana, B. K., Hewett‐Emmett, D., Li, J., Chang, B. H.-J., Sambuughin, N., Lin, M., Watkins, W. S., Bamshad, M. J., Jorde, L. B., Ramsay, M., et al. (1999) · Genetics · doi:10.1093/genetics/151.4.1547 · Cited by 284
A Genomewide Admixture Map for Latino Populations
Price, A. L., Patterson, N., Yu, F., Cox, D. R., Waliszewska, A., McDonald, G. J., Tandon, A., Schirmer, C., Neubauer, J., Bedoya, G., et al. (2007) · The American Journal of Human Genetics · doi:10.1086/518313 · Cited by 282
Osier, M. V., PAKSTIS, A. J., Soodyall, H., Comas, D., Goldman, D. A., Odunsi, A., Okonofua, F. E., Parnas, J., Schulz, L. O., Bertranpetit, J., et al. (2002) · The American Journal of Human Genetics · doi:10.1086/341290 · Cited by 280
Complex Signatures of Natural Selection at the Duffy Blood Group Locus
Hamblin, M. T., Thompson, E. E., & Rienzo, A. D. (2002) · The American Journal of Human Genetics · doi:10.1086/338628 · Cited by 278
Galvani, A. P., & Slatkin, M. (2003) · Proceedings of the National Academy of Sciences · doi:10.1073/pnas.2435085100 · Cited by 270
Olds, L. (2003) · Human Molecular Genetics · doi:10.1093/hmg/ddg244 · Cited by 255
O’Brien, S. J., & Moore, J. P. (2000) · Immunological Reviews · doi:10.1034/j.1600-065x.2000.17710.x · Cited by 254
Self-citationThe Geographic Spread of the CCR5 Δ32 HIV-Resistance Allele
Novembre, J., Galvani, A. P., & Slatkin, M. (2005) · PLoS Biology · doi:10.1371/journal.pbio.0030339 · Cited by 250
Melanocortin 1 Receptor Variants in an Irish Population
Smith, R., Healy, E., Siddiqui, S., Flanagan, N., Steijlen, P. M., Rosdahl, I. K., Jacques, J. P., Rogers, S., Turner, R., Jackson, I. J., et al. (1998) · Journal of Investigative Dermatology · doi:10.1046/j.1523-1747.1998.00252.x · Cited by 248
Disentangling the Effects of Demography and Selection in Human History
Stajich, J. (2004) · Molecular Biology and Evolution · doi:10.1093/molbev/msh252 · Cited by 241
A strong signature of balancing selection in the 5′ cis -regulatory region of CCR5
Bamshad, M. J., Mummidi, S., Gonzalez, E., Ahuja, S. S., Dunn, D. M., Watkins, W. S., Wooding, S., Stone, A. C., Jorde, L. B., Weiss, R. B., et al. (2002) · Proceedings of the National Academy of Sciences · doi:10.1073/pnas.162046399 · Cited by 236
Genetics of HIV-1infection: chemokine receptor CCR5 polymorphism and its consequences
Carrington, M. N. (1999) · Human Molecular Genetics · doi:10.1093/hmg/8.10.1939 · Cited by 235
Gonzalez, E., Dhanda, R., Bamshad, M., Mummidi, S., Geevarghese, R., Catano, G., Anderson, S. A., Walter, E. A., Stephan, K. T., Hammer, M. F., et al. (2001) · Proceedings of the National Academy of Sciences · doi:10.1073/pnas.091056898 · Cited by 225
Host Switch Leads to Emergence of Plasmodium vivax Malaria in Humans
Mu, J., Joy, D. A., Duan, J., Huang, Y., Carlton, J. M., Walker, J. C., Barnwell, J. W., Beerli, P., Charleston, M., Pybus, O. G., et al. (2005) · Molecular Biology and Evolution · doi:10.1093/molbev/msi160 · Cited by 220
Melanocortin 1 receptor variation in the domestic dog
Newton, J. M., Wilkie, A. L., He, L., Jordan, S. A., Bannasch, D. L., Holmes, N. G., Jackson, I. J., & Barsh, G. S. (2000) · Mammalian Genome · doi:10.1007/s003350010005 · Cited by 217
Mapping by admixture linkage disequilibrium: advances, limitations and guidelines
Smith, M. W., & O’Brien, S. J. (2005) · Nature Reviews Genetics · doi:10.1038/nrg1657 · Cited by 216
Self-citationThe Case for Selection at CCR5-Δ32
Sabeti, P. C., Walsh, E. C., Schaffner, S. F., Varilly, P., Fry, B., Hutcheson, H. B., Cullen, M., Mikkelsen, T. S., Roy, J., Patterson, N. J., et al. (2005) · PLoS Biology · doi:10.1371/journal.pbio.0030378 · Cited by 209
Self-citationAn upstream polymorphism associated with lactase persistence has increased enhancer activity
Troelsen, J. T., Olsen, J., Møller, J., & Sjöström, H. (2003) · Gastroenterology · doi:10.1053/j.gastro.2003.09.031 · Cited by 194
A Scan for Linkage Disequilibrium Across the Human Genome
Huttley, G. A., Smith, M. W., Carrington, M. N., & O’Brien, S. J. (1999) · Genetics · doi:10.1093/genetics/152.4.1711 · Cited by 193
Self-citationHuman pigmentation variation: evolution, genetic basis, and implications for public health
Parra, E. J. (2007) · American Journal of Physical Anthropology · doi:10.1002/ajpa.20727 · Cited by 191
Lactase haplotype diversity in the Old World.
Hollox, E., Poulter, M., Zvarík, M., Ferák, V., Krause, A., Jenkins, T., Saha, N., Kozlov, A., & Swallow, D. (2001) · American Journal of Human Genetics · doi:10.1086/316924 · Cited by 188
Recent Genetic Selection in the Ancestral Admixture of Puerto Ricans
Tang, H., Choudhry, S., Mei, R., Morgan, M. T., Rodríguez-Cintrón, W., Burchard, E. G., & RISCH, N. J. (2007) · The American Journal of Human Genetics · doi:10.1086/520769 · Cited by 177
Algorithms for Phylogenetic Footprinting
Blanchette, M., Schwikowski, B., & Tompa, M. (2002) · Journal of Computational Biology · doi:10.1089/10665270252935421 · Cited by 176
Lewinsky, R., Jensen, T. G. K., Møller, J., Stensballe, A., Olsen, J., & Troelsen, J. T. (2005) · Human Molecular Genetics · doi:10.1093/hmg/ddi418 · Cited by 176
Every genome sequence needs a good mapPreprint
Lewin, H. A., Larkin, D. M., Pontius, J. U., & O’Brien, S. J. (2009) · Genome Research · doi:10.1101/gr.094557.109 · Cited by 172
Self-citationGenetic Variation at the MC1R Locus and the Time since Loss of Human Body Hair
Rogers, A. R., Iltis, D., & Wooding, S. (2004) · Current Anthropology · doi:10.1086/381006 · Cited by 169
Spread of an Inactive Form of Caspase-12 in Humans Is Due to Recent Positive Selection
Xue, Y., Daly, A., Yngvadóttir, B., Liu, M., Coop, G., Kim, Y., Sabeti, P. C., Chen, Y., Stalker, J., Huckle, E. J., et al. (2006) · The American Journal of Human Genetics · doi:10.1086/503116 · Cited by 166
Mulcare, C., Weale, M., Jones, A. L., Connell, B., Zeitlyn, D., Tarekegn, A., Swallow, D., Bradman, N., & Thomas, M. G. (2004) · American Journal of Human Genetics · doi:10.1086/421050 · Cited by 165
The Human CC Chemokine Receptor 5 (CCR5) Gene
Mummidi, S., Ahuja, S. S., McDaniel, B. L., & Ahuja, S. K. (1997) · Journal of Biological Chemistry · doi:10.1074/jbc.272.49.30662 · Cited by 165
Chaudhuri, A., Polyakova, J., Zbrzezna, V., & Pogo, A. (1995) · Blood · doi:10.1182/blood.v85.3.615.bloodjournal853615 · Cited by 157
Lewontin-Krakauer test for neutral genes
Nei, M., & Maruyama, T. (1975) · Genetics · doi:10.1093/genetics/80.2.395 · Cited by 154
Nielsen, R., & Signorovitch, J. (2003) · Theoretical Population Biology · doi:10.1016/s0040-5809(03)00005-4 · Cited by 153
Evans, P. D., Mekel-Bobrov, N., Vallender, E. J., Hudson, R. R., & Lahn, B. T. (2006) · Proceedings of the National Academy of Sciences · doi:10.1073/pnas.0606966103 · Cited by 153
Comprehensive evaluation of allele frequency differences ofMC1Rvariants across populations
Gerstenblith, M. R., Goldstein, A. M., Fargnoli, M. C., Peris, K., & Landi, M. T. (2007) · Human Mutation · doi:10.1002/humu.20476 · Cited by 148
Novel Alleles of the Chemokine-Receptor Gene CCR5
Carrington, M. N., Kissner, T. L., Gerrard, B., Ivanov, S. V., O’Brien, S. J., & Dean, M. C. (1997) · The American Journal of Human Genetics · doi:10.1086/301645 · Cited by 148
Self-citationGoriely, A., McVean, G. A. T., van Pelt, A. M. M., O'Rourke, A. W., Wall, S. A., de Rooij, D. G., & Wilkie, A. O. M. (2005) · Proceedings of the National Academy of Sciences · doi:10.1073/pnas.0500267102 · Cited by 146
The nature of diversity and diversification at the ABO locus
Seltsam, A. W., Hallensleben, M., Kollmann, A., & Blasczyk, R. (2003) · Blood · doi:10.1182/blood-2003-03-0955 · Cited by 139
Functional variation of MC1R alleles from red-haired individuals
Healy, E. (2001) · Human Molecular Genetics · doi:10.1093/hmg/10.21.2397 · Cited by 138
Poulter, M., Hollox, E. J., Harvey, C. B., Mulcare, C. A., Peuhkuri, K., Kajander, K., Sarner, M., Korpela, R., & Swallow, D. M. (2003) · Annals of Human Genetics · doi:10.1046/j.1469-1809.2003.00048.x · Cited by 133
Nakajima, T., Wooding, S., Sakagami, T., Emi, M., Tokunaga, K., Tamiya, G., Ishigami, T., Umemura, S., Munkhbat, B., Jin, F., et al. (2004) · The American Journal of Human Genetics · doi:10.1086/420793 · Cited by 133
Positive Selection on a Human-Specific Transcription Factor Binding Site Regulating IL4 Expression
Rockman, M. V., Hahn, M. W., Soranzo, N., Goldstein, D. B., & Wray, G. A. (2003) · Current Biology · doi:10.1016/j.cub.2003.11.025 · Cited by 131
Boll, W., Wagner, P., & Mantei, N. (1991) · Europe PMC (PubMed Central) · Cited by 130
Detection of the CCR5-Δ32 HIV resistance gene in Bronze Age skeletons
Hummel, S., Schmidt, D., Kremeyer, B., Herrmann, B., & Oppermann, M. (2005) · Genes & Immunity · doi:10.1038/sj.gene.6364172 · Cited by 129
Fullerton, S., Bartoszewicz, A., Ybazeta, G., Horikawa, Y., Bell, G., Kidd, K., Cox, N., Hudson, R., & Rienzo, A. D. (2002) · American Journal of Human Genetics · doi:10.1086/339930 · Cited by 126
Nucleotide Variability at G6pd and the Signature of Malarial Selection in Humans
Saunders, M. A., Hammer, M. F., & Nachman, M. W. (2002) · Genetics · doi:10.1093/genetics/162.4.1849 · Cited by 123
The Duffy blood groups, vivax malaria, and malaria selection in human populations: a review.
Livingstone, F. B. (1984) · PubMed · Cited by 117
Population-Based Study of Natural Variation in the Melanocortin-1 Receptor Gene and Melanoma
Kanetsky, P. A., Rebbeck, T. R., Hummer, A., Panossian, S., Armstrong, B. K., Kricker, A., Marrett, L. D., Millikan, R. C., Gruber, S. B., Culver, H. A., et al. (2006) · Cancer Research · doi:10.1158/0008-5472.can-06-1634 · Cited by 114
Linkage disequilibrium in admixed populations: applications in gene mapping.
Briscoe, D., Stephens, J., & O'Brien, S. J. (1994) · Journal of Heredity · doi:10.1093/oxfordjournals.jhered.a111397 · Cited by 111
Self-citationPatterns of linkage disequilibrium in the MHC region on human chromosome 6p
Stenzel, A., Lu, T. T., Koch, W. A., Hampe, J., Guenther, S. M., Vega, F. M. D. L., Krawczak, M., & Schreiber, S. (2004) · Human Genetics · doi:10.1007/s00439-003-1075-5 · Cited by 109
Worldwide polymorphism at the MC1R locus and normal pigmentation variation in humans
Makova, K., & Norton, H. (2005) · Peptides · doi:10.1016/j.peptides.2004.12.032 · Cited by 101
Of mice and men: phylogenetic footprinting aids the discovery of regulatory elements.
Zhang, Z., & Gerstein, M. (2003) · Journal of Biology · doi:10.1186/1475-4924-2-11 · Cited by 100
Oleksyk, T. K., Zhao, K., Vega, F. M. D. L., Gilbert, D. A., O’Brien, S. J., & Smith, M. W. (2008) · PLoS ONE · doi:10.1371/journal.pone.0001712 · Cited by 97
Self-citationGanczakowski, M., Town, M., Bowden, D. K., Vulliamy, T., Kaneko, A., Clegg, J. B., Weatherall, D. J., & Luzzatto, L. (1995) · Europe PMC (PubMed Central) · Cited by 96
Evidence for positive selection and population structure at the human MAO-A gene
Gilad, Y., Rosenberg, S., Przeworski, M., Lancet, D., & Skorecki, K. L. (2002) · Proceedings of the National Academy of Sciences · doi:10.1073/pnas.022614799 · Cited by 96
Significant admixture linkage disequilibrium across 30 cM around the FY locus in African Americans.
Lautenberger, J., Stephens, J., O'Brien, S. J., & Smith, M. W. (2000) · American Journal of Human Genetics · doi:10.1086/302820 · Cited by 90
Self-citationHuman DNA Sequence Variation in a 6.6-kb Region Containing the Melanocortin 1 Receptor Promoter
Makova, K. D., Ramsay, M., Jenkins, T., & Li, W. (2001) · Genetics · doi:10.1093/genetics/158.3.1253 · Cited by 87
Molecular evolution of the brain size regulator genes CDK5RAP2 and CENPJ
Evans, P. D., Vallender, E. J., & Lahn, B. T. (2006) · Gene · doi:10.1016/j.gene.2006.02.019 · Cited by 84
Positive Selection in the Human Genome: From Genome Scans to Biological Significance
Kelley, J. L., & Swanson, W. J. (2008) · Annual Review of Genomics and Human Genetics · doi:10.1146/annurev.genom.9.081307.164411 · Cited by 84
Genome-wide screen for asthma in Puerto Ricans: evidence for association with 5q23 region
Choudhry, S., Taub, M. A., Mei, R., Rodríguez‐Santana, J., Rodríguez-Cintrón, W., Shriver, M. D., Ziv, E., RISCH, N. J., & Burchard, E. G. (2008) · Human Genetics · doi:10.1007/s00439-008-0495-7 · Cited by 83
Simulating genealogies of selected alleles in a population of variable size
Slatkin, M. (2001) · Genetics Research · doi:10.1017/s0016672301005183 · Cited by 82
Red hair is the null phenotype of MC1R
Beaumont, K. A., Shekar, S. N., Cook, A. L., Duffy, D. L., & Sturm, R. A. (2008) · Human Mutation · doi:10.1002/humu.20788 · Cited by 81
Positive Selection on MMP3 Regulation Has Shaped Heart Disease Risk
Rockman, M. V., Hahn, M. W., Soranzo, N., Loisel, D. A., Goldstein, D. B., & Wray, G. A. (2004) · Current Biology · doi:10.1016/j.cub.2004.08.051 · Cited by 79
Ayodo, G., Price, A. L., Keinan, A., Ajwang, A., OTIENO, M. F., Orago, A. S. S., Patterson, N. J., & Reich, D. (2007) · The American Journal of Human Genetics · doi:10.1086/519221 · Cited by 78
Natural selection and the evolutionary history of major histocompatibility complex loci
Hughes, A. L. (1998) · Frontiers in bioscience · doi:10.2741/a298 · Cited by 78
JOHN, P. R., MAKOVA, K., LI, W., JENKINS, T., & RAMSAY, M. (2003) · Annals of the New York Academy of Sciences · doi:10.1111/j.1749-6632.2003.tb03193.x · Cited by 72
Nachman, M. W., & Crowell, S. L. (2000) · Genetics · doi:10.1093/genetics/155.4.1855 · Cited by 71
Sub-Saharan African coding sequence variation and haplotype diversity at theNAT2gene
Patin, É., Harmant, C., Kidd, K., Kídd, K. K., Froment, A., Mehdi, S. Q., Sica, L., Heyer, É., & Quintana‐Murci, L. (2006) · Human Mutation · doi:10.1002/humu.9438 · Cited by 69
Fernandez, L., Milne, R., Bravo, J., Lopez, J., Avilés-Izquierdo, J. A., Longo-Imedio, M., Benitez, J. J., Lázaro, P., & Ribas, G. (2007) · Carcinogenesis · doi:10.1093/carcin/bgm084 · Cited by 68
Testing the Heterogeneity of F Values
Lewontin, R. C., & Krakauer, J. (1975) · Genetics · doi:10.1093/genetics/80.2.397 · Cited by 59
Molecular analysis of a new splice variant of the human melanocortin‐1 receptor
Tan, C. P., McKee, K. K., Weinberg, D. H., MacNeil, T., Palyha, O. C., Feighner, S. D., Hreniuk, D. L., der Ploeg, L. H. T. V., MacNeil, D. J., & Howard, A. D. (1999) · FEBS Letters · doi:10.1016/s0014-5793(99)00525-6 · Cited by 55
TRPV6 exhibits unusual patterns of polymorphism and divergence in worldwide populations
Akey, J. M. (2006) · Human Molecular Genetics · doi:10.1093/hmg/ddl134 · Cited by 53
Ojeda, A., Huang, L.-S., Ren, J., Angiolillo, A., Cho, I. C., Soto, H., Flores, C. L., Makuza, S. M., Folch, J. M., & Miguel Pérez-enciso, A. (2008) · Genetics · doi:10.1534/genetics.107.084269 · Cited by 53
Sequence Variation and Haplotype Structure at the Human HFE Locus
Toomajian, C., & Kreitman, M. (2002) · Genetics · doi:10.1093/genetics/161.4.1609 · Cited by 50
de Meaux, J., Hu, J., Tartler, U., & Goebel, U. (2008) · Proceedings of the National Academy of Sciences · doi:10.1073/pnas.0803218105 · Cited by 49
Andr�s, A., Soldevila, M., Navarro, A., Kidd, K., Oliva, B., & Bertranpetit, J. (2004) · Human Genetics · doi:10.1007/s00439-004-1179-6 · Cited by 44
Civetta, A., Rajakumar, S. A., Brouwers, B., & Bacik, J. P. (2005) · Molecular Biology and Evolution · doi:10.1093/molbev/msj074 · Cited by 42
Genetic Variant of Lactase‐Persistent C/T ‐13910 Is Associated with Bone Fractures in Very Old Age
Enattah, N. S., Sulkava, R. O., Halonen, P. M., KONTULA, K. K., & Järvelä, I. E. (2004) · Journal of the American Geriatrics Society · doi:10.1111/j.1532-5415.2005.53014.x · Cited by 42
Possible epistatic role of ADH7 in the protection against alcoholism
Osier, M. V., Lu, R. B., PAKSTIS, A. J., Kidd, J. R., Huang, S., & Kídd, K. K. (2003) · American Journal of Medical Genetics Part B Neuropsychiatric Genetics · doi:10.1002/ajmg.b.20136 · Cited by 40
Regional localization of the lactase‐phlorizin hydrolase gene, LCT, to chromosome 2q21
Harvey, C. B., FOX, M. F., Jeggo, P. A., Mantei, N., Povey, S., & Swallow, D. M. (1993) · Annals of Human Genetics · doi:10.1111/j.1469-1809.1993.tb01593.x · Cited by 40
Nucleotide diversity and population differentiation of the Melanocortin 1 Receptor gene, MC1R
Savage, S. A., Gerstenblith, M. R., Goldstein, A. M., Mirabello, L. J., Fargnoli, M. C., Peris, K., & Landi, M. T. (2008) · BMC Genetics · doi:10.1186/1471-2156-9-31 · Cited by 36
Sequence diversity and haplotype structure at the human CYP3A cluster
Thompson, E. E., Kuttab-Boulos, H., Yang, L., Roe, B. A., & Rienzo, A. D. (2005) · The Pharmacogenomics Journal · doi:10.1038/sj.tpj.6500347 · Cited by 36
Human populations show reduced DNA sequence variation at the factor IX locus.
Harris, E. E., & Hey, J. (2001) · Current Biology · doi:10.1016/s0960-9822(01)00223-8 · Cited by 35
Contrasting Histories of G6PD Molecular Evolution and Malarial Resistance in Humans and Chimpanzees
Verrelli, B. C., Tishkoff, S. A., Stone, A. C., & Touchman, J. W. (2006) · Molecular Biology and Evolution · doi:10.1093/molbev/msl024 · Cited by 34
Local adaptation and population differentiation at the interleukin 13 and interleukin 4 loci
Sakagami, T., Witherspoon, D. J., Nakajima, T., Jinnai, N., Wooding, S., Jorde, L. B., Hasegawa, T., Suzuki, E., Gejyo, F., & Inoue, I. (2004) · Genes and Immunity · doi:10.1038/sj.gene.6364109 · Cited by 28
Microsatellite Variation and Evolution of the Human Duffy Blood Group Polymorphism
Seixas, S., Ferrand, N., & Rocha, J. (2002) · Molecular Biology and Evolution · doi:10.1093/oxfordjournals.molbev.a004003 · Cited by 23
Tang, H., Choudhry, S., Mei, R., Morgan, M. T., Rodríguez-Cintrón, W., Burchard, E. G., & RISCH, N. J. (2008) · The American Journal of Human Genetics · doi:10.1016/j.ajhg.2008.06.009 · Cited by 9
Chen, X., Shi, H., Liu, X., & Su, B. (2006) · Gene · doi:10.1016/j.gene.2005.11.014 · Cited by 5
Cited by
Sorted by citations
Genomics and the future of conservation genetics
Allendorf, F. W., Hohenlohe, P. A., & Luikart, G. (2010) · Nature Reviews Genetics · doi:10.1038/nrg2844 · Cited by 1,641
Lotterhos, K. E., & Whitlock, M. C. (2015) · Molecular Ecology · doi:10.1111/mec.13100 · Cited by 588
Genome-Wide Scan for Adaptive Divergence and Association with Population-Specific Covariates
Gautier, M. (2015) · Genetics · doi:10.1534/genetics.115.181453 · Cited by 532
Guiblet, W. M., Zhao, K., O’Brien, S. J., Massey, S. E., Roca, A. L., & Oleksyk, T. K. (2015) · GigaScience · doi:10.1186/2047-217x-4-1 · Cited by 374
Self-citationYang, J. H., Li, W., Lv, F., He, S., Tian, S., Peng, W., Sun, Y., Zhao, Y., Tu, X.-L., Zhang, M., et al. (2016) · Molecular Biology and Evolution · doi:10.1093/molbev/msw129 · Cited by 350
Metadata
- Authors
- Oleksyk, T. K., Smith, M. W., & O'Brien, S. J.
- Affiliations
- Biology Department, University of Puerto Rico at Mayaguez, Mayaguez 00681, Puerto Rico
- National Cancer Institute (US)
- Laboratory of Genomic Diversity, National Cancer Institute at Frederick, Frederick, MD 21702, USA
- ORCID
- Smith, Michael W.
- Venue
- Philosophical Transactions of the Royal Society B: Biological Sciences
- Publisher
- The Royal Society
- Published
- 2010-01-12
- Volume
- 365
- Issue
- 1537
- Pages
- 185-205
- ISSN
- 0962-8436 (ISSN-L)
- 1471-2970
- PMC
- PMC2842710
- OpenAlex
- W2143606043
- Cited by
- 340
- References
- 161
- Citations by year
- 2026: 11 · 2025: 18 · 2024: 12 · 2023: 18 · 2022: 19 · 2021: 27 · 2020: 17 · 2019: 18 · 2018: 31 · 2017: 28 · 2016: 20 · 2015: 28 · 2014: 27 · 2013: 21 · 2012: 18
- FWCI
- 1.41
- Type
- journal article
- Language
- en
- Open access
- hybrid
- doi.org
- Locations
- Philosophical Transactions of the Royal Society B Biological Sciences (publishedVersion, cc-by)
- PubMed Central (publishedVersion, cc-by)
- PubMed (publishedVersion)
- NSUWorks (Nova Southeastern University) (submittedVersion)
- Funders
- U.S. Department of Health and Human Services
- National Institutes of Health
- National Cancer Institute (N01CO12400)
- Topics
- Life Sciences › Biochemistry, Genetics and Molecular Biology › Genetics › Forensic and Genetic Research
- Life Sciences › Biochemistry, Genetics and Molecular Biology › Genetics › Genetic Associations and Epidemiology
- Life Sciences › Biochemistry, Genetics and Molecular Biology › Genetics › Genetic diversity and population structure
- Keywords
- natural selection, linkage disequilibrium, genetic variation, genetic differentiation, F(ST), admixture, disease-associated genes, phylogenetic footprinting, functional mutations, genome annotation, human genome, animal genomes
- MeSH terms
- Animals, Base Sequence, Humans, Phylogeny, Selection, Genetic, Genetic Variation, Genome, Human, Evolution, Molecular, Genome-Wide Association Study
About these checks
Registry, retraction, Cites and statistics results are computed, not judged, with one exception: a printed reference that no index lists is read once by a model before it counts as a citation error. Claims are extracted by a model and kept only when their quote appears verbatim in the text; each cited source is then checked, with a model’s help, for whether it says what the claim relies on. Those verdicts can be wrong — read the claim’s quote and the cited source before relying on one.
Statistics and arithmetic are recomputed, not judged.
Confidence bands are shown only for fields calibrated on our annotated test set. None is calibrated yet, so no band is shown.
What counts as a claim ›How we measure confidence ›How we check this ›
Are you an author, or do you see a problem with this page? Request a review
