

Machine Learning Methods in Smart Lighting Toward Achieving User Comfort: A Survey
Open accessThe DOI matches its Crossref record; 416 of the 431 references it cites were found in a registry or an index; 13 of the 141 sources its claims cite were checked for support.
Abstract
Smart lighting has become a universal smart product solution, with global revenues of up to US $5.9 billion by 2021. Six main factors drive the technology: light-emitting diode (LED) lighting, sensors, control, analytics, and intelligence.
Overview
CoChat Summary
## TL;DR
This survey reviews smart lighting research from 1993 to 2021 and maps how machine learning is used to solve smart lighting problems, especially for user comfort. It argues that activity recognition is the most promising direction for improving user comfort, but current solutions still face cost, accuracy, and real-time constraints.
## Key findings
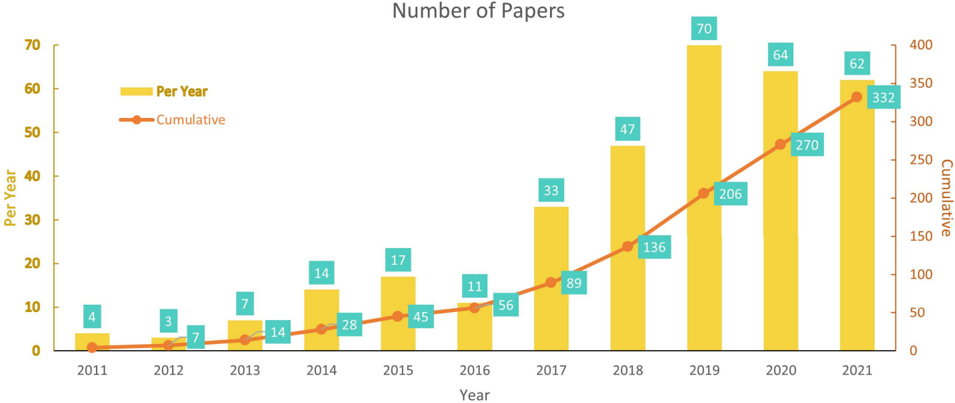
- The authors surveyed 332 papers on smart lighting and report that 59% of the publications were from 2019–2021.
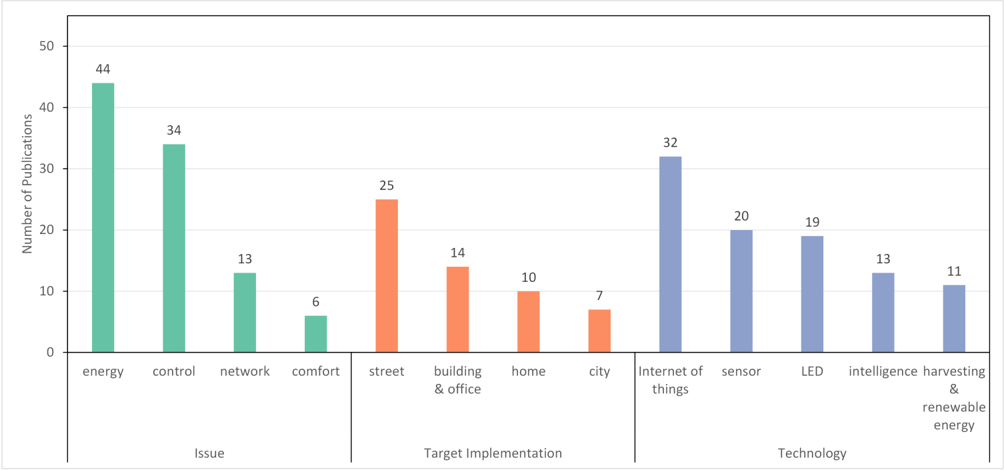
- From keyword-based classification, they found 4 main issues in smart lighting research (energy efficiency, computer network performance, control performance, and user comfort), 4 implementation targets (street lighting, building/office, home, and city), and 6 leading technologies (IoT, sensors, LED lights, intelligence, renewable energy, and energy harvesting).
- They identify 8 machine learning application areas in recent smart lighting research: predictive control, intelligent control, hand-gesture recognition, clustering, activity recognition, anomaly detection, optimization, computer vision, and elderly management.
- The paper reports that energy was the most popular topic with 44 papers, and only 6 papers discussed comfort in smart lighting.
- For user comfort metrics, the survey lists LUR, UNC, LCR, PRR, CCT, and others, and states that LUR = 1 is optimal while UNC is better when closer to 0.
## Methods
- The study is a systematic literature review (SLR) with stages of research question formulation, search strategy and selection, data extraction, and synthesis.
- Search and selection used inclusion criteria based on the strings “smart lighting,” “machine learning,” “user comfort,” and “activity recognition” in the title, with English or Indonesian papers from 1993 to 2021, available in Google Scholar, and in PDF or HTML format.
- The review analyzes the literature through topic classification, keyword extraction, and quality assessment, then synthesizes the results around smart lighting topics, machine learning methods, and user-comfort-related applications.
## Limitations
- The paper states that no survey paper had thoroughly discussed all machine learning techniques used in smart lighting research to achieve user comfort before this review.
- It says there is no existing research on activity recognition smart lighting that measures user comfort; this is explicitly presented as a research gap.
- Evident from the text: the review’s literature search is limited to papers available in Google Scholar and to English/Indonesian documents from 1993–2021, which may exclude relevant work in other languages or sources.
Model-written summary. Check it against the paper before relying on it.
Integrity signals
Registry
Cites
Statistics
Figures







Verification
Claims the paper makes
13 Valid · 36 Not valid · 136 Not checked · 97 Own results and interpretations
Every source the paper cites for this claim was checked and supports it.
In the paper
“Several environmental sensors play a role in this aspect, including magnetic switches, PIR sensors, and floor sensors [316].”
§ Machine Learning Methods in Smart Lighting Toward Achieving User Comfort: A Survey > 9) ELDERLY MANAGEMENT
What the sources say
- Supportedcites [316] source
The Introduction describes magnetic switches used to monitor an elderly person's movement. Sections 2.1 and 2.5 describe PIR motion sensors and floor sensors, respectively, as tools for elderly monitoring and care. (LLM, conf=0.91)
plainstates an association- Asserted: passes — The authors put it forward as true.
- Checkable: passes — It can be checked against evidence.
- Load-bearing: unclear — It is unclear whether the paper’s conclusions depend on it.
- Based: passes — The paper gives a reason why it holds.
- Supported
A result the paper reports from its own data — it cites no other source for it, so there is none to check. The quote shows it is in the paper.
In the paper
“We found six leading technologies through keyword searches in technology: IoT, sensors, LED lights, intelligence, renewable energy, and energy harvesting.”
§ Machine Learning Methods in Smart Lighting Toward Achieving User Comfort: A Survey > D. LITERATURE DEMOGRAPHICS
plain- Asserted: passes — The authors put it forward as true.
- Checkable: passes — It can be checked against evidence.
- Load-bearing: unclear — It is unclear whether the paper’s conclusions depend on it.
- Based: passes — The paper gives a reason why it holds.
- Rests on an assumption not shown here.
A result the paper reports from its own data — it cites no other source for it, so there is none to check. The quote shows it is in the paper.
In the paper
“The four main implementation targets obtained through keyword searches are street lighting, building and office, home, and city.”
§ Machine Learning Methods in Smart Lighting Toward Achieving User Comfort: A Survey > D. LITERATURE DEMOGRAPHICS
plain- Asserted: passes — The authors put it forward as true.
- Checkable: passes — It can be checked against evidence.
- Load-bearing: unclear — It is unclear whether the paper’s conclusions depend on it.
- Based: passes — The paper gives a reason why it holds.
- Rests on an assumption not shown here.
A result the paper reports from its own data — it cites no other source for it, so there is none to check. The quote shows it is in the paper.
In the paper
“Based on the keyword search on the issue, there are four main issues when people conduct smart lighting research: energy efficiency, computer network performance, control performance, and user comfort.”
§ Machine Learning Methods in Smart Lighting Toward Achieving User Comfort: A Survey > D. LITERATURE DEMOGRAPHICS
plain- Asserted: passes — The authors put it forward as true.
- Checkable: passes — It can be checked against evidence.
- Load-bearing: unclear — It is unclear whether the paper’s conclusions depend on it.
- Based: passes — The paper gives a reason why it holds.
- Rests on an assumption not shown here.
A result the paper reports from its own data — it cites no other source for it, so there is none to check. The quote shows it is in the paper.
In the paper
“There is an increasing trend where 59% of the publication year is within the range of 2019 -2021.”
§ Machine Learning Methods in Smart Lighting Toward Achieving User Comfort: A Survey > D. LITERATURE DEMOGRAPHICS
plainstates an association- Asserted: passes — The authors put it forward as true.
- Checkable: passes — It can be checked against evidence.
- Load-bearing: unclear — It is unclear whether the paper’s conclusions depend on it.
- Based: passes — The paper gives a reason why it holds.
- Rests on an assumption not shown here.
36 more claims
Create a free account to see all 282 claims and to verify the 26 references still open.
- Probably not a substantial claim. 225
- It may state two separate claims as one. 58
Self-check
Percentages, sums and reported differences re-computed from the paper’s own numbers.
Each contradiction between two passages listed here was confirmed by an independent check.
Rated minor: it would not touch a result — a value no result rests on, a p-value that stays on the same side of the significance level, or a conflict that is clerical, resolved elsewhere in the paper, or outside its own findings.
In the paper
§ Machine Learning Methods in Smart Lighting Toward Achieving User Comfort: A Survey > Abstract
“Six main factors drive the technology: light-emitting diode (LED) lighting, sensors, control, analytics, and intelligence.”
§ Machine Learning Methods in Smart Lighting Toward Achieving User Comfort: A Survey > A. MARKET TRENDS OF SMART LIGHTING
“There are six main driving factors in smart lighting: 1. light-emitting diode (LED) lighting, 2. sensors, 3. controls, 4. connectivity, 5. analytics, 6. intelligence.”
Citations
Cites
Items 201–400 of 416
PassiveVLP: Leveraging Smart Lights for Passive Positioning
Wang, W., Wang, Q., Zhang, J., & Zúñiga, M. A. (2020) · ACM Transactions on Internet of Things · doi:10.1145/3362123 · Cited by 26 · cited 1×
“Wang et al. [55] says that by adjusting the lighting level based on existing natural light, the intensity of light in an environment can be kept constant.”
BackgroundAhmad, M. W., Hippolyte, J.-L., & AA, C. (2017) · Building Simulation Conference proceedings · doi:10.26868/25222708.2017.525 · Cited by 24
Analysis of Hacking Related Trade in the Darkweb
Cherqi, O., Mezzour, G., Ghogho, M., & El Koutbi, M. (2018) · 2018 IEEE International Conference on Intelligence and Security Informatics (ISI) · doi:10.1109/isi.2018.8587311 · Cited by 24 · cited 1×
“Naïve Bayes can excel if used in the field of sentiment analysis or web crawling [412] [413].”
BackgroundTribo‐Induced Color Tuner toward Smart Lighting and Self‐Powered Wireless Sensing
Wang, J., Wang, H., Yin, K., & Zi, Y. (2021) · Advanced Science · doi:10.1002/advs.202004970 · Cited by 24 · cited 1×
“Still related to the color of LED lighting, Wang et al. [162] expanded the tribo-induced color tuning to evoke purple and pink colors.”
BackgroundSakai, Y., Itoh, Y., Jung, P., Kokeyama, K., Kozakai, C., Nakahira, K. T., Oshino, S., Shikano, Y., Takahashi, H., Uchiyama, T., et al. (2022) · Scientific Reports · doi:10.1038/s41598-022-13329-4 · Cited by 24 · cited 1×
“The main difference between unsupervised learning and its counterpart is that it does not require any predefined labels in the training [201].”
BackgroundHand Gesture Recognition Using an Android Device
Saxena, A., Jain, D. K., & Singhal, A. (2014) · International Conference on Communication Systems and Network Technologies · doi:10.1109/csnt.2014.170 · Cited by 23 · cited 1×
“Gesture recognition is a computer science technique to detect human gestures with mathematical algorithms [282].”
BackgroundAmeliasari, M., Putrada, A. G., & Pahlevi, R. R. (2021) · JURNAL INFOTEL · doi:10.20895/infotel.v13i2.656 · Cited by 22
Self-citationPredictive Control on Lettuce NFT-based Hydroponic IoT using Deep Neural Network
Nugroho, E. D., Putrada, A. G., & Rakhmatsyah, A. (2021) · International Symposium on Electronics and Smart Devices (ISESD) · doi:10.1109/isesd53023.2021.9501402 · Cited by 22 · cited 1×
“DNN is an ANN that has more than one hidden layer [232].”
Self-citationAn IoT Smart Lighting System for University Classrooms
Montalbo, F. J. P., & Enriquez, E. (2020) · International Symposium on Educational Technology · doi:10.1109/iset49818.2020.00011 · Cited by 21 · cited 1×
“[132] PIR Relay NodeMCU Server Database, Web Service Laptop Bootstrap Wi-Fi”
MethodEfficient photodetector placement for daylight-responsive smart indoor lighting control systems
Seyedolhosseini, A., Modarressi, M., Masoumi, N., & Karimian, N. (2021) · Journal of Building Engineering · doi:10.1016/j.jobe.2021.103013 · Cited by 21
Minimizing Electricity Cost through Smart Lighting Control for Indoor Plant Factories
Lork, C., Cubillas, M., Ng, B. K. K., Yuen, C., & Tan, M. R. (2020) · Annual Conference of the IEEE Industrial Electronics Society (IECON) · doi:10.1109/iecon43393.2020.9255061 · Cited by 21
Intelligent Control of Urban Lighting System Based on Video Image Processing Technology
Yun, Q., & Chun-lin, L. (2020) · IEEE Access · doi:10.1109/access.2020.3019284 · Cited by 21
Implementation of 6LoWPAN and Its Application in Smart Lighting
Huang, Z., & Yuan, F. (2015) · Journal of Computer and Communications · doi:10.4236/jcc.2015.33014 · Cited by 21 · cited 1×
“Thus, a routing protocol that has high compatibility and extensibility is needed, such as IPv6 over low-power Wireless Personal Area Networks (6LoWPAN) [124].”
BackgroundMathews, E., Guclu, S., Liu, Q., Ozcelebi, T., & Lukkien, J. (2017) · Energies · doi:10.3390/en10081187 · Cited by 21 · cited 1×
“The sensors commonly used in smart lighting are motion sensors, occupancy sensors, and light sensors [95].”
BackgroundIncreasing Passive RFID-Based Smart Shopping Cart Performance using Decision Tree
Yusuf, K., Abdurohman, M., & Putrada, A. G. (2019) · International Conference on Computing, Engineering and Design (ICCED) · doi:10.1109/icced46541.2019.9161139 · Cited by 21 · cited 1×
“Several methods are available to construct a decision tree, including iterative dichotomiser 3 (ID3) and classification and regression tree (CART) [183].”
MethodSelf-citationKaruniawati, S., Putrada, A. G., & Rakhmatsyah, A. (2021) · International Symposium on Electronics and Smart Devices (ISESD) · doi:10.1109/isesd53023.2021.9501863 · Cited by 21 · cited 1×
“An example of a method that uses bagging is random forest [220].”
MethodSelf-citationDaily Activity Recognition Using Pyroelectric Infrared Sensors and Reference Structures
Guan, Q., Li, C., Qin, L., & Wang, G. (2018) · IEEE Sensors Journal · doi:10.1109/jsen.2018.2885168 · Cited by 20 · cited 1×
“Environment-based activity recognition uses ambient sensors placed in the room, as is done by Guan et al. [324] which uses a PIR sensor.”
MethodEnergy Data Analytics for Nonintrusive Lighting Asset Monitoring and Energy Disaggregation
Wang, Y., Pandharipande, A., & Fuhrmann, P. (2018) · IEEE Sensors Journal · doi:10.1109/jsen.2018.2806994 · Cited by 20
Vinayakumar, R., Soman, K. P., Poornachandran, P., Akarsh, S., & Elhoseny, M. (2019) · Advanced sciences and technologies for security applications · doi:10.1007/978-3-030-16837-7_8 · Cited by 20 · cited 1×
“Deep learning is a subset method of machine learning where a model already includes feature extraction and selection [174].”
MethodMelanopic Limits of Metamer Spectral Optimisation in Multi-Channel Smart Lighting Systems
Zandi, B., Eissfeldt, A., Herzog, A., & Khanh, T. Q. (2021) · Energies · doi:10.3390/en14030527 · Cited by 19 · cited 1×
“Zandi et al. [161] say that it is related to the circadian effectiveness of smart lighting.”
BackgroundOn integration of multiple features for human activity recognition in video sequences
Kushwaha, A., Khare, A., & Srivastava, P. (2021) · Multimedia Tools and Applications · doi:10.1007/s11042-021-11207-1 · Cited by 19 · cited 1×
“Kushwaha et al. [323] combines discrete wavelet transform (DWT), local binary pattern (LBP), and histogram of gradients (HOG) in video-based activity recognition.”
BackgroundSmart Lumini: A Smart Lighting System for Academic Environments Using IOT-Based Open-Source Hardware
González-Amarillo, C. A., Cárdenas-García, C. L., Caicedo-Muñoz, J. A., & Mendoza-Moreno, M. A. (2020) · Revista Facultad de Ingeniería · doi:10.19053/01211129.v29.n54.2020.11060 · Cited by 19 · cited 1×
“Gonzalez et al. [33] state that a building’s energy consumption can reach almost zero.”
BackgroundIoT Based Solar Smart LED Street Lighting System
Muhamad, M., & Ali, M. I. M. (2018) · IEEE Region 10 Conference (TENCON) · doi:10.1109/tencon.2018.8650522 · Cited by 19 · cited 1×
“Muhammad et al. [151] said that renewable energy is essential because energy sources are increasingly limited while demand is increasing.”
BackgroundHybrid smart lighting and climate control system for buildings
Higuera, J., Carreras, J., Perálvarez, M., et al. (2014) · doi:10.1049/ic.2014.0047 · Cited by 19 · cited 1×
“[137] Light, PIR Dimmer, DALI TI MSP430 ThingSpeak Monitoring, Web Service Laptop Matlab REST”
BackgroundDesign of the Museum Interactive Lighting System Based on the Digital Twin Technology
Xu, L., Yan, S., Chen, Z., & Chen, X. (2021) · Scientific Programming · doi:10.1155/2021/4824417 · Cited by 19
Petritoli, E., Leccese, F., Botticelli, M., Pizzuti, S., & Pieroni, F. (2019) · ACTA IMEKO · doi:10.21014/acta_imeko.v8i2.614 · Cited by 19 · cited 1×
“Salem et al. Petrioli et al. [433] implemented reliability, availability, maintainability, and safety (RAMS) analysis in reducing the possibility of excessive spare parts procurement for up-scaling a smart street lighting system.”
BackgroundSmartVLC: When Smart Lighting Meets VLC
Wu, H., Wang, Q., Xiong, J., & Zuniga, M. (2017) · Proceedings of the 13th International Conference on emerging Networking EXperiments and Technologies · doi:10.1145/3143361.3149824 · Cited by 18 · cited 1×
“Flickering perception is an example of user comfort, which is calculated based on the lighting quality [351].”
BackgroundUnderstanding Older Adults’ Perception and Usage of Indoor Lighting in Independent Senior Living
Kim, D., Chang, C., & Margrett, J. (2021) · HERD: Health Environments Research & Design Journal · doi:10.1177/1937586720988616 · Cited by 18 · cited 1×
“Kim et al. [172] analyzed the technology adaptation of the elderly to smart lighting.”
BackgroundAfshari, S., Woodstock, T.-K., Imam, M. H. T., et al. (2015) · doi:10.1145/2821650.2821675 · Cited by 18
Gesture based IoT light control for smart clothing
Mohammed, A., Seeam, A. K., Bellekens, X., Nieradzinska, K., & Ramsurrun, V. (2016) · IEEE International Conference on Emerging Technologies and Innovative Business Practices for the Transformation of Societies (EmergiTech) · doi:10.1109/emergitech.2016.7737326 · Cited by 18 · cited 1×
“Mohammed et al. [287] utilizes smart clothing, namely wearable sensors attached to clothes, as a medium for executing gesture recognition.”
BackgroundSituation awareness in a smart home environment
Lee, S.-Y., & Lin, F. J. (2016) · IEEE World Forum on Internet of Things (WF-IoT) · doi:10.1109/wf-iot.2016.7845412 · Cited by 18
Lupión, M., Medina-Quero, J., Sanjuan, J. F., & Ortigosa, P. M. (2021) · Sensors · doi:10.3390/s21020405 · Cited by 18 · cited 1×
“Lupion et al. [328] developed environmental sensors-based activity recognition and implemented a sliding window to combine multiple sensor sources at once.”
BackgroundYang, Y., Xue, X., Huang, L., Gan, M., Tong, C., Wang, K., & Deng, J. (2020) · Journal of Cleaner Production · doi:10.1016/j.jclepro.2020.123244 · Cited by 17
Power-managed smart lighting using a semantic interoperability architecture
Bhardwaj, S., Syed, A. A., Özçelebi, T., et al. (2011) · IEEE Transactions on Consumer Electronics · doi:10.1109/tce.2011.5955175 · Cited by 17 · cited 1×
“Only in 2011 did the same author propose separation between the sensor-actuator (referred to as the end device) and the controller connected to the Internet connection [21].”
BackgroundSmart lighting system control strategies for commercial buildings: a review
Baharudin, N. H., Mansur, T. M. N. T., Ali, R., & Sobri, N. F. A. (2021) · International Journal of Advanced Technology and Engineering Exploration · doi:10.19101/ijatee.2020.s2762173 · Cited by 17 · cited 1×
“Baharudin et al. [ 170] conducted a review showing several comparisons between smart lighting and the existing building management system (BMS).”
BackgroundMijuskovic, A., Bemthuis, R., Aldea, A., & Havinga, P. (2020) · 2020 IEEE 24th International Enterprise Distributed Object Computing Workshop (EDOCW) · doi:10.1109/edocw49879.2020.00021 · Cited by 17 · cited 1×
“According to Mijuskovic et al. [46], cloud computing for smart lighting has advantages.”
MethodIntelligent distributed module for local control of lighting and electrical outlets in a home
Andramuño, J., Mendoza, E., Núñez, J., & Liger, E. (2021) · Journal of Physics: Conference Series · doi:10.1088/1742-6596/1730/1/012001 · Cited by 17 · cited 1×
“Andramuno et al. [78] argue that home automation combines automation technology, computing, and computer networks.”
BackgroundMir, M. S., Majlesein, B., Guzmán, B. G., et al. (2021) · doi:10.1145/3469264.3469805 · Cited by 17 · cited 1×
“Some exciting challenges are presented in the survey paper of Mir et al. [166] about VLC related to smart lighting.”
BackgroundPrediction of Smarthphone Charging using K-Nearest Neighbor Machine Learning
Ghassani, F., Abdurohman, M., & Putrada, A. G. (2018) · International Conference on Informatics and Computing (ICIC) · doi:10.1109/iac.2018.8780497 · Cited by 17 · cited 1×
“KNN is an algorithm that performs classification by looking at the similarity of the data, for example, with Euclidean distance [187].”
MethodSelf-citationClassification of Occupancy Sensor Anomalies in Connected Indoor Lighting Systems
Violatto, G., Pandharipande, A., Li, S., & Schenato, L. (2019) · IEEE Internet of Things Journal · doi:10.1109/jiot.2019.2914937 · Cited by 16
Enabling IoT empowered smart lighting solutions: A communication theoretic perspective
Zaidi, S. A. R., Imran, M. A., McLernon, D., et al. (2014) · IEEE Wireless Communications and Networking Conference Workshops (WCNCW) · doi:10.1109/wcncw.2014.6934875 · Cited by 16 · cited 1×
“DALI is an interface that provides interoperability in controlling lights from various products [121].”
BackgroundMulti-objective context-adaptive natural lighting system
Kwon, S.-Y., & Lim, J.-H. (2017) · Energy and Buildings · doi:10.1016/j.enbuild.2017.03.045 · Cited by 16 · cited 1×
“Kwon et al. [59] uses a parameter called Kruithof’s comfort curve to evaluate the performance of its smart lighting.”
BackgroundA machine learning approach for gesture recognition with a lensless smart sensor system
Normani, N., Urru, A., Abraham, L., Walsh, M. J., Tedesco, S. A., Cenedese, A., Susto, G. A., & O’Flynn, B. (2018) · Wearable and Implantable Body Sensor Networks · doi:10.1109/bsn.2018.8329677 · Cited by 16
Cost-Effective LED Dimming Driver With Single Chip Design for Smart Lighting System
Hsia, S., Sheu, M., & Ciou, J.-J. (2020) · IEEE Access · doi:10.1109/access.2020.3013302 · Cited by 16 · cited 1×
“According to Hsia et al. [34] there are two types of control in smart lighting, namely manual control and automatic control.”
MethodZhang, H., & Li, Z. (2019) · IEEE Access · doi:10.1109/access.2019.2909967 · Cited by 16 · cited 1×
“Zhang et al. [429] applies anomaly detection to faulty sensors in urban sensing at the installation stage with the assumption that damage can occur due to external factors from the environment.”
BackgroundSanjareh, M. B., Nazari, M. H., & Hosseinian, S. H. (2021) · International Transactions on Electrical Energy Systems · doi:10.1002/2050-7038.12976 · Cited by 15
Smart modules for lighting system applications and power quality measurements
Pinto, M. F., Soares, G. M., Mendonca, T. R. F., et al. (2014) · IEEE/IAS International Conference on Industry Applications (INDUSCON) · doi:10.1109/induscon.2014.7059448 · Cited by 15 · cited 1×
“Information that enters and leaves the system includes current sensor data and lamp control data [120].”
BackgroundSensitivity Analysis of a Neural Network based Avionic System by Simulated Fault and Noise Injection
Brandl, A., Battipede, M., Gili, P. A., et al. (2018) · AIAA Modeling and Simulation Technologies Conference · doi:10.2514/6.2018-0122 · Cited by 15 · cited 1×
“Brandl et al. [434] provide an example use of embedding sensitivity analysis into avionic virtual sensors with the use of neural networks.”
MethodGesture Based Operating System Control
Parkale, Y. V. (2012) · doi:10.1109/acct.2012.58 · Cited by 15 · cited 1×
“Hand gesture recognition is usable as an advanced control in a non-haptic human-machine interface (HMI) where users no longer need to use switches or conventional remote controls [285].”
BackgroundFuzzy Controller Design of Lighting Control System By Using VI Package
Saravanan, R. (2012) · IAES International Journal of Artificial Intelligence · doi:10.11591/ij-ai.v1i2.441 · Cited by 15
An energy efficient street lighting framework: ANN-based approach
Sikdar, P. L., & Thakurta, P. K. G. (2020) · Innovations in Systems and Software Engineering · doi:10.1007/s11334-020-00375-2 · Cited by 15
A Multidimensional Continuous Contextual Lighting Control System Using Google Glass
Zhao, N., Aldrich, M., Reinhart, C. F., & Paradiso, J. A. (2015) · ACM International Conference on Systems for Energy-Efficient Buildings, Cities, and Transportation (BuildSys) · doi:10.1145/2821650.2821673 · Cited by 14 · cited 1×
“Zhao et al. [344] proposes wearable-based smart lighting that uses Google Glasses for sensing.”
BackgroundLED Context Lighting System in Residential Areas
Kwon, S.-Y., Im, K.-M., & Lim, J.-H. (2014) · The Scientific World Journal · doi:10.1155/2014/851930 · Cited by 14
Smart Lighting System using Raspberry PI
Maslekar, A. K. A. (2015) · International Journal of Innovative Research in Science Engineering and Technology · doi:10.15680/ijirset.2015.0407011 · Cited by 14
Paulauskaitė-Tarasevičienė, A., Morkevičius, N., Janavičiūtė, A., Liutkevičius, A., Vrubliauskas, A., & Kazanavičius, E. (2015) · Elektronika ir Elektrotechnika · doi:10.5755/j01.eee.21.2.8772 · Cited by 14
Dwiyaniti, M., Nitisasmita, K. M., & Tohazen (2019) · Journal of Physics: Conference Series · doi:10.1088/1742-6596/1364/1/012034 · Cited by 14 · cited 1×
“Based on data from Dwiyaniti et al. [64], outdoor lighting in the United States (US), which mostly comes from roads and parking lots, consumes 120 hours of energy.”
MethodIOT-Based smart street lighting enhances energy conservation
Yusoff, Z. M., Muhammad, Z., Razi, M. S. I. M., Razali, N. F., & Hashim, M. H. C. (2020) · Indonesian Journal of Electrical Engineering and Computer Science · doi:10.11591/ijeecs.v20.i1.pp528-536 · Cited by 14 · cited 1×
“With Blynk, programmers can choose features for the user interface such as buttons, sliders, or gauge [115].”
MethodNa, J., Zhang, H., Deng, X., Zhang, B., & Ye, Z. (2020) · Lecture notes in computer science · doi:10.1007/978-3-030-65310-1_6 · Cited by 14
Overview of Smart Factory Studies in Petrochemical Industry
Li, D., Jiang, B., Suo, H., & Guo, Y. X. (2015) · Computer-aided chemical engineering/Computer aided chemical engineering · doi:10.1016/b978-0-444-63578-5.50009-8 · Cited by 14 · cited 1×
“Intelligent control is the use of AI techniques or machine learning in traditional control systems to deal with more complex problems [277].”
MethodDALI Bridge FPGA-Based Implementation in a Wireless Sensor Node for IoT Street Lighting Applications
Ordaz-García, O. O., Ortiz-López, M. A., Quiles-Latorre, F. J., et al. (2020) · Electronics · doi:10.3390/electronics9111803 · Cited by 14 · cited 1×
“Ordaz-García et al. [43] proposed shifting the DALI protocol on microcontrollers from software to hardware using a field-programmable gate array (FPGA).”
MethodImproving Smart Lighting with Activity Recognition Using Hierarchical Hidden Markov Model
Ramadhan, N. G., Putrada, A. G., & Abdurohman, M. (2019) · Indonesian Journal on Computing (Indo-JC) · doi:10.21108/indojc.2019.4.2.307 · Cited by 13 · cited 2×
“On the other hand, Ramadhan et al. [337] also has an accuracy above 90% but not as good as Dai et al. However, the solution is not extensive and uses a WSN where each node uses a low price PIR sensor.”
BackgroundMethodSelf-citationIntegration of microwave sensor into low cost indoor LED lamp — Element of smart lighting system
Tetervenoks, O., Suskis, P., & Stegura, J. (2017) · 2017 5th IEEE Workshop on Advances in Information, Electronic and Electrical Engineering (AIEEE) · doi:10.1109/aieee.2017.8270550 · Cited by 13 · cited 1×
“Tetervenoks et al. [101] adds that there are two kinds of motion sensors: active motion sensors and passive motion sensors.”
BackgroundSoheilian, M., Moadab, N. H., Fischl, G., & Aries, M. M. (2019) · Journal of Physics Conference Series · doi:10.1088/1742-6596/1343/1/012155 · Cited by 13 · cited 1×
“Soheilian et al. [27] stated that from 1993 to 2009, there was an increase in electricity consumption in housing by 32%.”
BackgroundHu, F., Holguín-Lerma, J. A., Mao, Y., Shen, C., Sun, X., Kong, M., Ng, T. K., Ooi, B. S., & Chi, N. (2020) · Broadband Access Communication Technologies XIV · doi:10.1117/12.2543983 · Cited by 13 · cited 1×
“Hu et al. [165] uses 443-nm GaN-based superluminescent diode (SLD), discrete-multiple-tone (DMT) modulation, and 256-QAM technology and gets speeds of up to 3.8 Gbit/s.”
BackgroundInfluentialShokraneh, F., & Adams, C. E. (2017) · Systematic Reviews · doi:10.1186/s13643-017-0546-z · Cited by 13 · cited 1×
“In data extraction, the author will usually fill out a form to collect data that has been extracted from a paper [16].”
MethodEvaluation of Street Lighting Efficiency Using a Mobile Measurement System
Tomczuk, P., Chrzanowicz, M., Jaskowski, P., & Budzynski, M. (2021) · Energies · doi:10.3390/en14133872 · Cited by 13 · cited 1×
“While according to Tomczuk et al. [65], in Europe, 1.3% of total energy consumption comes from roads.”
MethodInfluentialImproving Smart Lighting with Activity Recognition Using Hierarchical Hidden Markov Model
Ramadhan, N. G., Putrada, A. G., & Abdurohman, M. (2019) · Indonesian Journal on Computing (Indo-JC) · doi:10.34818/indojc.2019.4.2.307 · Cited by 13
Self-citationA smart-lighting emergency ballast for fluorescent lamps based on microcontroller
Alonso, J. M., Diaz, J., Blanco, C., & Rico, M. (2002) · Proceedings Eighth Annual Applied Power Electronics Conference and Exposition, · doi:10.1109/apec.1993.290717 · Cited by 12 · cited 1×
“1993 was the first time there was research on smart lighting [18].”
BackgroundBagaskara, H., Putrada, A. G., & Ariyanto, E. (2020) · International Conference on Interactive Digital Media (ICIDM) · doi:10.1109/icidm51048.2020.9339643 · Cited by 12 · cited 1×
“ID3 can only be used for classification, while CART can also be used for regression [184].”
MethodSelf-citationAhmed, M. O., Madkor, A. K., Makeen, P., Betelmal, S. E. I., Hassan, M. M., Abdelsamee, M. M., Ayman, A., El-Adly, M. H., Nessim, A., & Abdullatif, S. O. (2021) · WSEAS TRANSACTIONS ON ENVIRONMENT AND DEVELOPMENT · doi:10.37394/232015.2021.17.12 · Cited by 12 · cited 1×
“Ahmed et al. [93] say that there are several ways to measure LEDs.”
BackgroundPower efficient automated lights results to security for underground parking space
Vishwas, H. N., & Ullas, S. (2017) · International Conference on Inventive Computing and Informatics (ICICI) · doi:10.1109/icici.2017.8365214 · Cited by 12 · cited 1×
“Outdated and inefficient systems can also play a role in wasting energy [26].”
BackgroundAskola, J., Kärhä, P., Baumgartner, H., Porrasmaa, S., & Ikonen, E. (2022) · Lighting Research & Technology · doi:10.1177/14771535211008179 · Cited by 12 · cited 1×
“[88] revealed that LED lighting had become an essential driver in the industry in recent years.”
BackgroundSmart office for managing energy of lighting control system
Sakaci, F. H., Cetiner, E., Chaouch, H., & Yener, S. C. (2018) · 2018 6th International Istanbul Smart Grids and Cities Congress and Fair (ICSG) · doi:10.1109/sgcf.2018.8408951 · Cited by 12 · cited 1×
“Sakaci et al. [77] said that the consumption of electrical energy from office lighting has a correlation with the workload in the office and will increase during peak hours.”
BackgroundImaging Measurements for Public Lighting Predictive Maintenance
Galatanu, C.-D., Haba, C.-G., Petrisor, D., & Breniuc, L. (2019) · 2019 11th International Symposium on Advanced Topics in Electrical Engineering (ATEE) · doi:10.1109/atee.2019.8724910 · Cited by 12 · cited 1×
“Predictive control can also predict maintenance time for street lighting, as done by G˘al˘at , anu et al. [276].”
MethodRice consumption prediction using linear regression method for smart rice box system
Hanif, M. A., Abdurohman, M., & Putrada, A. G. (2020) · Jurnal Teknologi dan Sistem Komputer · doi:10.14710/jtsiskom.2020.13353 · Cited by 12 · cited 1×
“The formula for linear regression is as follows where Y is the dependent value, X i is the independent value, β 0 is the intercept, β 1 is the slope, i is the member of the independent variable, and n is the size of the dataset [195].”
BackgroundSelf-citationMP-Boost: Minipatch Boosting via Adaptive Feature and Observation Sampling
Toghani, M. T., & Allen, G. I. (2021) · IEEE International Conference on Big Data and Smart Computing (BigComp) · doi:10.1109/bigcomp51126.2021.00023 · Cited by 12 · cited 1×
“Toghani et al. [423] shows that the AdaBoost runtime is more elevated than random forest in all 13 datasets used for testing.”
BackgroundAdaptive light: a lighting control method aligned with dark adaptation of human vision
Takemura, Y., Ito, M., Shimizu, Y., Okano, K., & Okano, T. (2020) · Scientific Reports · doi:10.1038/s41598-020-68119-7 · Cited by 12 · cited 1×
“Takemura et al. [57] say that poor sleep quality can be affected by lighting that is too bright.”
BackgroundIman, A. N., Putrada, A. G., Prabowo, S., & Perdana, D. (2021) · Jurnal Elektro dan Telekomunikasi Terapan · doi:10.25124/jett.v8i1.3894 · Cited by 11
Self-citationResearch on intelligent lighting distributed control algorithm based on sensor network technology
Wang, B., & Wang, F. (2020) · Microprocessors and Microsystems · doi:10.1016/j.micpro.2020.103729 · Cited by 11
Automated Detection of Commissioning Changes in Connected Lighting Systems
Li, S., Pandharipande, A., Masini, B., & Caicedo, D. (2018) · IEEE Internet of Things Journal · doi:10.1109/jiot.2018.2865315 · Cited by 11
Simulation of Intelligent Room Lighting Illuminance Control
Makkar, D., & Syal, P. (2017) · IEEE International Conference on Computational Intelligence and Computing Research (ICCIC) · doi:10.1109/iccic.2017.8524356 · Cited by 11
Smart Shopping Prediction on Smart Shopping With Linear Regression Method
Nastiti, M. D., Abdurohman, M., & Putrada, A. G. (2019) · doi:10.1109/icoict.2019.8835271 · Cited by 11 · cited 1×
“Regression is a method in machine learning that is applicable to predict a continuous relationship of the dependent variable to the independent target variable [193].”
MethodSelf-citationCombining smart lighting and radio fingerprinting for improved indoor localization
Kanaris, L., Kokkinis, A., Liotta, A., & Stavrou, S. (2017) · IEEE International Conference on Networking, Sensing and Control (ICNSC) · doi:10.1109/icnsc.2017.8000134 · Cited by 11
Huber, M., Zaruba, G. V., Burns, N. B., & Daniel, K. M. (2017) · IEEE International Conference on Pervasive Computing and Communications Workshops (PerCom Workshops) · doi:10.1109/percomw.2017.7917595 · Cited by 11
Dinata, I. B. P. P., & Hardian, B. (2014) · doi:10.1109/icacsis.2014.7065885 · Cited by 11
An IoT Based Smart Lighting System Based on Human Activity
Adnan, N., Kamal, N., & Chellappan, K. (2019) · 2019 IEEE 14th Malaysia International Conference on Communication (MICC) · doi:10.1109/micc48337.2019.9037601 · Cited by 11 · cited 1×
“Adnan et al. [319] say that insufficient lighting can interfere with health, and lighting must be adjusted based on activity.”
BackgroundSmart lighting and switching using Internet of Things
Kumar, P., Rai, P., & Yadav, H. B. (2021) · International Conference on Cloud Computing, Data Science & Engineering (Confluence) · doi:10.1109/confluence51648.2021.9377078 · Cited by 10 · cited 1×
“[126] None Relay Arduino Uno None Mobile Android Application Bluetooth”
BackgroundIOT based Street Lighting Control System
Ananth, A. (2020) · International Journal of Emerging Trends in Engineering Research · doi:10.30534/ijeter/2020/118872020 · Cited by 10 · cited 1×
“ThingSpeak is a form of an open data platform for IoT [110].”
BackgroundIoT Drone Camera for a Paddy Crop Health Detector with RGB Comparison
Detiana Yucky, E. D., Gautama Putrada, A., & Abdurohman, M. (2021) · 2021 9th International Conference on Information and Communication Technology (ICoICT) · doi:10.1109/icoict52021.2021.9527421 · Cited by 10
Self-citationAnomaly Detection for Smart Lighting Infrastructure with the Use of Time Series Analysis
Andrysiak, T., & Saganowski, Ł. (2020) · JUCS - Journal of Universal Computer Science · doi:10.3897/jucs.2020.027 · Cited by 10
Performance analysis of smart lighting control system for sustainable campus operation
Mansur, T. M. N. T., Ali, R., Baharudin, N. H., & Ananda-Rao, K. (2021) · International Journal of Advanced Technology and Engineering Exploration · doi:10.19101/ijatee.2020.s2762179 · Cited by 10 · cited 1×
“Mansur et al. [156] consider that higher education institutes can play a more significant role in promoting energy efficiency and sustainability by implementing a smart campus.”
BackgroundBalbin, J. R., Padilla, D. A., Caluyo, F. S., et al. (2016) · IEEE International Conference on Control System, Computing and Engineering · doi:10.1109/iccsce.2016.7893612 · Cited by 10
Smart Lighting in Corridor Using Particle Swarm Optimization
Maharani, T., Abdurohman, M., & Putrada, A. G. (2019) · International Conference on Informatics and Computing (ICIC) · doi:10.1109/icic47613.2019.8985858 · Cited by 10 · cited 1×
“Maharani et al. [56] said that there is a contradiction when the lights turn off.”
BackgroundSelf-citationJoint Structural Learning to Rank with Deep Linear Feature Learning
Zhao, X., Li, X., & Zhang, Z. M. (2015) · IEEE Transactions on Knowledge and Data Engineering · doi:10.1109/tkde.2015.2426707 · Cited by 9 · cited 1×
“Deep learning’s ability to perform its feature extraction and selection is called feature learning [175].”
BackgroundArif, Y. R., Putrada, A. G., & Pahlevi, R. R. (2021) · International Symposium on Electronics and Smart Devices (ISESD) · doi:10.1109/isesd53023.2021.9501914 · Cited by 9 · cited 1×
“Arif et al. [424] prove that with a similar performance in computer vision, CNN has a higher time delay compared to simple methods such as Haar-Cascade.”
MethodSelf-citationIllumination Modeling Method for Office Lighting Control by Using RBFNN
Si, W., Pan, X., Ogai, H., et al. (2014) · IEICE Transactions on Information and Systems · doi:10.1587/transinf.2013edp7384 · Cited by 9
Prediction horizons in polyagent models
Parunak, H. V. D., Belding, T. C., & Brueckner, S. (2007) · Adaptive Agents and Multi-Agents Systems · doi:10.1145/1329125.1329298 · Cited by 9 · cited 1×
“The prediction horizon is the extent to which a model can predict the future [272].”
BackgroundSurvey of indoor optical camera communication (OCC) systems for the Internet of lights
Vu, T. L., Nguyen, T., Kim, C. S., et al. (2017) · International Conference on Information and Communication Technology Convergence (ICTC) · doi:10.1109/ictc.2017.8190758 · Cited by 9 · cited 1×
“Vu et al. [48] mention that visible light has the potential to be used as communication in smart lighting.”
BackgroundArchitecture and Its Vulnerabilities in Smart-Lighting Systems
Hofer, F., & Russo, B. (2022) · Springer eBooks · doi:10.1007/978-3-031-05516-4_10 · Cited by 9
A Vehicle Movement Based Self-Organized Solar Powered Street Lighting
Qaisar, S. M., Alzahrani, W. M., Almojalid, F. M., & Hammad, N. S. (2019) · 2019 IEEE 4th International Conference on Signal and Image Processing (ICSIP) · doi:10.1109/siprocess.2019.8868384 · Cited by 9 · cited 1×
“Data from Qaisar et al. [63] shows that street lamps worldwide have an energy consumption of 8760 Giga Watt-hour (GWh).”
Context-Aware Smart Door Lock with Activity Recognition Using Hierarchical Hidden Markov Model
Putrada, A. G., Ramadhan, N. G., & Abdurohman, M. (2020) · Kinetik Game Technology Information System Computer Network Computing Electronics and Control · doi:10.22219/kinetik.v5i1.904 · Cited by 9 · cited 1×
“In the field of security, activity recognition is applicable to determine the desired level of home security [295].”
BackgroundSelf-citationPower-managed smart lighting using a semantic interoperability architecture
Bhardwaj, S., Syed, A. A., Özçelebi, T., & Lukkien, J. J. (2011) · International Conference on Consumer Electronics · doi:10.1109/icce.2011.5722848 · Cited by 9
Errors Nature of the Narrowband PLC Transmission in Smart Lighting LV Network
Kiedrowski, P. (2016) · International Journal of Distributed Sensor Networks · doi:10.1155/2016/9592679 · Cited by 8 · cited 1×
“Digital modulation methods such as binary phase-shift keying (BPSK) and quadrature phase-shift keying (QPSK) can be used over OFDM on PLC [50].”
MethodStreet Lamp Fault Diagnosis System Based on Extreme Learning Machine
Lee, Y., Zhang, H., & Rosa, J. (2019) · IOP Conference Series Materials Science and Engineering · doi:10.1088/1757-899x/490/4/042053 · Cited by 8
Ravi, A., Galmath, K., Hu, S., et al. (2021) · ACM International Conference on Systems for Energy-Efficient Buildings, Cities, and Transportation (BuildSys) · doi:10.1145/3486611.3486657 · Cited by 8 · cited 1×
“Ravi et al. [208] uses DBSCAN to cluster the pixel values of a camera to get the lux value of each cluster.”
BackgroundCloud-based energy efficient smart street lighting system
cholar, D. O. C. S., & Umar, M. (2020) · Indian Journal of Science and Technology · doi:10.17485/ijst/v13i23.636 · Cited by 8 · cited 1×
“Omar et al. [61] revealed that because street lamps are a necessary facility of a city, the consumption of streetlamps will also affect the economic condition of a country.”
BackgroundIntegrated Lighting Enabler System Using M2M Platforms for Enhancing Energy Efficiency
Abdurohman, M., Putrada, A. G., Prabowo, S., Wijiutomo, C. W., & Elmangoush, A. (2018) · Journal of Information Processing Systems · doi:10.3745/jips.03.0103 · Cited by 8 · cited 1×
“So to communicate with the Internet to form an IoT platform, Arduino can be combined with NodeMCU [106].”
MethodSelf-citationAdaptive Smart Lighting Control based on Genetic Algorithm
Ngo, M. H., Nguyen, X. V. C., Duong, Q. K., & Nguyen, H. S. (2019) · 2019 25th Asia-Pacific Conference on Communications (APCC) · doi:10.1109/apcc47188.2019.9026473 · Cited by 8
The Effect of Utilizing Distributed Intelligent Lighting System for Energy Consumption in the Office
Hajjaj, M., Miki, M., & Shimohara, K. (2020) · Applied Sciences · doi:10.3390/app10062004 · Cited by 8 · cited 1×
“Hajjaj et al. [75] explains that apart from energy consumption, office lighting can also affect work productivity.”
BackgroundKatz, M., Ahmed, I., Laru, J., & Hakkinen, J. (2020) · 2020 South American Colloquium on Visible Light Communications (SACVC) · doi:10.1109/sacvlc50805.2020.9129897 · Cited by 8 · cited 1×
“The proposal of Katz et al. [164] is to bring convergence between smart lighting and VLC.”
BackgroundMudGet: Reproduction of the desired lighting environment using a smart-LED
Kim, Y. H., Lee, Y. Y., Ahmed, B., Son, M. G., Choi, J., Lee, J. H., & Lee, K. H. (2017) · Journal of Computational Design and Engineering · doi:10.1016/j.jcde.2017.02.006 · Cited by 8 · cited 1×
“According to Kim et al. [89], LED lighting is also a driving force in customized interior-lighting design.”
BackgroundAnomalous occupancy sensor behavior detection in connected indoor lighting systems
Violatto, G., Pandharipande, A., Li, S., et al. (2019) · IEEE World Forum on Internet of Things (WF-IoT) · doi:10.1109/wf-iot.2019.8767217 · Cited by 8
Fuzzy membership function optimization for smart LED lamp using particle swarm optimization
Choeychuen, K. (2018) · International Workshop on Advanced Image Technology (IWAIT) · doi:10.1109/iwait.2018.8369808 · Cited by 8
On / Off Optimization of Public Lighting Systems Depending on the Road Class
Gălățanu, C. D. (2020) · Procedia Manufacturing · doi:10.1016/j.promfg.2020.03.055 · Cited by 8 · cited 1×
“Meanwhile, according to Galatanu et al. [69], using the astronomical clock to turn the lights on and off will cause problems.”
MethodAn Improvement of Led Lighting System Accuracy with Voltage Control System
Abdurohman, M., Nugraha, R., & Gautama Putrada, A. (2020) · 2020 Fifth International Conference on Informatics and Computing (ICIC) · doi:10.1109/icic50835.2020.9288576 · Cited by 7 · cited 1×
“Abdurohman et al. [92] explains that the dimming capability of LED lighting can add to the savings already obtained from manually turning on and off settings.”
BackgroundSelf-citationComplex Deep Learning and Evolutionary Computing Models in Computer Vision
Li, Z., Lim, C. P., & Han, J. (2019) · Complexity · doi:10.1155/2019/1671340 · Cited by 7 · cited 1×
“Computer vision is a technique for obtaining a high-level understanding of the [307] image or video.”
MethodSmart Classroom for Electricity-Saving with Integrated IoT System
Nasrudin, M. W., Nordin, N. A., Ismail, I., et al. (2021) · Journal of Physics Conference Series · doi:10.1088/1742-6596/2107/1/012019 · Cited by 7 · cited 1×
“Blynk can do monitoring functions and also control functions [116].”
BackgroundXu, X., Sasaki, W., Yu, C.-C., et al. (2014) · IEEE/SICE International Symposium on System Integration (SII) · doi:10.1109/sii.2014.7028074 · Cited by 7 · cited 1×
“Xu et al. [191] used and compared SVM and naïve Bayes to classify street light conditions using the light sensor on a smartphone.”
MethodSmart Adaptable Indoor Lighting System (SAILS)
Bouzid, S. E., M'BARKI, M. A., Dridi, C., et al. (2019) · IEEE International Conference on Design & Test of Integrated Micro & Nano-Systems (DTS) · doi:10.1109/dtss.2019.8915261 · Cited by 7 · cited 1×
“The research produced by Bouzid et al. [147] shows that with intelligence, the savings obtained are 77% more significant than without intelligence.”
MethodInternet-of-Things for Smart Street Lighting System using ESP8266 on Mesh Network
Fuada, S., Adiono, T., & Siregar, L. (2021) · International Journal of Recent Contributions from Engineering Science & IT (iJES) · doi:10.3991/ijes.v9i2.22877 · Cited by 7 · cited 1×
“NodeMCU has a Wi-Fi module built into its chip and can expand to Arduino’s Integrated Development Environment (IDE) [107].”
BackgroundReal Time Adaptive Street Lighting System
Garg, S., Ahuja, S., & Randhawa, S. (2020) · Communications in computer and information science · doi:10.1007/978-981-15-3666-3_19 · Cited by 7 · cited 1×
“[140] Light, PIR Dimmer Arduino, ESP8266 ThingSpeak Monitoring, Web Service Mobile Blynk Wi-Fi, REST”
BackgroundSmart Light Recommending System Using Artificial Neural Network Algorithm
Akbar, M. F., Gautama Putrada, A., & Abdurohman, M. (2019) · 2019 7th International Conference on Information and Communication Technology (ICoICT) · doi:10.1109/icoict.2019.8835192 · Cited by 6 · cited 1×
“On the other hand, but still related, Akbar et al. [58] underlines that one of the causes of wasting electricity is the use of lights when people are asleep.”
BackgroundSelf-citationAn Internet of Things (IoT) Model for Optimising Downtime Management: A Smart Lighting Case Study
Scholtz, B. M., Kapeso, M., & Belle, J.-P. V. (2019) · IFIP advances in information and communication technology · doi:10.1007/978-3-030-15651-0_9 · Cited by 6
Home Automation through Smart Lighting, Smart Security and other Appliances
Rajarajeswari, S., Usha Rani, S., Kataria, A., & Dutta, S. (2021) · ITM Web of Conferences · doi:10.1051/itmconf/20213701024 · Cited by 6 · cited 1×
“Rajarajeswari et al. [80] revealed that one of the causes of electricity wastage is the failure of householders to turn off electronic devices when not in use.”
BackgroundUser centered gesture development for smart lighting
Park, D., Lee, Y. S., Yun, M. H., Song, S., Rhiu, I., Kwon, S., & An, Y. (2016) · HCI Korea 2016 · doi:10.17210/hcik.2016.01.146 · Cited by 6 · cited 1×
“Park et al. [286] said that hand gesture recognition is vital in smart lighting to get the full functionality of the proposed system.”
BackgroundSultan, K. (2018) · Journal of Communications · doi:10.12720/jcm.13.9.518-523 · Cited by 6
Assessing the perceptibility of smartphone notifications in smart lighting spaces
Komninos, A., Besharat, J., Stefanis, V., Gogoulou, G., & Garofalakis, J. D. (2019) · Journal of Ambient Intelligence and Smart Environments · doi:10.3233/ais-190525 · Cited by 6
Neural network-based LED lighting control with modeling uncertainty and daylight disturbance
Mohagheghi, A., Moallem, M., & Khayatian, A. (2017) · Proceedings of the Annual Conference of the IEEE Industrial Electronics Society · doi:10.1109/iecon.2017.8216615 · Cited by 6
A Study on the Basic Model of Smart Lighting Control System Using User Awareness Technology
Kookmin University, Choi, K., Lee, H., Kookmin University, Kim, Y., & Kookmin University (2014) · Advanced Science and Technology Letters · doi:10.14257/astl.2014.47.13 · Cited by 6 · cited 2×
“Kookmin et al. [296] state that there are two reasons for smart lighting, energy efficiency and comfortable lighting.”
BackgroundSmart lighting system based on Bluetooth
Feng, C., Wang, X., Li, Z., et al. (2021) · Journal of Physics Conference Series · doi:10.1088/1742-6596/1976/1/012028 · Cited by 6 · cited 1×
“[135] PIR LED STC89C52 Minimum System None Mobile Android EA4 Bluetooth”
BackgroundLu, L., Teng, S., Zhang, W., et al. (2019) · IEEE International Conference on Computer Supported Cooperative Work in Design (CSCWD) · doi:10.1109/cscwd.2019.8791854 · Cited by 6 · cited 1×
“While bagging is parallel because it creates many classifiers at the same time, boosting is serial because every weak classifier will be affected by the previous weak classifier [226].”
BackgroundBrown, R., Schwartz, P. O., Nordman, B., et al. (2020) · Lawrence Berkeley National Laboratory · doi:10.2172/1788002 · Cited by 6
Rotating Sensor for Multi-Direction Light Intensity Measurement
Hoang, D. A., Tung, T. T., Nguyen, C. M., & Nguyen, K. P. (2019) · 2019 International Conference on System Science and Engineering (ICSSE) · doi:10.1109/icsse.2019.8823447 · Cited by 6 · cited 1×
“[97] add that the performance of smart lighting control depends on the light sensor.”
BackgroundActivity Recognition for Smart-Lighting Automation at Home
Sigurdson, D., & Stroulia, E. (2018) · International Conference on Information, Intelligence, Systems and Applications · doi:10.1109/iisa.2018.8633667 · Cited by 6
Design of Automatic Intensity Varying Smart Street Lighting System
Gupta, A., & Gupta, S. (2017) · IOP Conference Series: Materials Science and Engineering · doi:10.1088/1757-899x/225/1/012126 · Cited by 6 · cited 1×
“Gupta et al. [66] state that the existing lighting technology does not reflect the progress of other technologies in the world.”
BackgroundEvaluation of Deep Learning Approaches for Intrusion Detection System in MANET
Laqtib, S., Yassini, K. E., & Hasnaoui, M. L. (2020) · Lecture notes in intelligent transportation and infrastructure · doi:10.1007/978-3-030-37629-1_71 · Cited by 6 · cited 1×
“When compared to ANN, the more data there is, the better the performance of DNN, while ANN will reach saturation point faster with less data [234].”
MethodAn Indoor Smart Lamp For Environments Illuminated Day Time
Cihan, A. N., & Gugul, G. N. (2020) · 2020 IEEE East-West Design & Test Symposium (EWDTS) · doi:10.1109/ewdts50664.2020.9224900 · Cited by 5 · cited 1×
“Cihan et al. [73] adds that energy consumption in commercial buildings in the US is up to 25%, and in Turkey, it is up to 9%.”
BackgroundIlluminating energy: Smart lights, householders and intuitive energy data visualization
Martin, R. M. (2020) · Proceedings of the Eleventh ACM International Conference on Future Energy Systems · doi:10.1145/3396851.3402649 · Cited by 5 · cited 1×
“According to Martin et al. [81], in the era of renewable energy, energy consumption strategies at home need to be regulated.”
BackgroundEnergy Efficient Smart Working Environment Using Internet of Things
Vikash, Mishra, L., Chouhan, S. D., & Varma, S. (2019) · IEEE Vehicular Technology Conference · doi:10.1109/vtcspring.2019.8746355 · Cited by 5 · cited 1×
“Vikash et al. [198] compares KNN regression, SVR, and linear regression to predict the set point of smart lighting control.”
BackgroundActivity Based Smart Lighting Control For Energy Efficient Building By Neural Network Model
Hidayat, I., Faridah, F., & Utami, S. S. (2018) · E3S Web of Conferences · doi:10.1051/e3sconf/20184301017 · Cited by 5
Pham, G. N., Nguyen, P. H., & Kwon, K. (2019) · Journal of Multimedia Information System · doi:10.33851/jmis.2019.6.4.329 · Cited by 5 · cited 1×
“Pham et al. [288] also propose hand gesture detection, but it depends on cameras, not wearable sensors.”
BackgroundIoT System for Implementation of Connected Lighting
Haba, C.-G., Breniuc, L., Gălățanu, C. D., et al. (2019) · International Symposium on Advanced Topics in Electrical Engineering · doi:10.1109/atee.2019.8725016 · Cited by 5 · cited 1×
“[141] RGB DALI WF32 WF32 Web Service Laptop Web Wi-Fi, HTTP”
BackgroundEvaluating machine learning algorithms for applications with humans in the loop
Gopalakrishna, A. K., Özçelebi, T., Lukkien, J. J., et al. (2017) · IEEE International Conference on Networking, Sensing and Control (ICNSC) · doi:10.1109/icnsc.2017.8000136 · Cited by 5
Smart Lamp Control Based on User Behavior For Two Lamps Using K-Nearest Neighbour
Nugroho, T., Nasrun, M., & Setianingsih, C. (2019) · International Conference on Advanced Mechatronics, Intelligent Manufacture and Industrial Automation (ICAMIMIA) · doi:10.1109/icamimia47173.2019.9223423 · Cited by 5
Smart LED Driver with Improved Power Quality and High Efficiency for Household Application
Jha, A., & Kumar, M. (2018) · 2018 International Conference on Computing, Power and Communication Technologies (GUCON) · doi:10.1109/gucon.2018.8674943 · Cited by 5 · cited 1×
“Jha et al. [94] said that in LED development, there is a standard, namely EC 61000-3-2 Class C. Meeting these standards involves developing several intelligent solutions.”
BackgroundErwin, M. R. S. (2021) · eProceedings of Engineering · Cited by 5
Towards Contactless, Hand Gestures-Based Control of Devices
Czuszyński, K., & Rumiński, J. (2018) · Proceedings of the Annual Conference of the IEEE Industrial Electronics Society · doi:10.1109/iecon.2018.8591446 · Cited by 5
Irvan, R. R. M., Abdurohman, M., & Putrada, A. G. (2021) · Lecture notes in networks and systems · doi:10.1007/978-981-16-2380-6_41 · Cited by 5 · cited 1×
“In the training process, several metrics need to be considered, namely epoch, learning rate, and momentum [179].”
BackgroundSelf-citationLocation-aware smart lighting system for individual visual comfort in buildings
Kumar, A., Kajale, A., Kar, P., et al. (2017) · IEEE Global Conference on Consumer Electronics (GCCE) · doi:10.1109/gcce.2017.8229490 · Cited by 5 · cited 1×
“Kumar et al. [54] explain that visual comfort can increase by using an Android App.”
BackgroundSmart lighting in dementia care facility
Ly, N. T., Tscharn, R., Preßler, J., Huber, S., Aknine, S., Serna, A., & Hurtienne, J. (2016) · Proceedings of the 2016 ACM International Joint Conference on Pervasive and Ubiquitous Computing: Adjunct · doi:10.1145/2968219.2968526 · Cited by 5 · cited 1×
“With the increasing number of older adults in the world, more technology is needed for elderly care [314].”
BackgroundPamungkas, R. R., Putrada, A. G., & Abdurohman, M. (2019) · Kinetik Game Technology Information System Computer Network Computing Electronics and Control · doi:10.22219/kinetik.v4i4.844 · Cited by 5 · cited 1×
“In addition, the number of neurons in the input layer, the number of hidden layers, and the number of neurons in each hidden layer can also vary to obtain the optimum model [180].”
BackgroundSelf-citationEnergy Usage Prediction for Smart Home with Regression Based Ensemble Model
Hoque, M. S., Jamil, N., Saharudin, S. A., & Amin, N. (2020) · 2020 8th International Conference on Information Technology and Multimedia (ICIMU) · doi:10.1109/icimu49871.2020.9243578 · Cited by 5 · cited 1×
“Hoque et al. [290] uses K-Means clustering to classify the characteristics of energy consumption by smart lighting users.”
BackgroundSmart Home: Automatic Control Of Lighting Through Z- Wave Iot Technology
Krasniqi, Z., & Vershevci, B. (2020) · doi:10.33107/ubt-ic.2020.218 · Cited by 5
Augmented Reality Intelligent Lighting Smart Spaces
Purmaissur, J., Seeam, A. K., Guness, S., & Bellekens, X. (2019) · International Conference on Next Generation Computing Applications (NextComp) · doi:10.1109/nextcomp.2019.8883577 · Cited by 4 · cited 1×
“Another platform is Node-Red, which is an IoT platform based on Node.js. Node-Red has scalability and can be used to connect web services with IoT devices [112].”
BackgroundA Study on the Traffic Light Identification and Guidance System for the Elderly Drivers
Roslan, Z. H., & Cho, M.-G. (2018) · 2018 Tenth International Conference on Ubiquitous and Future Networks (ICUFN) · doi:10.1109/icufn.2018.8436690 · Cited by 4 · cited 1×
“The role of smart lighting is to make life easier for the elderly whose movement is increasingly limited [315].”
BackgroundNeardey, M., Aminudin, E., Chung, L. P., Zin, R. M., Zakaria, R., Che Wahid, C. M. F. H., Hamid, A. R. A., & Noor, Z. Z. N. (2020) · IOP Conference Series: Materials Science and Engineering · doi:10.1088/1757-899x/943/1/012062 · Cited by 4 · cited 1×
“[74] say dimming can provide efficiency up to 40% and increase visual comfort.”
BackgroundApplication of neural networks to lighting systems
Dudzik, M., Dechnik, M., & Furtak, M. (2019) · MATEC Web of Conferences · doi:10.1051/matecconf/201928202069 · Cited by 4
Comparative Analysis of Grid and Tree Topologies in Agriculture WSN with RPL Routing
Pangestu, F. A., Abdurohman, M., & Putrada, A. G. (2021) · Lecture notes in networks and systems · doi:10.1007/978-981-16-2380-6_40 · Cited by 4 · cited 1×
“Topology options in WSN such as grid and tree can optimize WSN network performance [123].”
BackgroundSelf-citationSmart Street Light towards Energy Saving and Neighborhood Security
Xu, Y., Tang, T., Zheng, Y., Yang, K.-Z., & Xiao, Z. (2019) · IEEE Green Energy and Smart Systems Conference (IGESSC) · doi:10.1109/igessc47875.2019.9042391 · Cited by 4
Predicting Annual Equirectangular Panoramic Luminance Maps Using Deep Neural Networks
Liu, Y., Colburn, A., & Inanici, M. N. (2020) · Building Simulation Conference proceedings · doi:10.26868/25222708.2019.210369 · Cited by 4
Seyedolhosseini, A., Masoumi, N., Modarressi, M., & Karimian, N. (2018) · International Symposium on Telecommunications · doi:10.1109/istel.2018.8661023 · Cited by 4
Wireless Sensor and Actuator Network Deployment Optimization for a Lighting Control
Bouzid, S. E., Serrestou, Y., M'BARKI, M. A., et al. (2020) · International Journal of Computer and Communication Engineering · doi:10.17706/ijcce.2020.9.2.64-77 · Cited by 4
Web-based smart LED for saving energy consumption
Maghribi, F. A., Fayyedh, I. A., Hernandi, K. A., Nugraha, R., Estananto, E., & Abdurohman, M. (2021) · Journal of Physics Conference Series · doi:10.1088/1742-6596/1882/1/012135 · Cited by 4 · cited 1×
“Sustainability itself is a target to be gained from a smart city, especially in industry, buildings, and residents [32].”
BackgroundSelf-citationOrchestrating light – Gesture-based control of smart lighting
Juntunen, E., Myöhänen, P., Häikiö, J., et al. (2016) · Lighting Research & Technology · doi:10.1177/1477153516654516 · Cited by 4 · cited 1×
“Juntunen et al. [297] issues lighting controls based on the movement of people in the room captured from Kinect.”
BackgroundPeach Type Classification Using Deep Learning
El-Kahlout, M. I., & Abu-Naser, S. S. (2020) · PhilPapers (PhilPapers Foundation) · Cited by 4
Pratama, S. M. (2018) · Jurnal Pengembangan Teknologi dan Ilmu Komputer · Cited by 3
Enhancing Random Forest Classifier using Genetic Algorithm
Jawaid, S., & Ahad, M. A. (2017) · International Journal of Advanced Research in Computer Science · doi:10.26483/ijarcs.v8i5.3358 · Cited by 3 · cited 1×
“In a random forest, by maintaining a small depth but increasing the number of trees, the random forest can reduce the variance while maintaining the bias [223].”
BackgroundYoon, S. H., Lee, K. S., Sang, J., et al. (2020) · The International Journal of Advanced Culture Technology · doi:10.17703/ijact.2020.8.1.207 · Cited by 3
On Runtime and Classification Performance of the Discretize-Optimize (DISCO) Classification Approach
Garcia, J., & Korhonen, T. (2019) · ACM SIGMETRICS Performance Evaluation Review · doi:10.1145/3308897.3308965 · Cited by 3 · cited 1×
“Tests conducted by Garcia et al. [422] prove that as the number of estimators in the random forest model increases, the runtime also increases exponentially.”
MethodKwon, H.-I., Baek, B.-H., & Jeon, Y.-S. (2021) · Energies · doi:10.3390/en14164868 · Cited by 3 · cited 1×
“Kwon et al. [146] revealed that AI is one of the important elements besides IoT, big data, and cloud technology in the Industry 4.0 emergence.”
BackgroundInfluentialShnayder, D. A., Filimonovа, A. A., & Panda, S. K. (2018) · International Russian Automation Conference (RusAutoCon) · doi:10.1109/rusautocon.2018.8501683 · Cited by 3 · cited 1×
“Intelligent control in the research of Shnayder et al. [279] uses lighting sensors, motion sensors, and traffic intensity sensors to control street lighting.”
BackgroundA Smart Adaptive Lighting System for a Multifunctional Room
Karyono, K., Abdullah, B. M., Cotgrave, A., & Brás, A. (2019) · International Conference on Developments in eSystems Engineering (DeSE) · doi:10.1109/dese.2019.00184 · Cited by 3 · cited 2×
“Apart from ANN, Karyono et al. [36] also mentions other methods to improve control of smart lighting, for example, using reinforcement learning methods to increase knowledge of schedule-based control as well as occupancy-based control.”
BackgroundMethodNeural Network Analysis of PLC Traffic in Smart City Street Lighting Network
Andrysiak, T., & Saganowski, Ł. (2020) · Advances in intelligent systems and computing · doi:10.1007/978-3-030-57805-3_41 · Cited by 3
Realtime Implementation of LIFI based Zone Sensing and Adaptive Lighting System for Automobile
Ajithkumar, M., Arun, P., Surya, et al. (2019) · Cited by 3
Klir, S., Fathia, R., Babilon, S., Benkner, S., & Khanh, T. Q. (2021) · Applied Sciences · doi:10.3390/app11199062 · Cited by 3
A data-driven personalized smart lighting recommender systemPreprint
Zarindast, A., Wood, J., & Sharma, A. (2021) · arXiv (Cornell University) · doi:10.48550/arxiv.2104.02164 · Cited by 3
Diaconu, E. (2021) · The Scientific Bulletin of Electrical Engineering Faculty · doi:10.2478/sbeef-2021-0002 · Cited by 3
An integrated access control and lighting configuration system for smart buildings
Maciel, H. S., Cardoso-Pereira, I., Ramos, H. S., et al. (2017) · Journal of Communications Software and Systems · doi:10.24138/jcomss.v13i2.378 · Cited by 3 · cited 1×
“Maciel et al. [313] implements PCA in Eigenface face recognition as authentication in smart lighting.”
BackgroundLighting Consumption Optimization in a SCADA Model of Office Building Considering User Comfort Level
Khorram, M., Faria, P., & Vale, Z. (2020) · Advances in Intelligent Systems and Computing · doi:10.1007/978-3-030-23946-6_3 · Cited by 3 · cited 1×
“PRR is calculated based on the value of the power to be reduced [350].”
BackgroundEvent-Driven Smart Lighting and Surveillance System: A KSA Perspective
Al-Subaie, S., Jambi, L., Reda, R. A., & Qaisar, S. M. (2018) · 2018 21st Saudi Computer Society National Computer Conference (NCC) · doi:10.1109/ncg.2018.8592993 · Cited by 3 · cited 1×
“The advantage of using computer vision in smart lighting is that advanced control of smart lighting can take advantage of CCTV cameras which are usually already installed in an area [308].”
BackgroundColor Influence and Genetic Algorithm Optimization in Interior Lighting Building
Souffo Tagueu, M., & Ndzana, B. (2019) · American Journal of Electrical Power and Energy Systems · doi:10.11648/j.epes.20190806.14 · Cited by 2 · cited 1×
“Ndzana et al. [305] uses GA to optimize between getting the maximum light intensity with primary colors and getting the maximum savings.”
BackgroundA Data Driven Approach for Smart Lighting
Guo, H., Letourneau, S., & Yang, C. (2014) · Lecture Notes in Computer Science · doi:10.1007/978-3-319-07467-2_33 · Cited by 2 · cited 1×
“In the same year, Guo et al. [23] applies machine learning to smart lighting, namely AdaBoost learning on sensor data for intelligent control.”
Background(2021) · American Scientific Research Journal for Engineering, Technology, and Sciences · Cited by 2
Smart Lighting System for Library Using IoT Technology
Chitra, B., Xin, R. K., & Malathy, B. (2019) · Cited by 2
Increasing Accuracy of Power Consumption Using Artificial Neural Network
Syukur, A. M., Putrada, A. G., & Abdurohman, M. (2019) · doi:10.1109/icoict.2019.8835371 · Cited by 2
Self-citationgesture recognition technology
Meshram, A. P., & Rojatkar, P. D. D. V. (2017) · Journal of Emerging Technologies and Innovative Research · Cited by 2
Adaptive lighting algorithm experiment
Zhang, X., & Zhou, Y. (2017) · IEEE International Conference on Electronic Measurement & Instruments · doi:10.1109/icemi.2017.8265813 · Cited by 2 · cited 1×
“Zhang et al. [143] applies intelligence to study the lighting connection patterns between light sources and work space surfaces.”
Background(2014) · Tampere University of Technology Institutional Repository · Cited by 2
Hao, S., Zhao, N. L., Wu, Y. Z., et al. (2021) · IOP Conference Series Earth and Environmental Science · doi:10.1088/1755-1315/787/1/012085 · Cited by 2
Ahmad, N. S. N., Radzi, N. H. M., Abdullah, M. N., Wagiman, K. R., Salimin, S. B., & Ismail, M. N. (2020) · IEEE Student Conference on Research and Development (SCOReD) · doi:10.1109/scored50371.2020.9250929 · Cited by 2
Andrysiak, T., & Saganowski, Ł. (2019) · Advances in intelligent systems and computing · doi:10.1007/978-3-030-19501-4_2 · Cited by 2
Intelligent lighting system: Energy management technical measure
Lyubov, V. K., Lyubova, O. A., Elukova, J. A., et al. (2020) · IOP Conference Series Earth and Environmental Science · doi:10.1088/1755-1315/408/1/012004 · Cited by 2 · cited 1×
“Lyubov et al. [148] designs intelligent smart lighting that is a part of a smart campus.”
BackgroundImplementation and Analysis of Smart Lamp Using Android Application Based on Internet Of Things
Riyadi, G. A., Munadi, R., & Sussi, S. (2020) · Proceedings of the International Seminar of Science and Applied Technology (ISSAT 2020) · doi:10.2991/aer.k.201221.072 · Cited by 2 · cited 1×
“[139] Light, Ultrasonic Relay ESP32 ThingSpeak Monitoring, Web Service Mobile Android Application REST”
BackgroundMachine Learning, Big Data, And Smart Buildings: A Comprehensive Survey
Qolomany, B., Al-Fuqaha, A., Gupta, A., Benhaddou, D., Alwajidi, S., Qadir, J., & Fong, A. (2019) · arXiv.org · doi:10.48550/arxiv.1904.01460 · Cited by 2
Illumination adaptation with rapid-response color sensors
Zhang, X., Wang, Q., & Boyer, K. L. (2014) · Proceedings of SPIE, the International Society for Optical Engineering/Proceedings of SPIE · doi:10.1117/12.2062105 · Cited by 1
Kolomiets, V. I. (2021) · IOP Conference Series Materials Science and Engineering · doi:10.1088/1757-899x/1047/1/012141 · Cited by 1 · cited 1×
“Based on a statement in a study by Kolomiets et al. [25], the issue of energy efficiency first emerged in the 1970s, when the oil economic crisis began to emerge.”
PARK, J., KIM, K., PARK, J., KWON, B., KIM, C., KIM, J., KIM, J., KIM, J., & JANG, W. (2018) · WIT Transactions on The Built Environment · doi:10.2495/cr180061 · Cited by 1 · cited 1×
“Park et al. [52] also stated that in railway lighting, user comfort is one of the essential aspects besides security, promptness, and convenience.”
BackgroundIoT Enabled Smart Lighting System for Rural Areas
Shashidhar, P. K., Chowdhary, S. V., Bentur, M., et al. (2020) · International Journal of Scientific Research in Computer Science Engineering and Information Technology · doi:10.32628/cseit2063178 · Cited by 1 · cited 1×
“[138] Light, PIR LED NodeMCU ThingSpeak Monitoring, Web Service Laptop Web REST”
BackgroundPOCO – K-Means : Optimasi Penempatan Kontroler pada SDN
Guci, R. J., Putrada, A. G., & Makky, M. A. (2019) · eProceedings of Engineering · Cited by 1
Self-citationMIMO to Enhance the Performance of VLC Systems
Ali, A. T., Younus, S. H., & Özbay, S. (2021) · IOP Conference Series Materials Science and Engineering · doi:10.1088/1757-899x/1152/1/012009 · Cited by 1 · cited 1×
“Ali et al. [167] offers the concept of multi-input multi-output (MIMO) in VLC. MIMO is a technology for radio technology such as Wi-Fi, WiMAX, and LTE.”
Background
Research works printed but not linked: 23
- 2022, Gartner Says Smart Lighting has the Potential to Reduce Energy Costs by 90 Percent
- Shaulova, 2022, Smart Home Report 2021—Comfort and Lighting
- 10.3390/su13116198 · DOI · Paper page
- Smys, 2020, Artificial neural network based power management for smart street lighting systems, J. Artif. Intell., 2, 42
- Braw, 2014, Illuminating cities with sustainable smart lighting systems, Guardian, 12, 1
- Lakade, 2019, Intelligent lighting system for classrooms and mall using iot, Int. Res. J. Eng. Technol., 6, 3223
- Mahandran, 2021, IoT based smart lighting system in an auditorium, Prog. Eng. Appl. Technol., 2, 8
- Fanoon, 2030, Smart lighting system for efficient street lighting, J. Technol. Value Addition, 1, 36
- Kim, 2019, Design of path prediction smart street lighting system on the Internet of Things, J. Chosun Natural Sci., 12, 14
- Khachane, 2018, Intelligent street lighting system, Int. J. Eng. Res. Comput. Sci. Eng, 5, 587
- 10.1051/itmconf/20213701024 · DOI · Paper page
- Saepurohman, 2019, Analisis principal component analysis (PCA) untuk mereduksi faktor-faktor Yang mempengaruhi kualitas kulit kikil sapi, Prosiding Seminar Konferensi Nasional IDEC, 6, C01
- Dharma, 2015, Implementasi principal component analysis pada sistem rekomendasi film dengan pendekatan user based collaborative filtering skripsi, 2, 3464
- Manju, 2011, An analysis of q-learning algorithms with strategies of reward function, Int. J. Comput. Sci. Eng., 3, 814
- 10.1109/SGCF.2018.8408951 · DOI · Paper page
- Divya, 2016, Survey on outlier detection techniques using categorical data, Int. Res. J. Eng. Technol., 3, 899
- Gao, 2020, Human action classification using adaptive boosting algorithm, Int. J. Elect., Electron., Comput. Eng. Technol., 1, 6
- Almeida, 2015, Computer vision based adaptive lighting solutions for smart and efficient system, J. Impact Factor, 6, 1
- Edition, 2010, Energy standard for buildings except low-rise residential buildings
- 10.1109/ACCESS.2019.2932055 · DOI
- Abdullayev, Mimo ann to daylight harvested hybrid lighting control for an office building, 169
- 10.1109/ACCESS.2020.2995461 · DOI · Paper page
- Daely, Implementation and analysis of real time scheduling for IoT: A case study of smart led street light, 622
Cited by
Human Activity Recognition via Wi-Fi and Inertial Sensors With Machine Learning
Guo, W., Yamagishi, S., & Jing, L. (2024) · IEEE Access · doi:10.1109/access.2024.3360490 · Cited by 66
“To tackle these issues, studies introduce HAR systems based on acoustic signals [18], Millimeter Wave (mmWave) [19], Ultra-Wideband (UWB) [20] and Wi-Fi devices [21].”
BackgroundScandurra, G., Arena, A., & Ciofi, C. (2023) · Sensors · doi:10.3390/s23115264 · Cited by 51
Smart Street Light Control: A Review on Methods, Innovations, and Extended Applications
Agramelal, F., Sadik, M., Moubarak, Y., & Abouzahir, S. (2023) · Energies · doi:10.3390/en16217415 · Cited by 66
Ramadhan, N. G., Adiwijaya, A., Maharani, W., & Gozali, A. A. (2024) · IEEE Access · doi:10.1109/access.2024.3406748 · Cited by 54
“Extraction data has two stages, namely: (i) collecting paper information based on extraction form (Table 3), and (ii) find more in-depth information on quality assessments (QA) (Table 3) [30].”
BackgroundSystematic Review of Extended Reality for Smart Built Environments Lighting Design Simulations
Mohammadrezaei, E., Ghasemi, S., Dongre, P., Gračanin, D., & Zhang, H. (2024) · IEEE Access · doi:10.1109/access.2024.3359167 · Cited by 37
“…human-centric lighting, gesture and voice control, energy management, occupancy sensing, personalized lighting profiles, data analytics, predictive design, security and safety integration, sustainability efforts, IoT integration [296], user feedback analysis, and creative lighting displays.”
Background
Metadata
- Authors
- Putrada, A. G., Abdurohman, M., Perdana, D., & Nuha, H. H.
- Affiliations
- Telkom University (ID)
- Venue
- IEEE Access
- Published
- 2022
- Volume
- 10
- Pages
- 45137-45178
- ISSN
- 2169-3536 (ISSN-L)
- OpenAlex
- W4226062023
- Cited by
- 101
- References
- 431
- Citations by year
- 2026: 15 · 2025: 31 · 2024: 22 · 2023: 24 · 2022: 9
- FWCI
- 9.40
- Type
- journal article
- Language
- en
- Open access
- gold
- doi.org
- Locations
- IEEE Access (publishedVersion, cc-by)
- DOAJ (DOAJ: Directory of Open Access Journals) (submittedVersion)
- Funders
- Telkom University through the Doctoral Dissertation Research Scheme and the Doctoral Study Program
- Biofarma Corporation
- Industri Telekomunikasi Indonesia (INTI) Corporation
- Lembaga Pengelola Dana Pendidikan (LPDP) of Ministry of Finance of Republic Indonesia through Riset Inovatif Produktif (Rispro) Scheme
- Topics
- Physical Sciences › Engineering › Building and Construction › Building Energy and Comfort Optimization
- Physical Sciences › Computer Science › Computer Vision and Pattern Recognition › Context-Aware Activity Recognition Systems
- Physical Sciences › Engineering › Electrical and Electronic Engineering › IoT-based Smart Home Systems
- Keywords
- smart lighting, user comfort, machine learning, activity recognition, Internet of Things, LED lighting, light-emitting diodes, correlated color temperature, flicker perception, energy efficiency, lighting control
About these checks
Registry, retraction, Cites and statistics results are computed, not judged, with one exception: a printed reference that no index lists is read once by a model before it counts as a citation error. Claims are extracted by a model and kept only when their quote appears verbatim in the text; each cited source is then checked, with a model’s help, for whether it says what the claim relies on. Those verdicts can be wrong — read the claim’s quote and the cited source before relying on one.
The claim verdicts this report counts are experimental: their accuracy is not yet measured.
A language model drew the claims from the paper on 2026-10-10, under version 3 of the claim definition (model deepseek-v4.1-flash, prompt extract-v3).
A second model labelled each claim on 2026-10-10 (model jev-1.13-20260917, definition revision gold-guideline-v0.2).
Cited sources are checked with a language model’s help (gpt-6-sol).
Statistics and arithmetic are recomputed, not judged.
Confidence bands are shown only for fields calibrated on our annotated test set. None is calibrated yet, so no band is shown.
What counts as a claim ›How we measure confidence ›How we check this ›
Are you an author, or do you see a problem with this page? Request a review
Data sources
Bibliographic data: Semantic Scholar, OpenAlex, Crossref.
Contains information from the Semantic Scholar Academic Graph Datasets, made available under the ODC Attribution License (ODC-BY 1.0).
Semantic Scholar’s data is described in: Kinney, R., et al. (2023). The Semantic Scholar Open Data Platform. arXiv:2301.10140.
