Cited by 33

The DOI matches its Crossref record; 1 of the 1 references it cites were found in a registry or an index.

IgE antibodies increase honeybee venom responsiveness and detoxification efficiency of mast cells

Starkl, Philipp, Gaudenzio, Nicolas, Marichal, Thomas, Reber, Laurent L., Sibilano, Riccardo, Watzenboeck, Martin L., Fontaine, Frédéric, Mueller, André C., Tsai, Mindy, Knapp, Sylvia, Galli, Stephen J.·2022·Allergy

Abstract

Background: In contrast to their clearly defined roles in allergic diseases, the physiologic functions of Immunoglobulin E antibodies (IgEs) and mast cells (MCs) remain enigmatic. Recent research supports the toxin hypothesis, showing that MCs and IgE‐related type 2 immune responses can enhance host defense against certain noxious substances, including honeybee venom (BV). However, the mechanisms by which MCs can interfere with BV toxicity are unknown. In this study, we assessed the role of IgE and certain MC products in MC‐mediated BV detoxification. Methods: We applied in vitro and in vivo fluorescence microscopyimaging, and flow cytometry, fibroblast‐based toxicity assays and mass spectrometry to investigate IgE‐mediated detoxification of BV cytotoxicity by mouse and human MCs in vitro. Pharmacologic strategies to interfere with MC‐derived heparin and proteases helped to define the importance of specific detoxification mechanisms. Results: Venom‐specific IgE increased the degranulation and cytokine responses of MCs to BV in vitro. Passive serum sensitization enhanced MC degranulation in vivo. IgE‐activated mouse or human MCs exhibited enhanced potential for detoxifying BV by both proteolytic degradation and heparin‐related interference with toxicity. Mediators released by IgE‐activated human MCs efficiently degraded multiple BV toxins. Conclusions: Our results both reveal that IgE sensitization enhances the MC's ability to detoxify BV and also assign efficient toxin‐neutralizing activity to MC‐derived heparin and proteases. Our study thus highlights the potential importance of IgE, MCs, and particular MC products in defense against BV.

Overview

The claims and statistics of this paper haven’t been checked yet.

Run the check — free, no account needed. It reads the open-access text and checks the sources it cites.

A few free checks a day · papers already verified open instantly · results are public

Integrity signals

Registry

Crossref · 10.1111/all.14852

Cites

1 of 1 references verified0 citation errors · 0 not checkable

Statistics

Figures

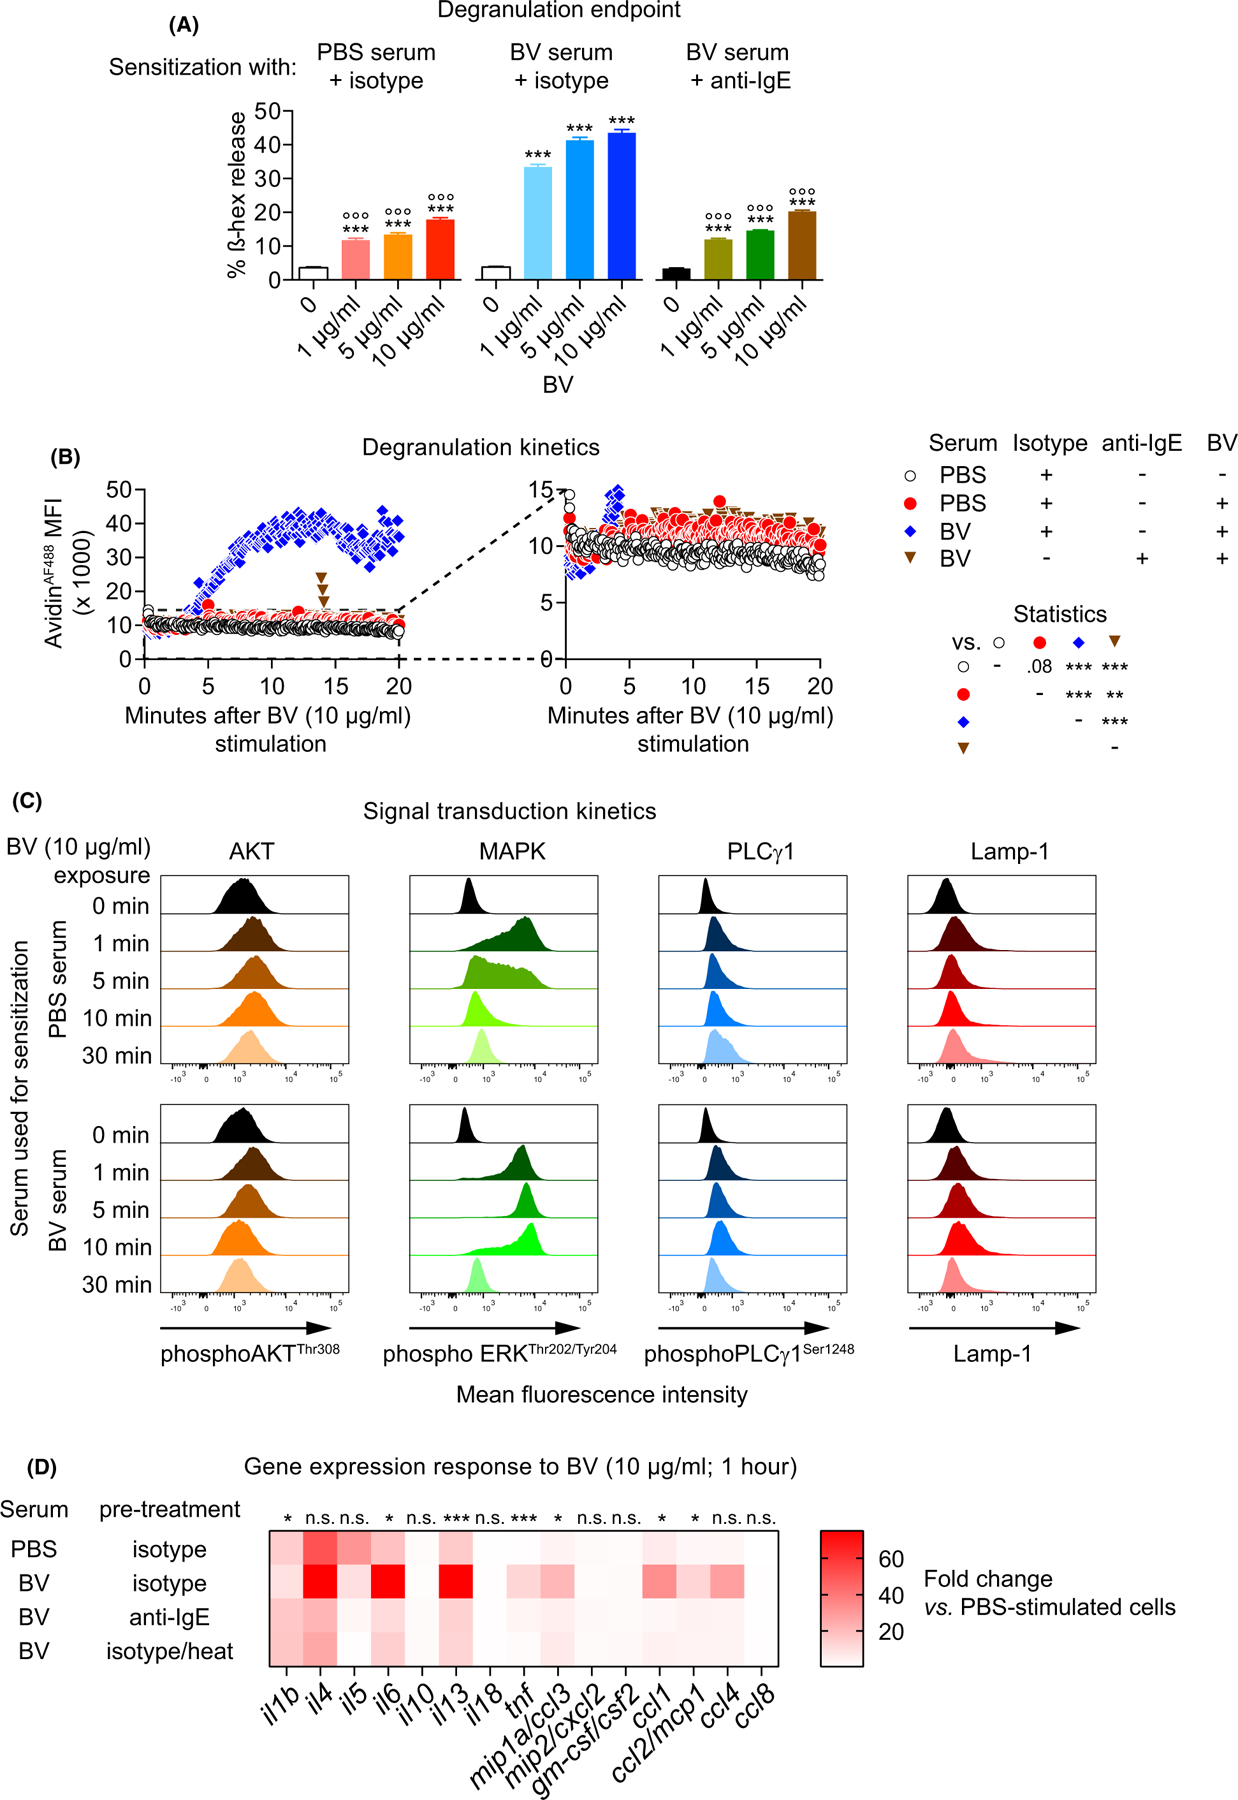
FIGURE 1 Immunoglobulin E sensitization modulates FSCMC degranulation, signaling, and gene expression responses to honeybee venom. FSCMCs were sensitized overnight with serum derived either from mock (PBS)-immunized or BV-immunized mice (PBS serum or BV serum, respectively) that was either untreated or pre-treated (before cell incubation) with (A, B, D) an anti-IgE (or isotype control) antibody or (D) by heating as indicated. (A) FSCMCs were unstimulated or exposed to BV at 1, 5, or 10 µg/ml for 1 h and analyzed for ß hexosaminidase (ß-hex) release (data are from one of three independent experiments, each of which gave similar results). (B) FSCMCs were stimulated with 10 µg/ml BV and fluorescent signal in live cells due to heparin/avidinAF488 interaction was recorded over 20 min by flow cytometry. The avidinAF488 mean fluorescence intensity (MFI) kinetics are shown. The right panel represents a y-axis magnification of the data as indicated by the dashed lines in the left graph in order to allow identification of minor fluorescence differences (data are from one of three independent experiments, each of which gave similar results). (C) Phosphorylation of AKT, MAPK/ERK and PLCγ1 and membrane-localized Lamp-1 was analyzed in FSCMCs without stimulation (0 min) and after exposure to 10 µg BV for 1, 5, 10, or 30 min by (phospho-) flow cytometry (representative of three independent experiments). (D) Heatmap representing gene expression data (mean of triplicates) from realtime PCR analysis of cytokines and chemokines in FSCMCs after 1 h exposure to 10 µg/ml BV (fold change compared to non-stimulated cells; data are from one of two independent experiments, each of which gave similar results).(A and B) Two-way ANOVA with Tukey’s test for multiple comparisons; (A) * indicates comparisons to the respective unstimulated ctrl in the group; ° indicates comparisons with the same concentration of the BV serum group; p values are adjusted for multiple testing; graphs represent mean +SD; (D) * (or n.s.—not significant) indicates comparisons of the fold changes of PBS serum/isotype-treated vs. BV serum/isotype-treated groups by t test (neither BV serum/anti-IgE-treated nor BV serum/heat-treated groups were significantly different compared to the PBS serum/isotype-treated samples for any of the investigated genes); ns: not significant;*/°p ≤ .05; **/°°p ≤ .01; ***/°°°p ≤ .001; numbers in (A) show the actual p value
FIGURE 1 Immunoglobulin E sensitization modulates FSCMC degranulation, signaling, and gene expression responses to honeybee venom. FSCMCs were sensitized overnight with serum derived either from mock (PBS)-immunized or BV-immunized mice (PBS serum or BV serum, respectively) that was either untreated or pre-treated (before cell incubation) with (A, B, D) an anti-IgE (or isotype control) antibody or (D) by heating as indicated. (A) FSCMCs were unstimulated or exposed to BV at 1, 5, or 10 µg/ml for 1 h and analyzed for ß hexosaminidase (ß-hex) release (data are from one of three independent experiments, each of which gave similar results). (B) FSCMCs were stimulated with 10 µg/ml BV and fluorescent signal in live cells due to heparin/avidinAF488 interaction was recorded over 20 min by flow cytometry. The avidinAF488 mean fluorescence intensity (MFI) kinetics are shown. The right panel represents a y-axis magnification of the data as indicated by the dashed lines in the left graph in order to allow identification of minor fluorescence differences (data are from one of three independent experiments, each of which gave similar results). (C) Phosphorylation of AKT, MAPK/ERK and PLCγ1 and membrane-localized Lamp-1 was analyzed in FSCMCs without stimulation (0 min) and after exposure to 10 µg BV for 1, 5, 10, or 30 min by (phospho-) flow cytometry (representative of three independent experiments). (D) Heatmap representing gene expression data (mean of triplicates) from realtime PCR analysis of cytokines and chemokines in FSCMCs after 1 h exposure to 10 µg/ml BV (fold change compared to non-stimulated cells; data are from one of two independent experiments, each of which gave similar results).(A and B) Two-way ANOVA with Tukey’s test for multiple comparisons; (A) * indicates comparisons to the respective unstimulated ctrl in the group; ° indicates comparisons with the same concentration of the BV serum group; p values are adjusted for multiple testing; graphs represent mean +SD; (D) * (or n.s.—not significant) indicates comparisons of the fold changes of PBS serum/isotype-treated vs. BV serum/isotype-treated groups by t test (neither BV serum/anti-IgE-treated nor BV serum/heat-treated groups were significantly different compared to the PBS serum/isotype-treated samples for any of the investigated genes); ns: not significant;*/°p ≤ .05; **/°°p ≤ .01; ***/°°°p ≤ .001; numbers in (A) show the actual p valueCC BY · PubMed Central
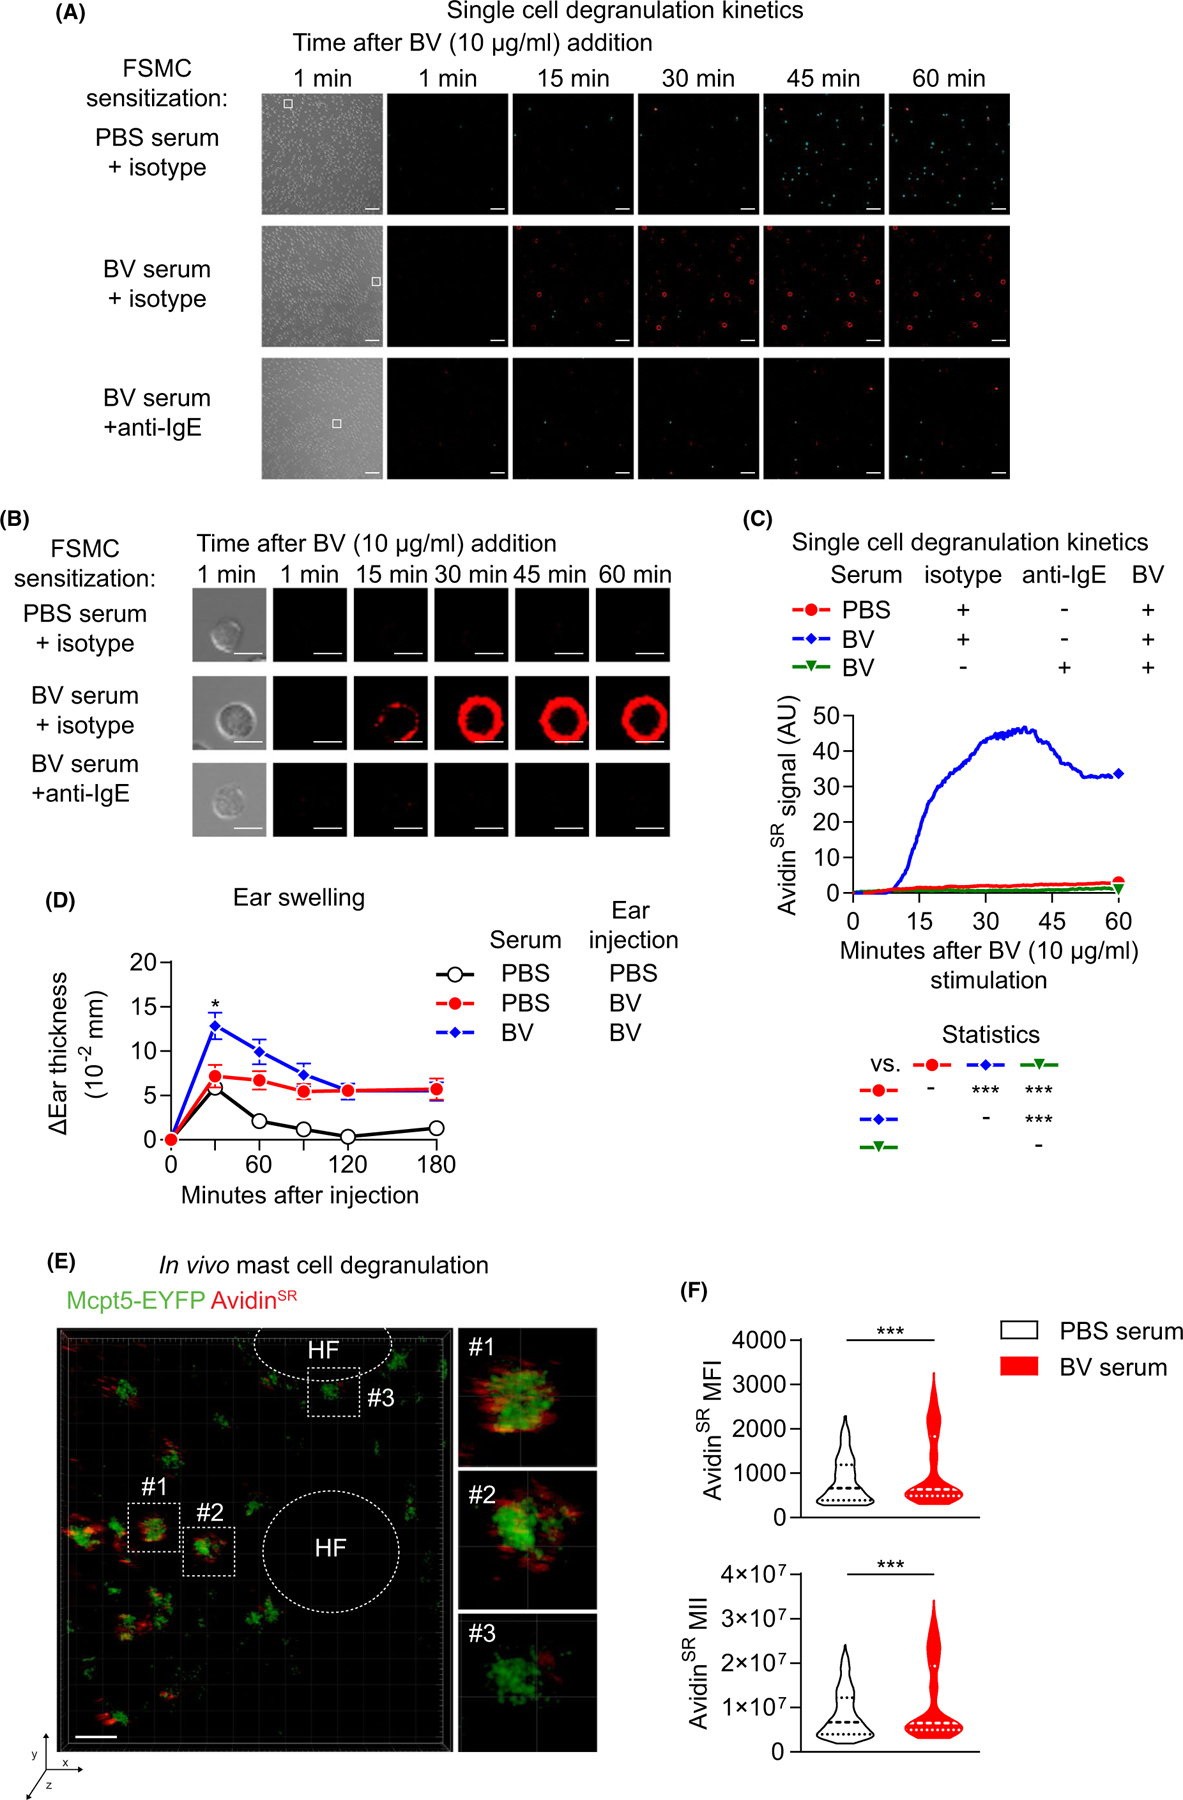
FIGURE 2 Serum sensitization increases FSCMC activation at the single-cell level. (A–C) FSCMCs were incubated overnight with isotype control-pre-treated PBS serumor isotype control- or anti-IgE-pre-treated BV serum. Next day, cells were seeded in chamber slides and exposed to 10 µg/ml BV. The avidinSR-mediated signal of degranulating MCs was recorded over 60 min by realtime confocal fluorescence microscopy. (A) Snap shots of brightfield (outermost left) 1 min and fluorescence signals (merge of To-Pro-3 [viability, in turquoise] and avidinSR [in red]) at the indicated time points after BV addition are shown. The white squares in the 1 min brightfield picture indicate the individual cells presented in (B).(B) Brightfield and immunofluorescence pictures of individual representative cells from (A) (as indicated by the white squares) at 1, 15,30, 45, and 60 min after BV exposure are shown. The scale bars in (A) and (B) represent 10 µm. (C) quantification of the mean avidinSR signal kinetics of cells in field of views shown in (A). (D–F) C57BL/6 mice were intradermally injected with either PBS serum or BV serum into both ears. Next day, one ear of each mouse was injected with either 200 ng BV or PBS. (D) Ear thickness measured directly before and at indicated timepoints after injection. (E and F) Mcpt5-Cre; R26YEYFP mice were pre-treated with immune sera as described for (D). The next day, the serum-treated ear of each mouse was intradermally injected with 200 ng BV containing 8 µg avidinSR. Thirty minutes after injection, the fluorescent avidinSRsignal within a circular area of 60 µm surrounding single EYFP+ cells wasdetermined by intravital 2-photon microscopy. (E) The large picture shows a representative intradermal area of the ear, with EYFP (green, dermal MCs) and avidinSR signal (red, exteriorized MC cytoplasmic granules) indicated (scale barsrepresent30 µm). The smaller pictures on the right represent magnifications of individual MCs as indicated in the large picture by squares with dashed lines. HF indicates hair follicles in the elliptic areas with dashed lines. (F) AvidinSRfluorescent signal from EYFP+MCs in PBS- or BV-serum sensitized ears 30 min after BV injection shown as mean fluorescence intensity (MFI, upper panel) and mean integrated intensity (MII, lower panel). (A-C, E and F) data are from one of two independent experiments, each of which gave similar results). (D) results are pooled from two independent experiments with 9–20 mice per group; symbols represent mean +/− SEM(C and D) Two-way ANOVA with Tukey’s test for multiple comparisons; p values are adjusted for multiple testing; *p ≤ .05; **p ≤ .01; ***p ≤ .001
FIGURE 2 Serum sensitization increases FSCMC activation at the single-cell level. (A–C) FSCMCs were incubated overnight with isotype control-pre-treated PBS serumor isotype control- or anti-IgE-pre-treated BV serum. Next day, cells were seeded in chamber slides and exposed to 10 µg/ml BV. The avidinSR-mediated signal of degranulating MCs was recorded over 60 min by realtime confocal fluorescence microscopy. (A) Snap shots of brightfield (outermost left) 1 min and fluorescence signals (merge of To-Pro-3 [viability, in turquoise] and avidinSR [in red]) at the indicated time points after BV addition are shown. The white squares in the 1 min brightfield picture indicate the individual cells presented in (B).(B) Brightfield and immunofluorescence pictures of individual representative cells from (A) (as indicated by the white squares) at 1, 15,30, 45, and 60 min after BV exposure are shown. The scale bars in (A) and (B) represent 10 µm. (C) quantification of the mean avidinSR signal kinetics of cells in field of views shown in (A). (D–F) C57BL/6 mice were intradermally injected with either PBS serum or BV serum into both ears. Next day, one ear of each mouse was injected with either 200 ng BV or PBS. (D) Ear thickness measured directly before and at indicated timepoints after injection. (E and F) Mcpt5-Cre; R26YEYFP mice were pre-treated with immune sera as described for (D). The next day, the serum-treated ear of each mouse was intradermally injected with 200 ng BV containing 8 µg avidinSR. Thirty minutes after injection, the fluorescent avidinSRsignal within a circular area of 60 µm surrounding single EYFP+ cells wasdetermined by intravital 2-photon microscopy. (E) The large picture shows a representative intradermal area of the ear, with EYFP (green, dermal MCs) and avidinSR signal (red, exteriorized MC cytoplasmic granules) indicated (scale barsrepresent30 µm). The smaller pictures on the right represent magnifications of individual MCs as indicated in the large picture by squares with dashed lines. HF indicates hair follicles in the elliptic areas with dashed lines. (F) AvidinSRfluorescent signal from EYFP+MCs in PBS- or BV-serum sensitized ears 30 min after BV injection shown as mean fluorescence intensity (MFI, upper panel) and mean integrated intensity (MII, lower panel). (A-C, E and F) data are from one of two independent experiments, each of which gave similar results). (D) results are pooled from two independent experiments with 9–20 mice per group; symbols represent mean +/− SEM(C and D) Two-way ANOVA with Tukey’s test for multiple comparisons; p values are adjusted for multiple testing; *p ≤ .05; **p ≤ .01; ***p ≤ .001CC BY · PubMed Central
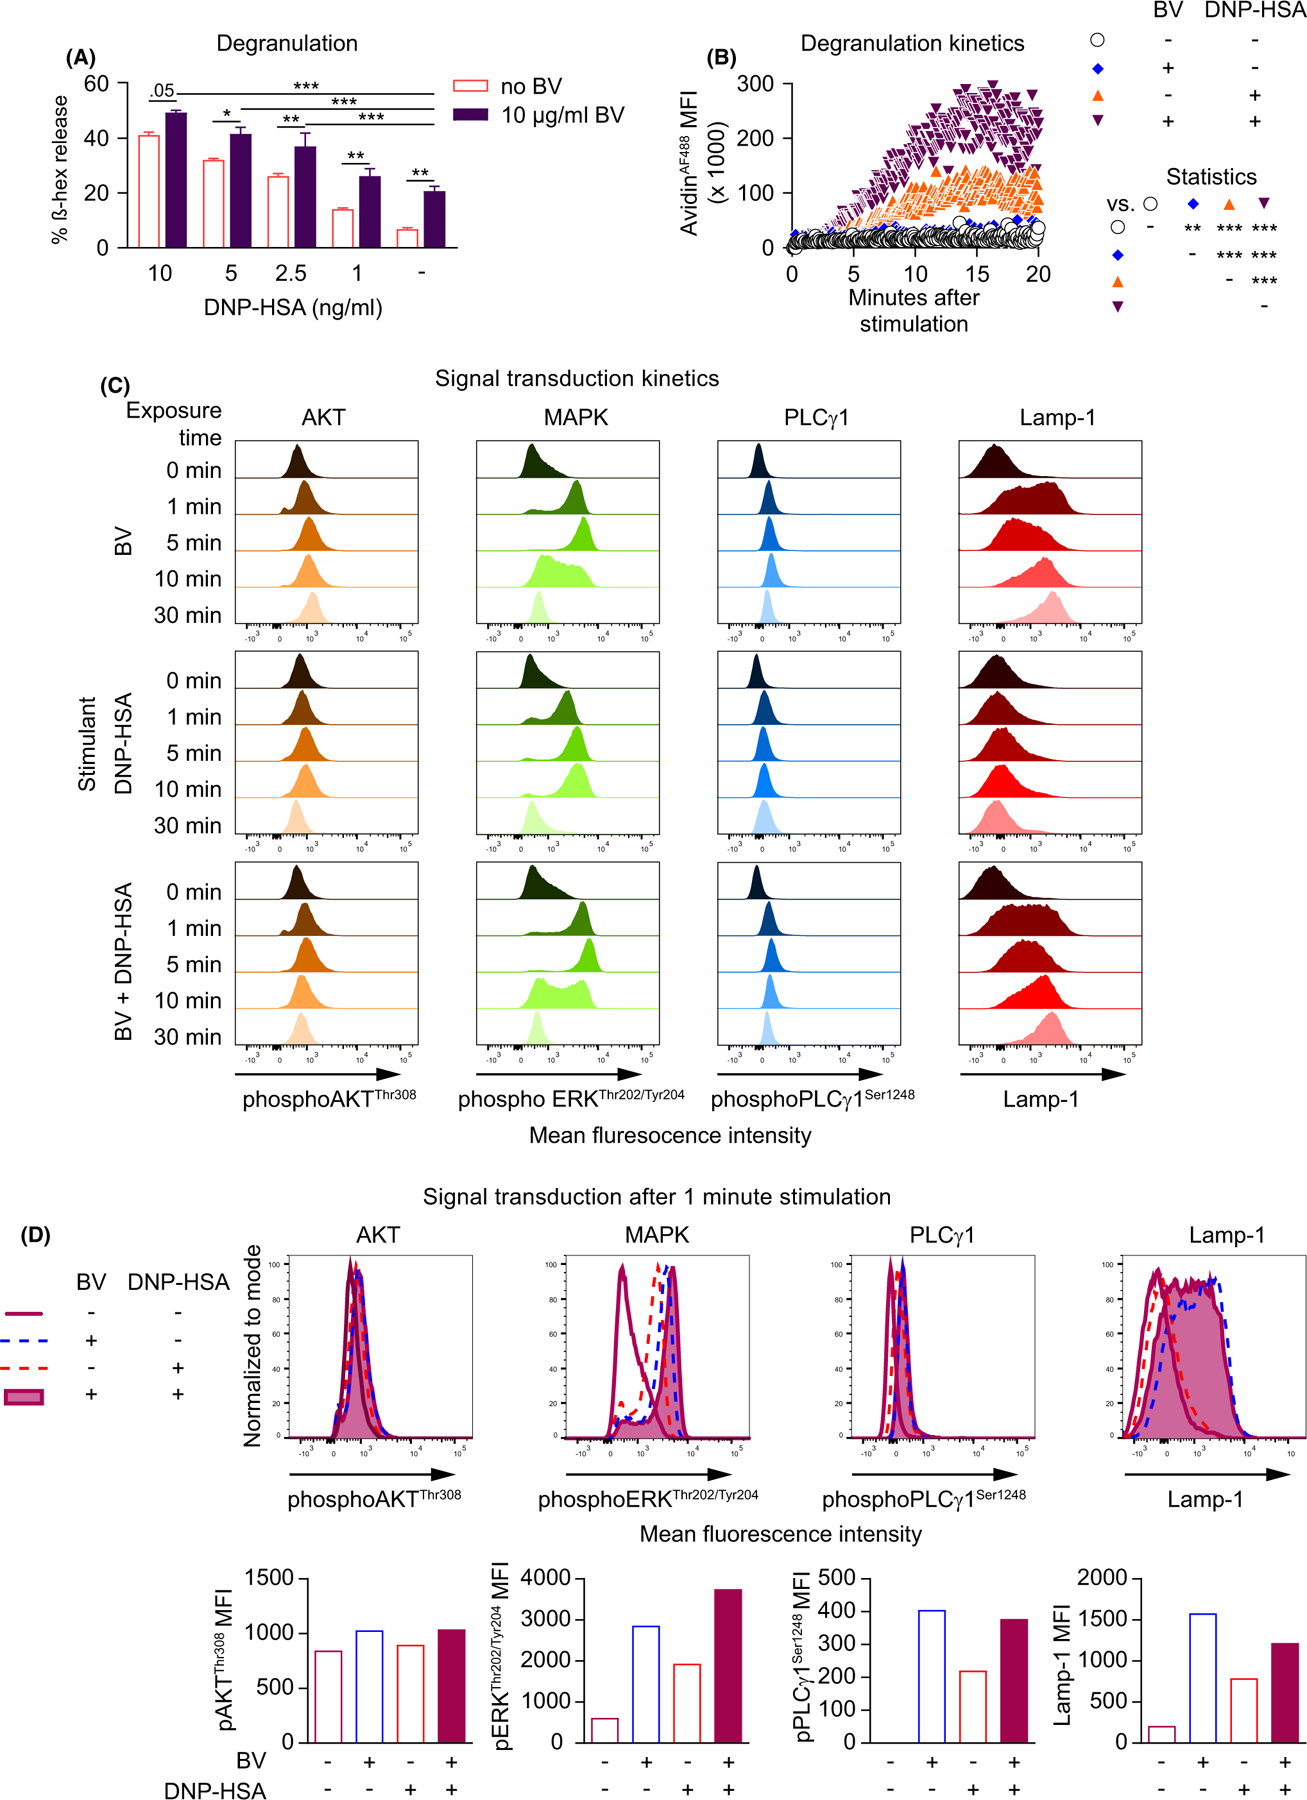
FIGURE 3 Immunoglobulin E-dependent and BV-mediated signals together increase FSCMC activation. (A–D) FSCMCs were sensitized overnight with anti-DNP IgE. (A) FSCMCs were unstimulated or stimulated with different doses of antigen (DNP-HSA) in the absence or presence of 10 µg/ml BV. Released ß hexosaminidase (ß-hex; % of total) was determined 1 h after stimulation. (B and C) FSCMCs were either not stimulated or treated with either 10 µg/ml BV or 5 ng/ml DNP-HSA or both simultaneously. (B) Realtime fluorescent signal due to binding of avidinAF488of live cells over 20 min recorded by flow cytometry. The avidinAF488 mean fluorescence intensity (MFI) kinetics are shown. (C) Phosphorylation of AKT, MAPK/ERK, and PLCγ1 and membrane-localized Lamp-1 before (0 min) and after stimulation for 1, 5, 10, or 30 min using (phosphor-) flow cytometry. (D) Selected histogram overlays (upper panels) and respective mean fluorescence intensities (MFIs; lower panels) of phosphorylation data 1 min after stimulation as shown in (C). (A–D) data are from one of at least two independent experiments, each of which gave similar results. (A) graphs represent mean +SD;(A and B) Two-way ANOVA with Tukey’s test for multiple comparisons; p values are adjusted for multiple testing;*p ≤ .05; ** p ≤ .01; ***p ≤ .001; numbers in (A) show the actual p value
FIGURE 3 Immunoglobulin E-dependent and BV-mediated signals together increase FSCMC activation. (A–D) FSCMCs were sensitized overnight with anti-DNP IgE. (A) FSCMCs were unstimulated or stimulated with different doses of antigen (DNP-HSA) in the absence or presence of 10 µg/ml BV. Released ß hexosaminidase (ß-hex; % of total) was determined 1 h after stimulation. (B and C) FSCMCs were either not stimulated or treated with either 10 µg/ml BV or 5 ng/ml DNP-HSA or both simultaneously. (B) Realtime fluorescent signal due to binding of avidinAF488of live cells over 20 min recorded by flow cytometry. The avidinAF488 mean fluorescence intensity (MFI) kinetics are shown. (C) Phosphorylation of AKT, MAPK/ERK, and PLCγ1 and membrane-localized Lamp-1 before (0 min) and after stimulation for 1, 5, 10, or 30 min using (phosphor-) flow cytometry. (D) Selected histogram overlays (upper panels) and respective mean fluorescence intensities (MFIs; lower panels) of phosphorylation data 1 min after stimulation as shown in (C). (A–D) data are from one of at least two independent experiments, each of which gave similar results. (A) graphs represent mean +SD;(A and B) Two-way ANOVA with Tukey’s test for multiple comparisons; p values are adjusted for multiple testing;*p ≤ .05; ** p ≤ .01; ***p ≤ .001; numbers in (A) show the actual p valueCC BY · PubMed Central
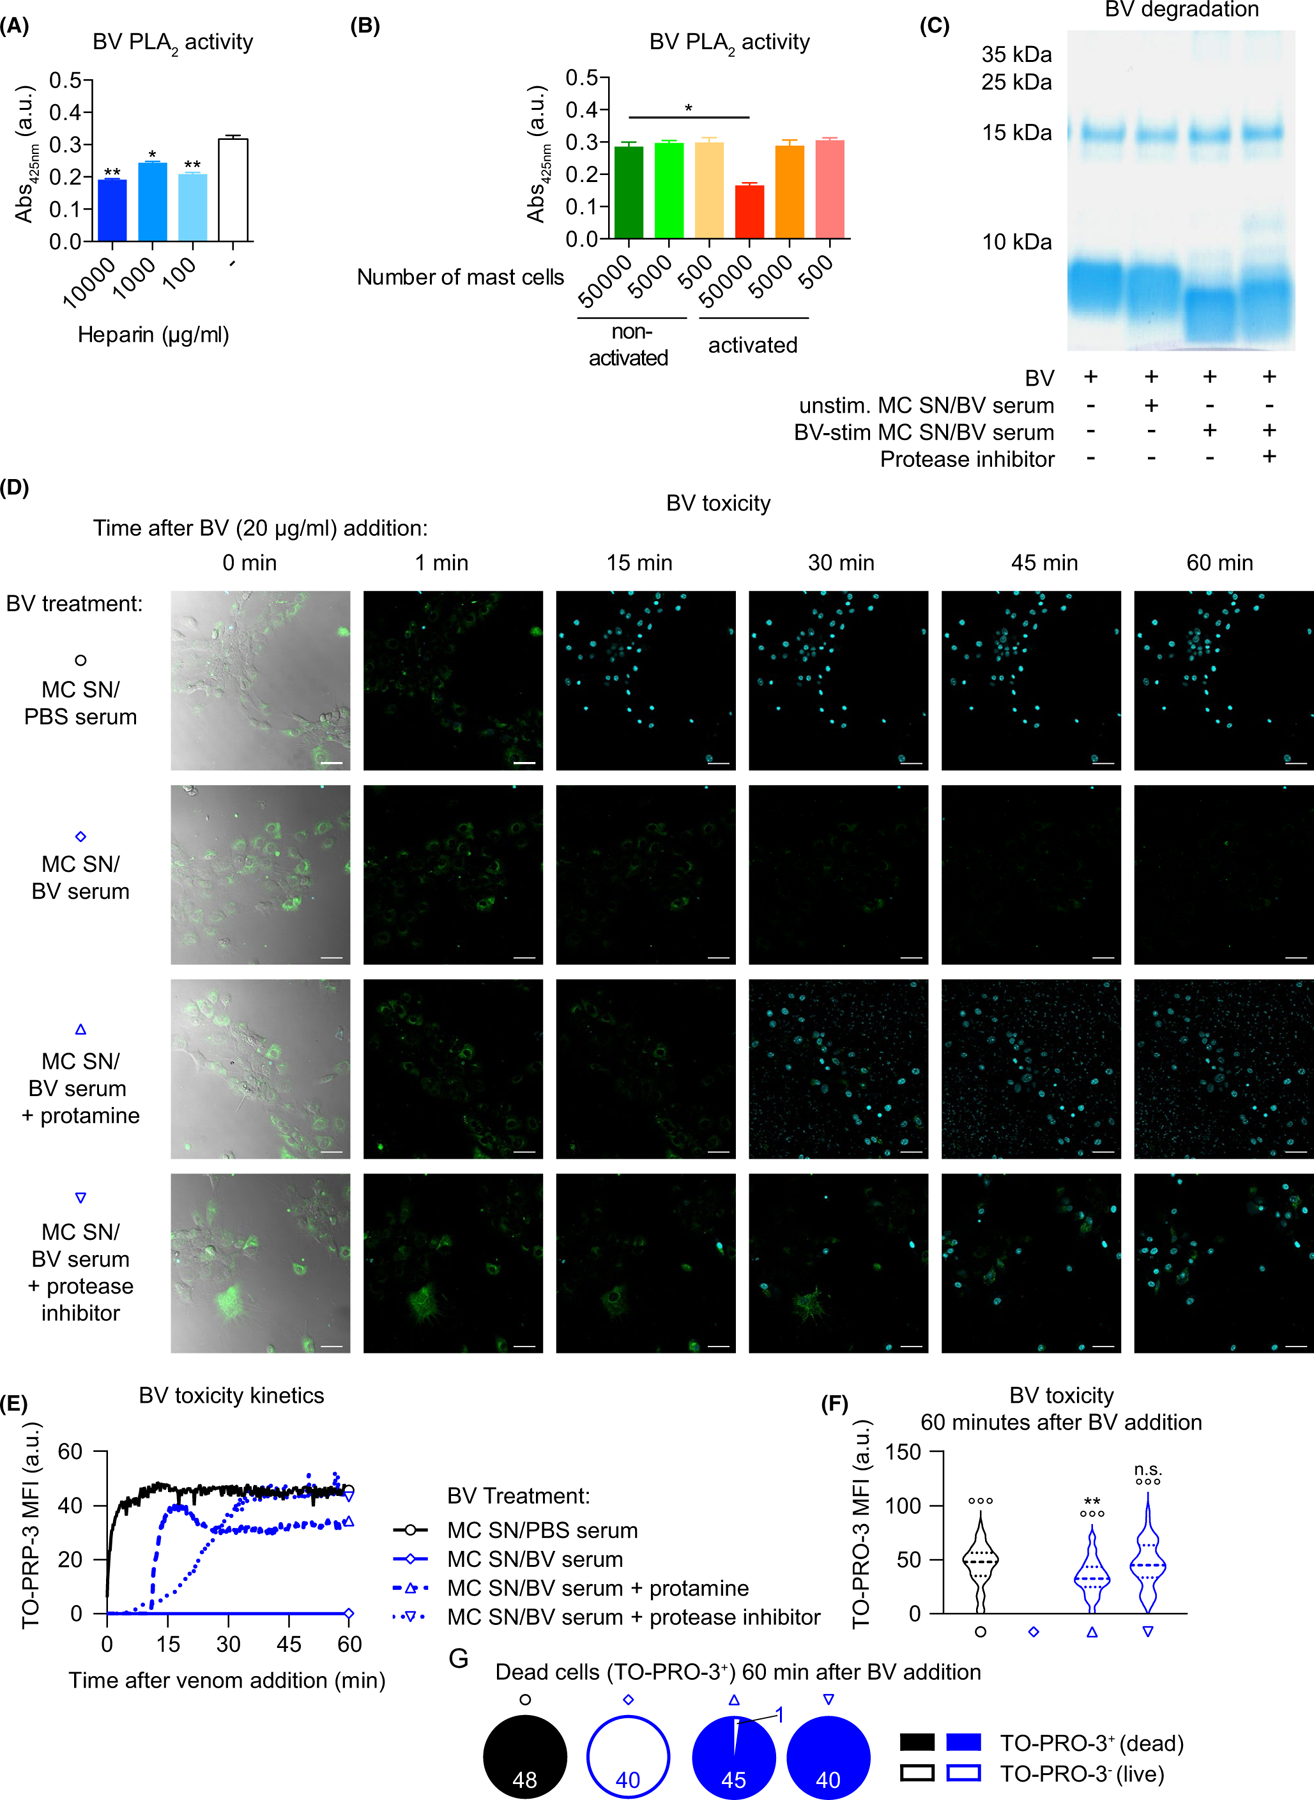
FIGURE 4 Immunoglobulin E-mediated activation increases the detoxification potential of mouse FSCMCs. (A and B) BV (12.5 µg at 500 µg/ml final concentration, resulting in a PLA2 concentration of approximately 60 µg/ml) was either mixed with (A) indicated amounts of heparin or buffer or (B) supernatant of DNP-HSA-exposed non-sensitized or anti-DNP IgE-sensitized MCs for 10 min. After mixing with PLA2 substrate and incubation, substrate cleavage (as indicator of PLA2 activity) was measured. (C) BV (10 µg) was incubated (or not) with supernatant (MC SN) of unstimulated (unstim.) or BV-exposed (10 µg/ml; for 1 h) BV serum-sensitized FSCMCs for 1 h. In some cases, supernatant of activated FSCMCs was pre-incubated with protease inhibitor. After incubation of BV and supernatants, the mixtures were separated by PAGE, followed by Coomassie blue stain. (D–G) 3 T3 fibroblasts were seeded in chamber slides and stained with Fluo-4 (green). BV was pre-treated (or not) with protamine (100 µg)- or protease inhibitor (1x final concentration)-treatedMC SN of PBS serum or BV serum-sensitized FSMCs that were exposed to 10 µg/ml BV for 1 h. The pre-treated BV was then transferred onto the fibroblasts and monitoring of cell death, by confocal fluorescence microscopy imaging of TO-PRO-3 (turquoise)-positive nuclei over 60 min, was started immediately. (D) Representative pictures (outermost left: merge of brightfield, Fluo-4 and TO-PRO-3 fluorescence; remaining pictures show merges of Fluo-4 and TO-PRO-3 channels) of the field of views at indicated timepoints after addition of MC SN-treated BV are shown. Turquoise stains are nuclei of dead cells. The scale bars represent 10 µm. (E–G) Quantification of toxicity (measured as TO-PRO 3 signal) kinetics from time lapse microscopy data shown in (D). (E) shows the development of TO-PRO 3 mean fluorescence intensity (MFI) over time. (F) Depicts the TO-PRO-3 MFI 60 min after BV addition in all cells in the field of view. (G)Illustrates the proportions of dead (with MFI ≥1) and live (with MFI <1) cells (numbers indicate the respective identified and quantified nuclei) in the field of view. (A–G) data are from one of at least two independent experiments, each of which gave similar results. (A and B) T test for pairwise comparisons in (A) to the control group (no heparin) or (B) as indicated; graphs represent mean +SD; (F) one-way ANOVA with Tukey’s test for multiple comparisons (p values are adjusted for multiple testing); * (or n.s.—not significant) indicates comparisons to the respective untreated (or PBS serum) group (or as indicated); ° indicates comparisons with the BV serum group; p values are adjusted for multiple testing; */°p ≤ .05; **/°°p ≤ .01; ***/°°°p ≤ .001
FIGURE 4 Immunoglobulin E-mediated activation increases the detoxification potential of mouse FSCMCs. (A and B) BV (12.5 µg at 500 µg/ml final concentration, resulting in a PLA2 concentration of approximately 60 µg/ml) was either mixed with (A) indicated amounts of heparin or buffer or (B) supernatant of DNP-HSA-exposed non-sensitized or anti-DNP IgE-sensitized MCs for 10 min. After mixing with PLA2 substrate and incubation, substrate cleavage (as indicator of PLA2 activity) was measured. (C) BV (10 µg) was incubated (or not) with supernatant (MC SN) of unstimulated (unstim.) or BV-exposed (10 µg/ml; for 1 h) BV serum-sensitized FSCMCs for 1 h. In some cases, supernatant of activated FSCMCs was pre-incubated with protease inhibitor. After incubation of BV and supernatants, the mixtures were separated by PAGE, followed by Coomassie blue stain. (D–G) 3 T3 fibroblasts were seeded in chamber slides and stained with Fluo-4 (green). BV was pre-treated (or not) with protamine (100 µg)- or protease inhibitor (1x final concentration)-treatedMC SN of PBS serum or BV serum-sensitized FSMCs that were exposed to 10 µg/ml BV for 1 h. The pre-treated BV was then transferred onto the fibroblasts and monitoring of cell death, by confocal fluorescence microscopy imaging of TO-PRO-3 (turquoise)-positive nuclei over 60 min, was started immediately. (D) Representative pictures (outermost left: merge of brightfield, Fluo-4 and TO-PRO-3 fluorescence; remaining pictures show merges of Fluo-4 and TO-PRO-3 channels) of the field of views at indicated timepoints after addition of MC SN-treated BV are shown. Turquoise stains are nuclei of dead cells. The scale bars represent 10 µm. (E–G) Quantification of toxicity (measured as TO-PRO 3 signal) kinetics from time lapse microscopy data shown in (D). (E) shows the development of TO-PRO 3 mean fluorescence intensity (MFI) over time. (F) Depicts the TO-PRO-3 MFI 60 min after BV addition in all cells in the field of view. (G)Illustrates the proportions of dead (with MFI ≥1) and live (with MFI <1) cells (numbers indicate the respective identified and quantified nuclei) in the field of view. (A–G) data are from one of at least two independent experiments, each of which gave similar results. (A and B) T test for pairwise comparisons in (A) to the control group (no heparin) or (B) as indicated; graphs represent mean +SD; (F) one-way ANOVA with Tukey’s test for multiple comparisons (p values are adjusted for multiple testing); * (or n.s.—not significant) indicates comparisons to the respective untreated (or PBS serum) group (or as indicated); ° indicates comparisons with the BV serum group; p values are adjusted for multiple testing; */°p ≤ .05; **/°°p ≤ .01; ***/°°°p ≤ .001CC BY · PubMed Central
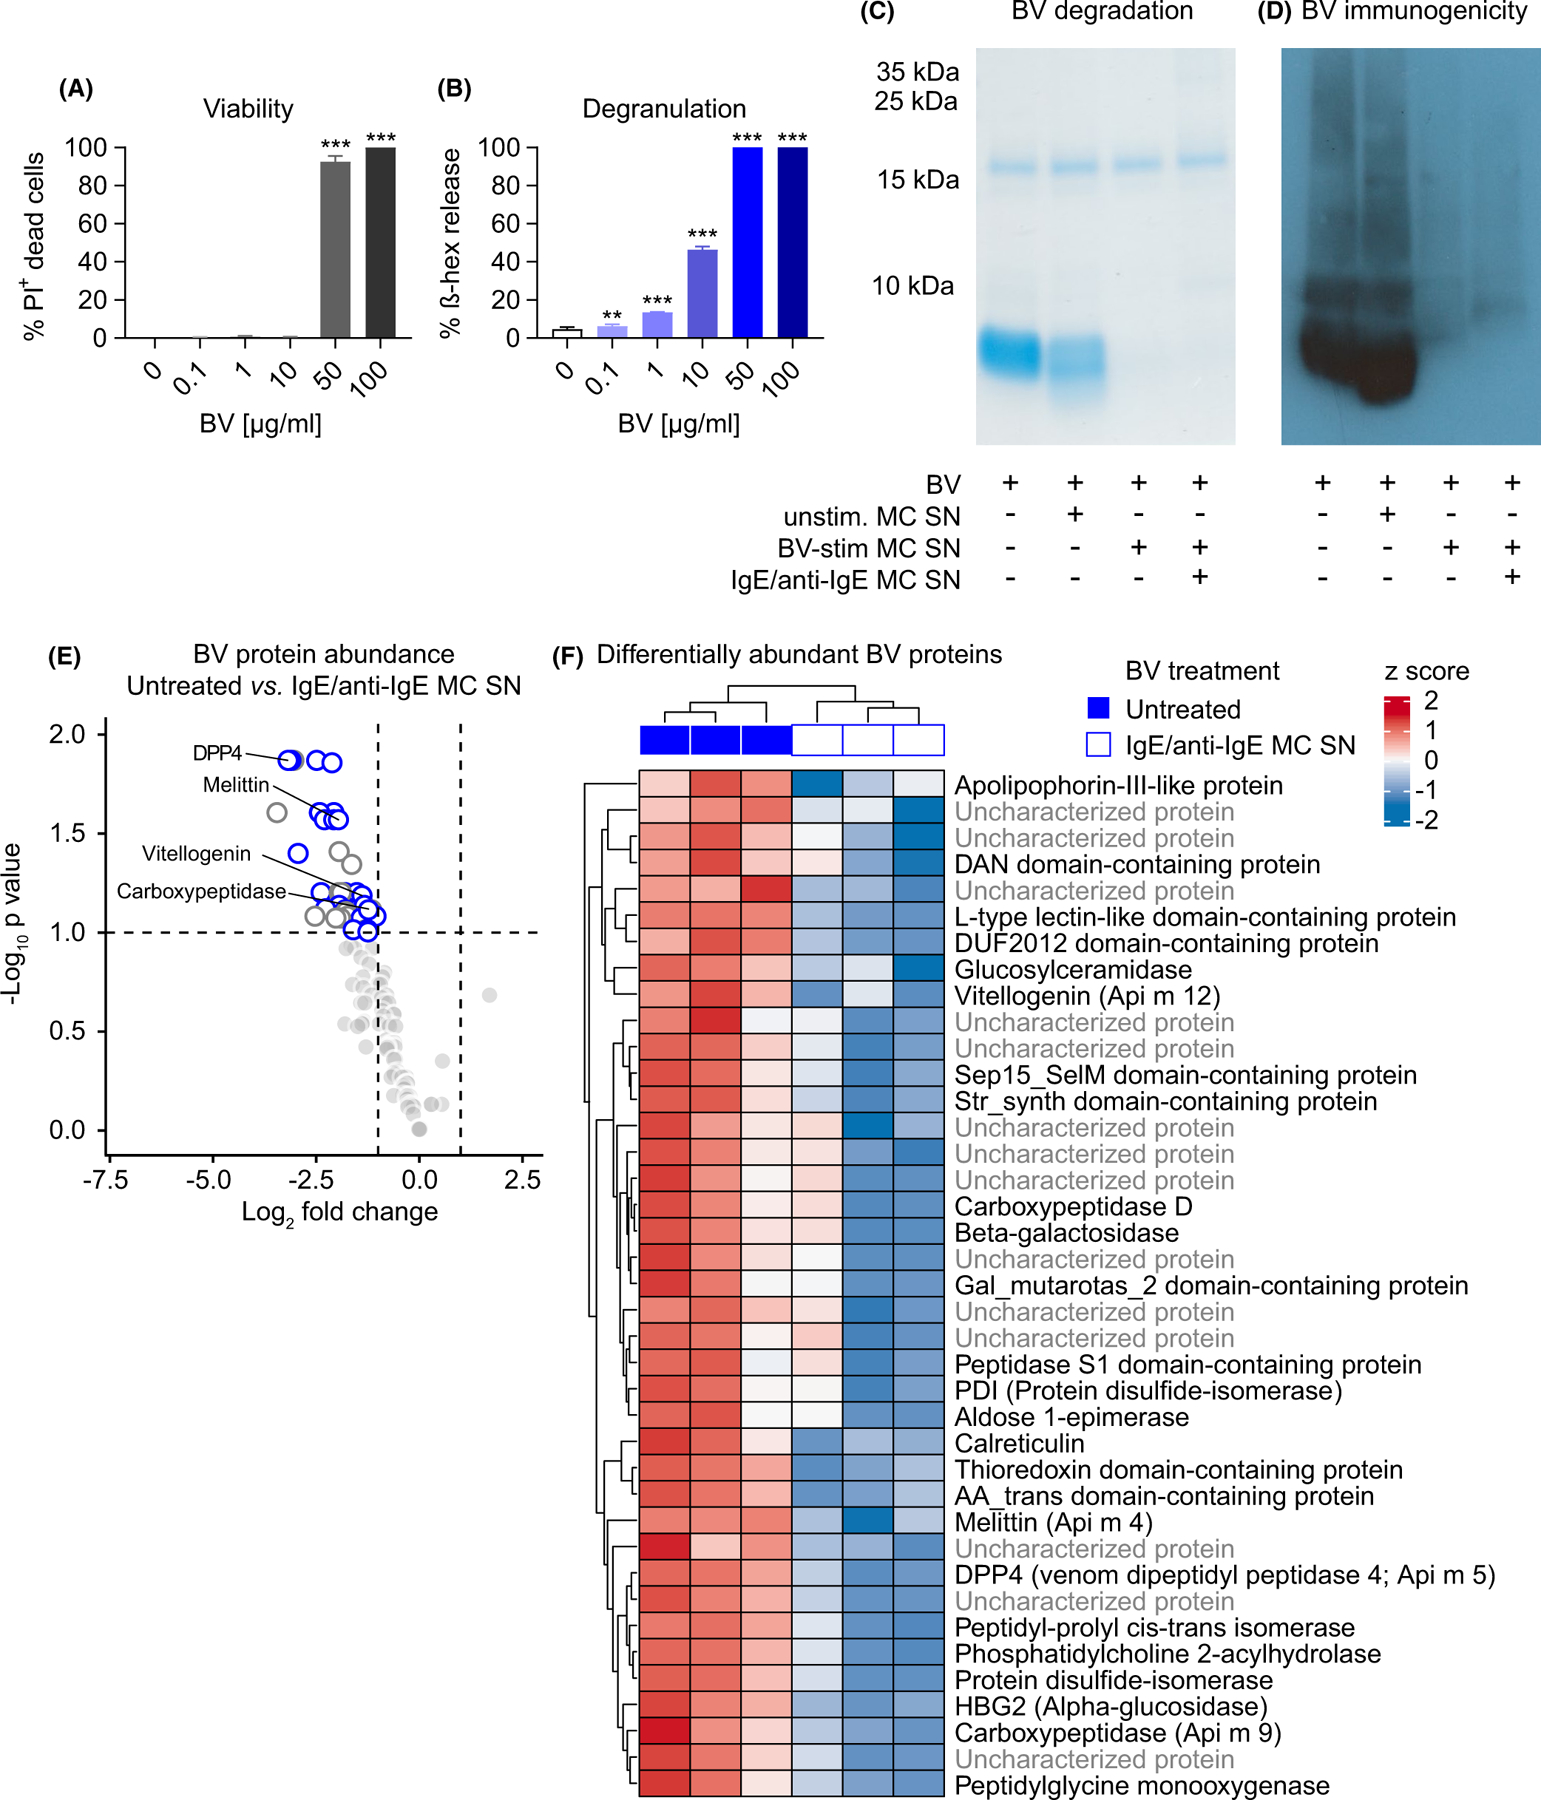
FIGURE 5 Immunoglobulin E-activated human PBCMCs efficiently degrade BV toxins. (A –B) Human peripheral blood-derived cultured MCs (hu PBCMCs) were stimulated with the indicated concentrations of BV and analyzed after 1 h. (A) Viability assessed by flow cytometry as percentage of PI+ among all c-Kit+ FcεRIα+cells. (B) ß hexosaminidase (ß-hex) released into the supernatant (% of total ß-hex-mediated signal). (C and D) BV (10 µg) was exposed to supernatant (MC SN) collected from either unstimulated (unstim.), 10 µg/ml BV-stimulated (BV-stim), or IgE/anti-IgE stimulated (for 1 h) hu PBCMCs and then processed by PAGE. (C) Coomassie blue-stained gel. (D) Western blot showing signals of IgG antibodies after incubation with BV serum. (E and F) Mass spectrometry analysis (of sample triplicates) of BV after 1 h exposure to supernatant of IgE/anti-IgE-stimulated hu PBCMCs (vs. untreated BV). In total, 118BV proteins were identified. (E) Volcano plot or (F) heatmap depicting the abundance of identified BV proteins. (E) BV proteins with significantly different abundance are highlighted (see panel F or Table S1 for full designations). Of the 39 proteins with lower abundance (FDR 0.1), the characterized compounds are indicated as white circles with blue border, the uncharacterized ones are indicated as white circles with gray border. Known allergens are annotated. (F) Heatmap of BV protein abundance of compounds with a statistically significantly different abundance (FDR 0.1). Raw and adjusted p values and fold changes are shown in Table S1. Raw abundances were log2 and z-score transformed prior to visualization. (A–D) data are from one of at least two independent experiments each of which gave similar results. (A and B) graphs represent mean +SD; one-way ANOVA with Dunnett’s test for multiple comparisons (p values are adjusted for multiplicity analysis); * indicates comparisons with the untreated (0 µg/ml BV) group; p values are adjusted for multiple testing; **p ≤ .01; ***p ≤ .001(E and F) Mass spec analysis of sample triplicates was performed once
FIGURE 5 Immunoglobulin E-activated human PBCMCs efficiently degrade BV toxins. (A –B) Human peripheral blood-derived cultured MCs (hu PBCMCs) were stimulated with the indicated concentrations of BV and analyzed after 1 h. (A) Viability assessed by flow cytometry as percentage of PI+ among all c-Kit+ FcεRIα+cells. (B) ß hexosaminidase (ß-hex) released into the supernatant (% of total ß-hex-mediated signal). (C and D) BV (10 µg) was exposed to supernatant (MC SN) collected from either unstimulated (unstim.), 10 µg/ml BV-stimulated (BV-stim), or IgE/anti-IgE stimulated (for 1 h) hu PBCMCs and then processed by PAGE. (C) Coomassie blue-stained gel. (D) Western blot showing signals of IgG antibodies after incubation with BV serum. (E and F) Mass spectrometry analysis (of sample triplicates) of BV after 1 h exposure to supernatant of IgE/anti-IgE-stimulated hu PBCMCs (vs. untreated BV). In total, 118BV proteins were identified. (E) Volcano plot or (F) heatmap depicting the abundance of identified BV proteins. (E) BV proteins with significantly different abundance are highlighted (see panel F or Table S1 for full designations). Of the 39 proteins with lower abundance (FDR 0.1), the characterized compounds are indicated as white circles with blue border, the uncharacterized ones are indicated as white circles with gray border. Known allergens are annotated. (F) Heatmap of BV protein abundance of compounds with a statistically significantly different abundance (FDR 0.1). Raw and adjusted p values and fold changes are shown in Table S1. Raw abundances were log2 and z-score transformed prior to visualization. (A–D) data are from one of at least two independent experiments each of which gave similar results. (A and B) graphs represent mean +SD; one-way ANOVA with Dunnett’s test for multiple comparisons (p values are adjusted for multiplicity analysis); * indicates comparisons with the untreated (0 µg/ml BV) group; p values are adjusted for multiple testing; **p ≤ .01; ***p ≤ .001(E and F) Mass spec analysis of sample triplicates was performed onceCC BY · PubMed Central
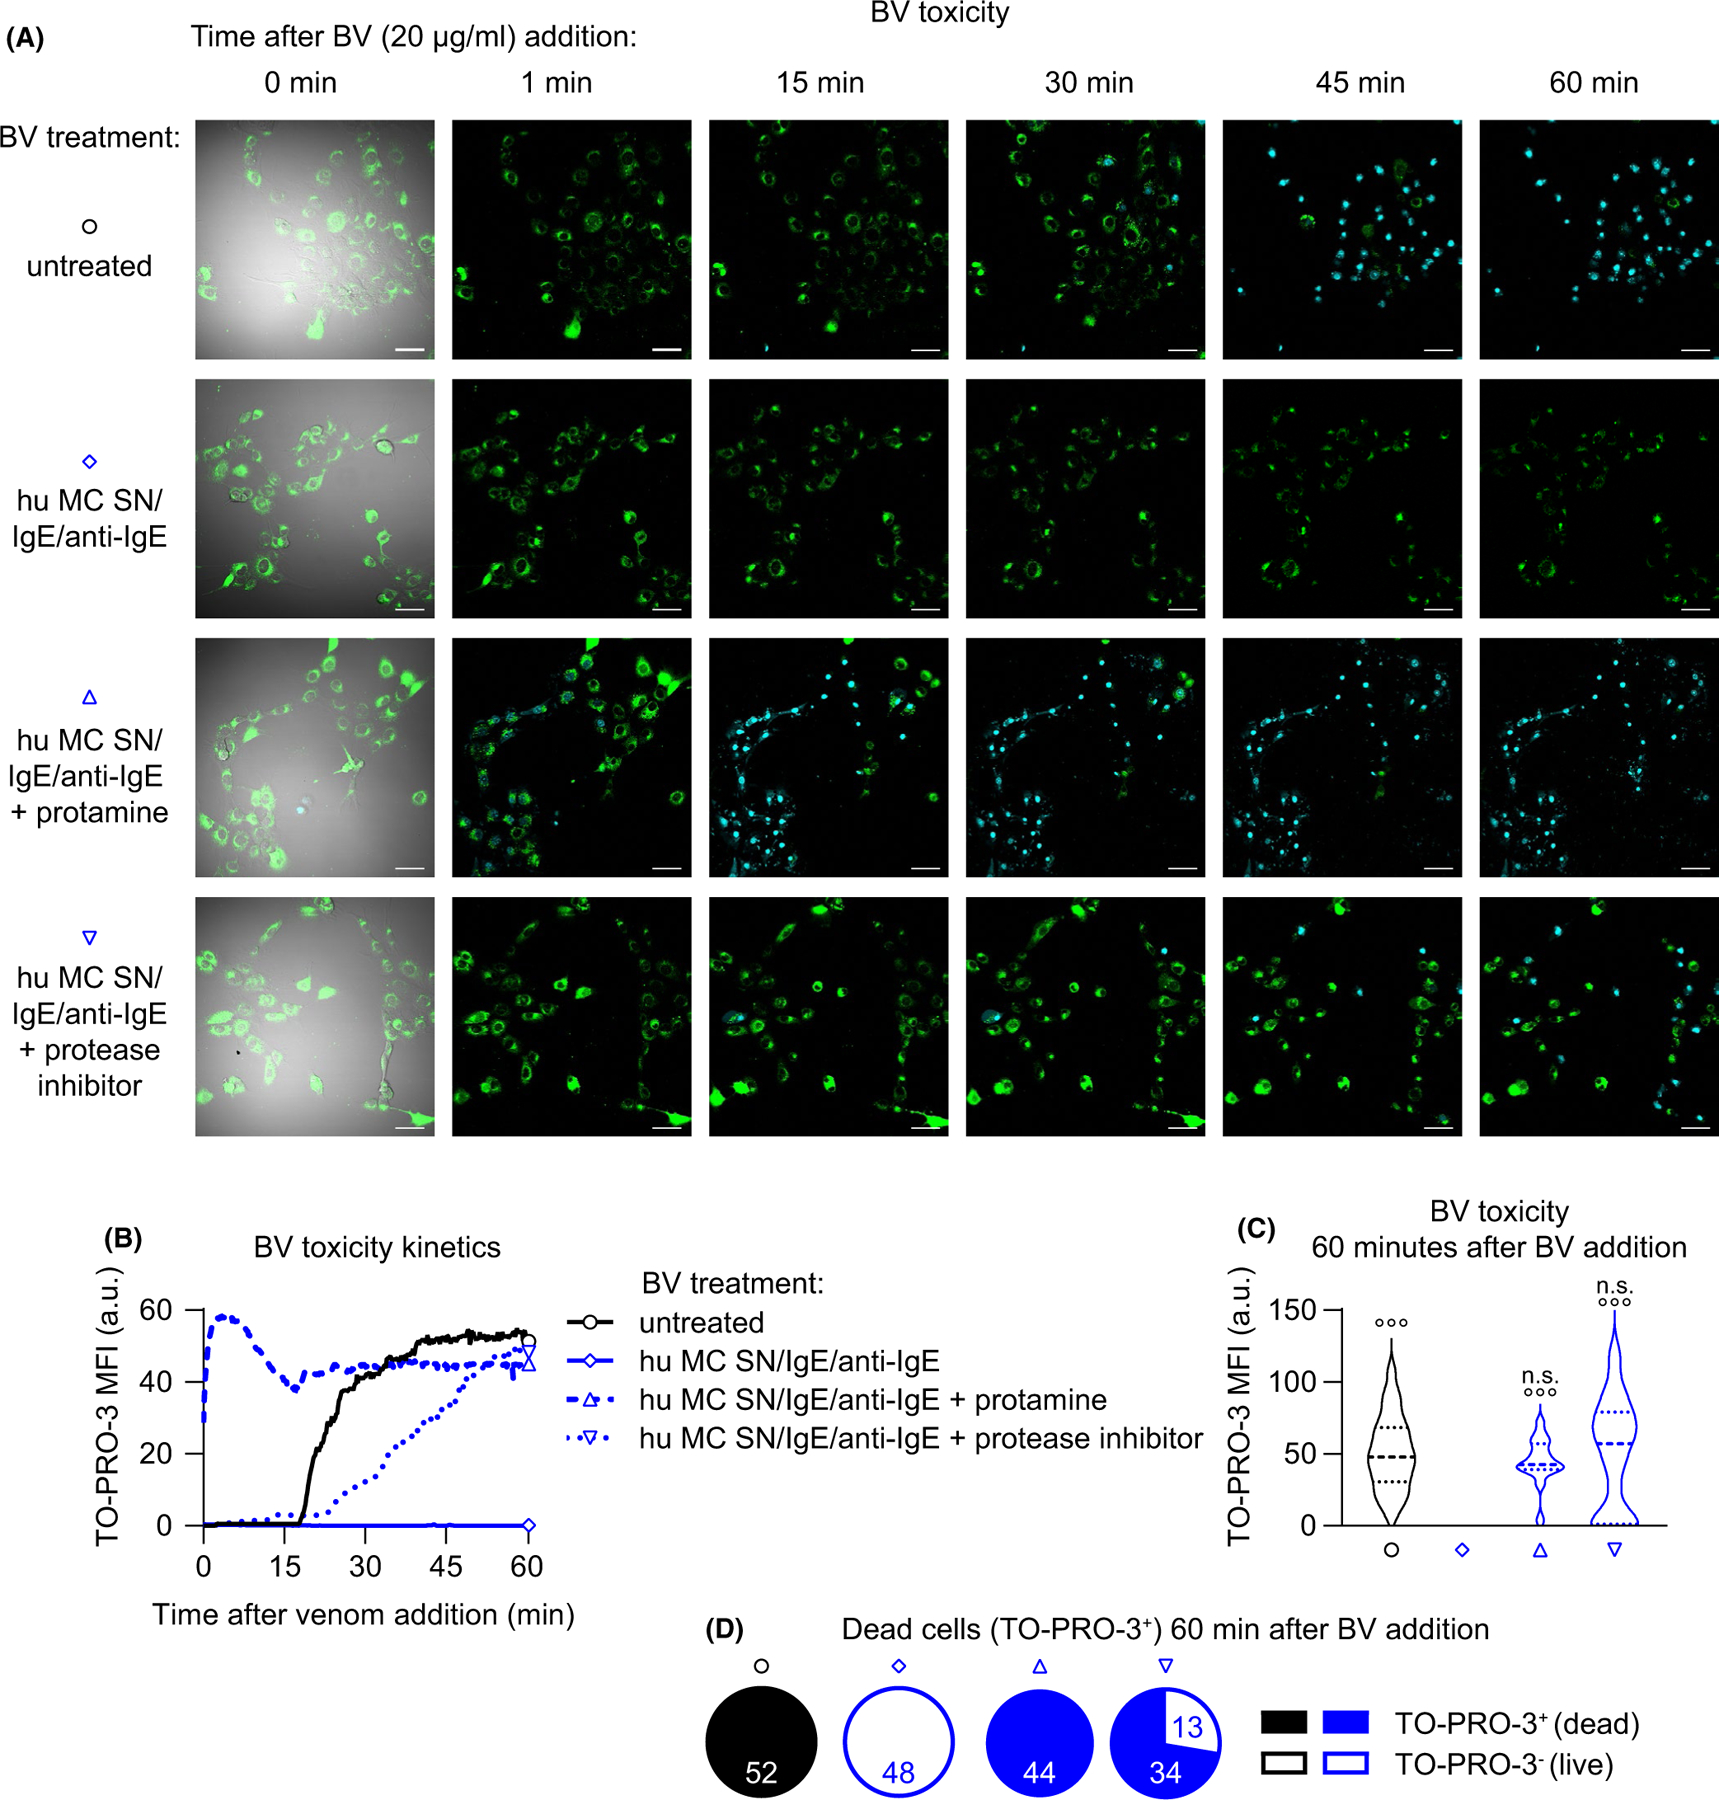
FIGURE 6 Heparin and proteases released by IgE-activated human PBCMCs interfere with BV toxicity. (A) 3 T3 fibroblasts were seeded in chamber slides and stained with Fluo-4 (green). Untreated BV (20 µg/ml final concentration) or BV pre-treated with supernatants of hu PBCMCs (stimulated for 1 h by IgE/anti-IgE; hu MC SN) that were either untreated or pre-treated with protamine (100 µg) or protease inhibitor (1x final concentration) were transferred onto the fibroblasts, and monitoring by confocal fluorescence microscopy imaging over 60 min was started immediately. Representative pictures (outermost left: merge of bright field, Fluo-4 and TO-PRO-3; remaining pictures show merges of Fluo-4 and TO-PRO-3 channels) of the field of views at different timepoints after venom addition are shown. Turquoise stains are (TO-PRO-3+) nuclei of dead cells. (B–D) Quantification of toxicity (measured as TO-PRO-3 signal) kinetics from time lapse microscopy data shown in (A). (B) shows the development of TO-PRO-3 mean fluorescence intensity (MFI) over time. (C) depicts the TO-PRO-3 signal 60 min after BV addition and show (upper panel) MFI all cells and (D) shows the portions of dead (with MFI ≥1) and live (with MFI <1) cells (numbers indicate the respective identified and quantified nuclei per field of view). (A–D) data are representative of at least two independent experiments. (C) One-way ANOVA with Tukey’s test for multiple comparisons (p values are adjusted for multiple testing); n.s. (not significant) indicates comparisons to the respective untreated (or PBS serum) group (or as indicated); ° indicates comparisons with the BV serum group; p values are adjusted for multiple testing; °°°p ≤ .001
FIGURE 6 Heparin and proteases released by IgE-activated human PBCMCs interfere with BV toxicity. (A) 3 T3 fibroblasts were seeded in chamber slides and stained with Fluo-4 (green). Untreated BV (20 µg/ml final concentration) or BV pre-treated with supernatants of hu PBCMCs (stimulated for 1 h by IgE/anti-IgE; hu MC SN) that were either untreated or pre-treated with protamine (100 µg) or protease inhibitor (1x final concentration) were transferred onto the fibroblasts, and monitoring by confocal fluorescence microscopy imaging over 60 min was started immediately. Representative pictures (outermost left: merge of bright field, Fluo-4 and TO-PRO-3; remaining pictures show merges of Fluo-4 and TO-PRO-3 channels) of the field of views at different timepoints after venom addition are shown. Turquoise stains are (TO-PRO-3+) nuclei of dead cells. (B–D) Quantification of toxicity (measured as TO-PRO-3 signal) kinetics from time lapse microscopy data shown in (A). (B) shows the development of TO-PRO-3 mean fluorescence intensity (MFI) over time. (C) depicts the TO-PRO-3 signal 60 min after BV addition and show (upper panel) MFI all cells and (D) shows the portions of dead (with MFI ≥1) and live (with MFI <1) cells (numbers indicate the respective identified and quantified nuclei per field of view). (A–D) data are representative of at least two independent experiments. (C) One-way ANOVA with Tukey’s test for multiple comparisons (p values are adjusted for multiple testing); n.s. (not significant) indicates comparisons to the respective untreated (or PBS serum) group (or as indicated); ° indicates comparisons with the BV serum group; p values are adjusted for multiple testing; °°°p ≤ .001CC BY · PubMed Central

Verification

Claims the paper makes

The claims and statistics of this paper haven’t been checked yet.

Run the check — free, no account needed. It reads the open-access text and checks the sources it cites.

A few free checks a day · papers already verified open instantly · results are public

Claims other papers make about this one

Each is checked against this paper’s own text: does it say what the citing paper says it does?

Self-check

Percentages, sums and reported differences re-computed from the paper’s own numbers.

The self-check needs the paper’s full text.

Citations

Cites

Show all 1 references

Research works printed but not linked: 37

  1. 10.1038/nri3690 · DOI · Paper page
  2. 10.1016/j.jaci.2017.06.003 · DOI
  3. 10.1038/nri3427 · DOI · Paper page
  4. 10.1007/s00281-016-0565-1 · DOI
  5. 10.1016/j.jaci.2018.10.054 · DOI
  6. 10.1146/annurev.genom.9.081307.164356 · DOI
  7. 10.1038/nature11047 · DOI · Paper page
  8. 10.1086/417049 · DOI · Paper page
  9. 10.1353/pbm.1974.0027 · DOI · Paper page
  10. 10.3389/fimmu.2019.02090 · DOI
  11. 10.1111/all.13262 · DOI
  12. 10.1126/science.177.4046.314 · DOI · Paper page
  13. 10.1126/science.1128877 · DOI · Paper page
  14. 10.1084/jem.20071262 · DOI · Paper page
  15. 10.1172/JCI46139 · DOI · Paper page
  16. 10.1016/j.jaci.2015.08.005 · DOI · Paper page
  17. 10.1016/j.immuni.2013.10.005 · DOI · Paper page
  18. 10.1016/j.immuni.2013.10.006 · DOI · Paper page
  19. 10.1016/0041-0101(95)00011-A · DOI
  20. 10.1038/ncomms7174 · DOI
  21. 10.1002/eji.201444546 · DOI
  22. 10.1172/JCI85538 · DOI
  23. 10.1111/imr.12634 · DOI
  24. 10.1111/imr.12629 · DOI
  25. 10.4049/jimmunol.106.1.233 · DOI · Paper page
  26. 10.1038/nature03085 · DOI · Paper page
  27. Jaques LB, 1973, Protamine–antagonist to heparin, Can Med Assoc J, 108, 1291
  28. 10.3389/fimmu.2014.00077 · DOI
  29. 10.1016/j.jaci.2013.10.060 · DOI
  30. 10.1038/nri2273 · DOI
  31. 10.1038/nri2782 · DOI · Paper page
  32. 10.1038/nri3476 · DOI
  33. 10.1038/nri3632 · DOI
  34. 10.1126/sciimmunol.aat1604 · DOI
  35. 10.1007/s00103-012-1652-7 · DOI
  36. 10.1111/all.13071 · DOI
  37. 10.1097/01.all.0000173783.42906.95 · DOI · Paper page

Cited by

Sorted by citations

Metadata

Authors
Starkl, P., Gaudenzio, N., Marichal, T., Reber, L. L., Sibilano, R., Watzenboeck, M. L., Fontaine, F., Mueller, A. C., Tsai, M., Knapp, S., & Galli, S. J.
Affiliations
  • Laboratory of Infection Biology Department of Medicine I Medical University of Vienna Vienna Austria
  • Department of Pathology Stanford University School of Medicine Stanford CA USA
  • Department of Biomedical Imaging and Image‐guided Therapy Medical University of Vienna Vienna Austria
  • CeMM ‐ Research Center for Molecular Medicine of the Austrian Academy of Sciences Vienna Austria
Venue
Allergy
Publisher
Wiley
Published
2021-05-06
Volume
77
Issue
2
Pages
499-512
ISSN
  • 0105-4538
  • 1398-9995
Cited by
33
References
1
Language
en
Funders
  • H2020 Marie Skłodowska-Curie Actions (655153)
  • Austrian Science Fund (J3399‐B21, P31113‐B30)
  • Fondation Acteria
  • Fonds De La Recherche Scientifique - FNRS (F.4508.18)
  • Institut National de la Santé et de la Recherche Médicale
  • National Institute of Allergy and Infectious Diseases (R01 AI23990, R01 AI070813, R01 AI132494, R01 AR067145)
  • Agence Nationale de la Recherche (ANR‐18‐CE18‐0023)

About these checks

Registry, retraction, Cites and statistics results are computed, not judged, with one exception: a printed reference that no index lists is read once by a model before it counts as a citation error. Claims are extracted by a model and kept only when their quote appears verbatim in the text; each cited source is then checked, with a model’s help, for whether it says what the claim relies on. Those verdicts can be wrong — read the claim’s quote and the cited source before relying on one.

Statistics and arithmetic are recomputed, not judged.

Confidence bands are shown only for fields calibrated on our annotated test set. None is calibrated yet, so no band is shown.

What counts as a claim ›How we measure confidence ›How we check this ›

Are you an author, or do you see a problem with this page? Request a review