

The DOI matches its Crossref record; 35 of the 36 references it cites were found in a registry or an index.
Quality control parameters on a large dataset of regionally dissected human control brains for whole genome expression studies
Open accessAbstract
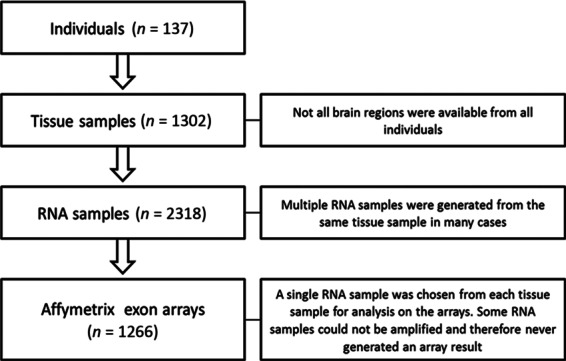
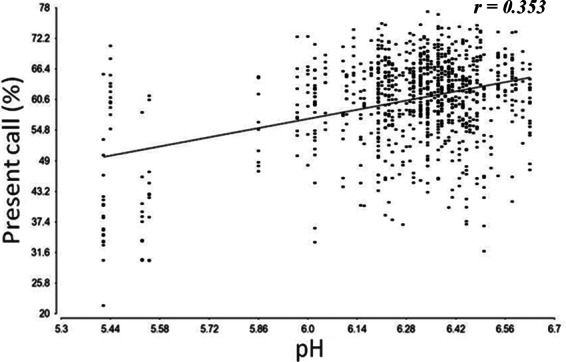
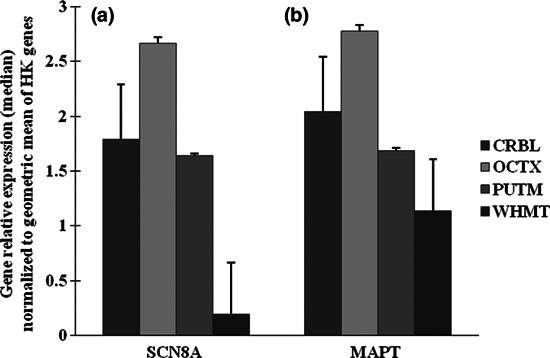
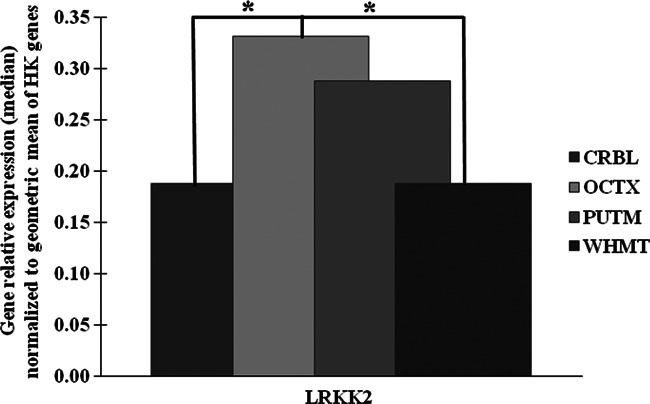
We are building an open-access database of regional human brain expression designed to allow the genome-wide assessment of genetic variability on expression. Array and RNA sequencing technologies make assessment of genome-wide expression possible. Human brain tissue is a challenging source for this work because it can only be obtained several and variable hours post-mortem and after varying agonal states. These variables alter RNA integrity in a complex manner. In this report, we assess the effect of post-mortem delay, agonal state and age on gene expression, and the utility of pH and RNA integrity number as predictors of gene expression as measured on 1266 Affymetrix Exon Arrays. We assessed the accuracy of the array data using QuantiGene, as an independent non-PCR-based method. These quality control parameters will allow database users to assess data accuracy. We report that within the parameters of this study post-mortem delay, agonal state and age have little impact on array quality, array data are robust to variable RNA integrity, and brain pH has only a small effect on array performance. QuantiGene gave very similar expression profiles as array data. This study is the first step in our initiative to make human, regional brain expression freely available.
Overview
The claims and statistics of this paper haven’t been checked yet.
Run the check — free, no account needed. It reads the open-access text and checks the sources it cites.
Integrity signals
Registry
Cites
Statistics
Figures
Verification
Claims the paper makes
The claims and statistics of this paper haven’t been checked yet.
Run the check — free, no account needed. It reads the open-access text and checks the sources it cites.
Claims other papers make about this one
Each is checked against this paper’s own text: does it say what the citing paper says it does?
In the citing paper
“Expression profiling during human brain aging is particularly challenging since it can take hours to days before postmortem tissue is stabilized (Melé et al., 2015; Soreq et al., 2017; Trabzuni et al., 2011).”
From Atlas of the aging mouse brain reveals white matter as vulnerable foci (2023) · cites this paper as Trabzuni et al., 2011
Self-check
Percentages, sums and reported differences re-computed from the paper’s own numbers.
The self-check needs the paper’s full text.
Citations
Cites
Single-Step Method of RNA Isolation by Acid Guanidinium Thiocyanate–Phenol–Chloroform Extraction
Chomczynski, P., & Sacchi, N. (1987) · Analytical Biochemistry · doi:10.1006/abio.1987.9999 · Cited by 65,515 · cited 1×
“Total RNA was isolated from human post-mortem brain tissues based on the single-step method of RNA isolation (Chomczynski and Sacchi 1987) using the miRNeasy 96 kit (Qiagen, Crawley, UK).”
MethodThe RIN: an RNA integrity number for assigning integrity values to RNA measurements
Schroeder, A., Mueller, O., Stocker, S., Salowsky, R., Leiber, M., Gassmann, M., Lightfoot, S., Menzel, W., Granzow, M., & Ragg, T. (2006) · BMC Molecular Biology · doi:10.1186/1471-2199-7-3 · Cited by 2,623
mRNA stability in mammalian cells
Ross, J. (1995) · Microbiological Reviews · doi:10.1128/mr.59.3.423-450.1995 · Cited by 1,411
Evidence Based Selection of Housekeeping Genes
de Jonge, H. J. M., Fehrmann, R. S. N., de Bont, E. S. J. M., Hofstra, R. M. W., Gerbens, F., Kamps, W. A., de Vries, E. G. E., van der Zee, A. G. J., Meerman, G. J. T., & ter Elst, A. (2007) · PLoS ONE · doi:10.1371/journal.pone.0000898 · Cited by 748
Evaluation of DNA microarray results with quantitative gene expression platforms
Canales, R. D., Luo, Y., Willey, J. C., Austermiller, B., Bárbácioru, C., Boysen, C., Hunkapiller, K., Jensen, R. V., Knight, C. R., Lee, K. Y., et al. (2006) · Nature Biotechnology · doi:10.1038/nbt1236 · Cited by 622
Imbeaud, S. (2005) · Nucleic Acids Research · doi:10.1093/nar/gni054 · Cited by 556 · cited 2×
“The calculation of RIN value is largely based on ribosomal RNA separation although this measure has been shown to be inconsistent (Imbeaud et al. 2005; Schroeder et al. 2006; Sherwood et al. 2011).”
A survey of genetic human cortical gene expression
Myers, A. J., Gibbs, J. R., Webster, J. A., Rohrer, K., Zhao, A., Marlowe, L., Kaleem, M., Leung, D., Bryden, L., Nath, P., et al. (2007) · Nature Genetics · doi:10.1038/ng.2007.16 · Cited by 479
Self-citationValidity of nucleic acid purities monitored by 260nm/280nm absorbance ratios.
Glasel, J. A. (1995) · PubMed · Cited by 437
Human postmortem tissue: What quality markers matter?
Stan, A. D., Ghose, S., Gao, X.-M., Roberts, R. C., Lewis-Amezcua, K., Hatanpaa, K. J., & Tamminga, C. A. (2006) · Brain Research · doi:10.1016/j.brainres.2006.09.025 · Cited by 361
Harrison, P. J., Heath, P. R., Eastwood, S. L., Burnet, P. W. J., McDonald, B., & Pearson, R. C. A. (1995) · Neuroscience Letters · doi:10.1016/0304-3940(95)12102-a · Cited by 342
Research works printed but not linked: 1
- 10.1016/0003-2697(87)90021-2 · DOI
Cited by
Sorted by citations
Giambartolomei, C., Vukcevic, D., Schadt, E. E., Franke, L., Hingorani, A. D., Wallace, C., & Plagnol, V. (2014) · PLoS Genetics · doi:10.1371/journal.pgen.1004383 · Cited by 4,261
“The database and browser currently include the possibility of investigating colocalisation only with liver expression data, however the resource will soon be extended to include expression in different tissues (including brain, [24, 25]), a multiplicity of molecular phenotypes and clinical variables, and different dis…”
BackgroundA Hexanucleotide Repeat Expansion in C9ORF72 Is the Cause of Chromosome 9p21-Linked ALS-FTD
Renton, A. E., Majounie, E., Waite, A., Simón-Sánchez, J., Rollinson, S., Gibbs, J. R., Schymick, J. C., Laaksovirta, H., van Swieten, J. C., Myllykangas, L., et al. (2011) · Neuron · doi:10.1016/j.neuron.2011.09.010 · Cited by 4,409
“Expression profiling on Affymetrix GeneChip Human Exon 1.0 ST Arrays (Affymetrix, UK) was performed on CNS tissue obtained from 137 neurologically normal individuals at AROS Applied Biotechnology AS company laboratories (http://www.arosab.com/) (Trabzuni et al., 2011).”
MethodInfluentialSelf-citationGene-Wide Analysis Detects Two New Susceptibility Genes for Alzheimer's Disease
Escott-Price, V., Bellenguez, C., Wang, L.-S., Choi, S.-H., Harold, D., Jones, L., Holmans, P., Gerrish, A., Vedernikov, A., Richards, A., et al. (2014) · PLoS ONE · doi:10.1371/journal.pone.0094661 · Cited by 1,398
“Further examination in the BRAINEAC database[22] (www.”
Self-citationCommon genetic variants influence human subcortical brain structures
Initiative, T. A. D. N., Hibar, D. P., The CHARGE Consortium, EPIGEN, IMAGEN, SYS, Stein, J. L., Renteria, M. E., Arias-Vasquez, A., Desrivières, S., et al. (2015) · Nature · doi:10.1038/nature14101 · Cited by 858
Self-citationGenetic variability in the regulation of gene expression in ten regions of the human brain
UK Brain Expression Consortium, Ramasamy, A., North American Brain Expression Consortium, Trabzuni, D., Guelfi, S., Varghese, V., Smith, C., Walker, R., De, T., Coin, L., et al. (2014) · Nature Neuroscience · doi:10.1038/nn.3801 · Cited by 644
Self-citationIdentification of common variants associated with human hippocampal and intracranial volumes
(ADNI), T. A. D. N. I., Stein, J. L., Murray, R. M., Medland, S. E., Vásquez, A. A., Hibar, D. P., Senstad, R. E., Winkler, A. M., Toro, R., Appel, K., et al. (2012) · Nature Genetics · doi:10.1038/ng.2250 · Cited by 634
Self-citationRare coding variants in the phospholipase D3 gene confer risk for Alzheimer’s disease
Cruchaga, C., Karch, C. M., Jin, S. C., Benitez, B. A., Cai, Y., Guerreiro, R., Harari, O., Norton, J., Budde, J., Bertelsen, S., et al. (2014) · Nature · doi:10.1038/nature12825 · Cited by 461
Self-citationSystems biology and gene networks in neurodevelopmental and neurodegenerative disorders
Parikshak, N. N., Gandal, M. J., & Geschwind, D. H. (2015) · Nature Reviews Genetics · doi:10.1038/nrg3934 · Cited by 430
“Notably, molecular profiles in post-mortem gene expression studies are affected by RNA degradation and post-mortem intervals 179 , but other technical factors including library preparation and sequencing depth in RNA-seq analysis should also be carefully evaluated 180,181 .”
BackgroundLo, M., Hinds, D. A., Tung, J. Y., Franz, C. E., Fan, C.-C., Wang, Y., Smeland, O. B., Schork, A. J., Holland, D., Kauppi, K., et al. (2016) · Nature Genetics · doi:10.1038/ng.3736 · Cited by 462
Qi, T., Wu, Y., Zeng, J., Zhang, F., Xue, A., Jiang, L., Zhu, Z., Kemper, K., Yengo, L., Zheng, Z., et al. (2018) · Nature Communications · doi:10.1038/s41467-018-04558-1 · Cited by 427
Major Shifts in Glial Regional Identity Are a Transcriptional Hallmark of Human Brain Aging
Soreq, L., Rose, J., Soreq, E., Hardy, J., Trabzuni, D., Cookson, M. R., Smith, C., Ryten, M., Patani, R., & Ule, J. (2017) · Cell Reports · doi:10.1016/j.celrep.2016.12.011 · Cited by 419
“Quality Assessment and Array Pre-processing For the UKBEC dataset, all quality measurements were extensively described in a previous publication (Trabzuni et al., 2011).”
MethodSelf-citationFrontotemporal dementia and its subtypes: a genome-wide association study
Ferrari, R., Hernandez, D. G., Nalls, M. A., Rohrer, J. D., Ramasamy, A., Kwok, J. B. J., Dobson-Stone, C., Brooks, W. S., Schofield, P. R., Halliday, G. M., et al. (2014) · The Lancet Neurology · doi:10.1016/s1474-4422(14)70065-1 · Cited by 383
Self-citationMatarin, M., Salih, D. A., Yasvoina, M., Cummings, D. M., Guelfi, S., Liu, W., Nahaboo Solim, M. A., Moens, T. G., Paublete, R. M., Ali, S. S., et al. (2015) · Cell Reports · doi:10.1016/j.celrep.2014.12.041 · Cited by 290
Self-citationA novel Alzheimer disease locus located near the gene encoding tau protein
Jun, G., Ibrahim-Verbaas, C. A., Vronskaya, M., Lambert, J.-C., Chung, J., Naj, A. C., Kunkle, B. W., Wang, L.-S., Bis, J. C., Bellenguez, C., et al. (2016) · Molecular Psychiatry · doi:10.1038/mp.2015.23 · Cited by 297
Self-citationHill, W. D., Marioni, R. E., Maghzian, O., Ritchie, S. J., Hagenaars, S. P., McIntosh, A. M., Gale, C. R., Davies, G., & Deary, I. J. (2019) · Molecular Psychiatry · doi:10.1038/s41380-017-0001-5 · Cited by 311
Widespread sex differences in gene expression and splicing in the adult human brain
Trabzuni, D., Ramasamy, A., Imran, S., WALKER, R. E., Smith, C., Weale, M. E., Hardy, J., & Ryten, M. (2013) · Nature Communications · doi:10.1038/ncomms3771 · Cited by 306
Self-citationGene expression changes with age in skin, adipose tissue, blood and brain
Glass, D., Viñuela, A., Davies, M. N., Ramasamy, A., Parts, L., Knowles, D. A., Brown, A. A., Hedman, Å. K., Small, K. S., Buil, A., et al. (2013) · Genome biology · doi:10.1186/gb-2013-14-7-r75 · Cited by 288
“To explore common expression signatures of aging in other tissues, expression data from the Edinburgh brain bank were interrogated [16].”
Self-citationThe MS4A gene cluster is a key modulator of soluble TREM2 and Alzheimer’s disease risk
Deming, Y., Filipello, F., Cignarella, F., Cantoni, C., Hsu, S., Mikesell, R., Li, Z., Del-Aguila, J. L., Dube, U., Farias, F. G., et al. (2019) · Science Translational Medicine · doi:10.1126/scitranslmed.aau2291 · Cited by 271
“Similarly, rs1582763 produced a nominal cis-eQTL effect on MS4A6A expression in GTEx (frontal cortex: = 0.183, P = 0.04; cortex: = 0.165, P = 0.05) and Braineac (medulla: = 0.337, P = 4.50 × 10 −4 ) human brain tissue samples.”
InfluentialThe evolving spectrum ofPRRT2-associated paroxysmal diseases
Ebrahimi‐Fakhari, D., Saffari, A., Westenberger, A., & Klein, C. (2015) · Brain · doi:10.1093/brain/awv317 · Cited by 275
Mutations in ANO3 Cause Dominant Craniocervical Dystonia: Ion Channel Implicated in Pathogenesis
Charlesworth, G., Plagnol, V., Holmström, K. M., Brás, J., Sheerin, U., Preza, E., Rubio‐Agusti, I., Ryten, M., Schneider, S. A., Stamelou, M., et al. (2012) · The American Journal of Human Genetics · doi:10.1016/j.ajhg.2012.10.024 · Cited by 269
“…affiliate of Sun Health Corporation, USA.12 A full description of the samples used and the methods of RNA isolation and processing can be found in Trabzuni et al., 2011.13 As previously described, all arrays were preprocessed with robustmultiarray-average quantile normalization with GC…”
MethodInfluentialSelf-citationMutations in the histone methyltransferase gene KMT2B cause complex early-onset dystonia
Meyer, E., Study, D. D. D., Carss, K., Rankin, J., Nichols, J. M. E., Grozeva, D., Joseph, A. P., Mencacci, N. E., Papandreou, A., Ng, J., et al. (2016) · Nature Genetics · doi:10.1038/ng.3740 · Cited by 245
Trabzuni, D., Wray, S., Vandrovcova, J., Ramasamy, A., Walker, R., Smith, C., Luk, C., Gibbs, J. R., Dillman, A., Hernandez, D. G., et al. (2012) · Human Molecular Genetics · doi:10.1093/hmg/dds238 · Cited by 252
Self-citation(ADNI), A. D. N. I., Deming, Y., The Alzheimer Disease Genetic Consortium (ADGC), Li, Z., Kapoor, M., Harari, O., Del-Aguila, J. L., Black, K., Carrell, D., Cai, Y., et al. (2017) · Acta Neuropathologica · doi:10.1007/s00401-017-1685-y · Cited by 231
“p1 portal [33], data from the Brain eQTL Almanac (Braineac) [73] analyzed with the R package MatrixEQTL [68], and the Blood eQTL browser [79] were utilized to Deming et al.”
MethodLutz, P.-E., Tanti, A., Gasecka, A., Barnett-Burns, S., Kim, J. J., Zhou, Y., Chen, G. G., Wakid, M., Shaw, M., Almeida, D., et al. (2017) · American Journal of Psychiatry · doi:10.1176/appi.ajp.2017.16111286 · Cited by 203
Atlas of the aging mouse brain reveals white matter as vulnerable foci
Hahn, O., Foltz, A. G., Atkins, M., Kedir, B., Moran-Losada, P., Guldner, I. H., Munson, C., Kern, F., Pálovics, R., Lu, N., et al. (2023) · Cell · doi:10.1016/j.cell.2023.07.027 · Cited by 213
Kia, D. A., Zhang, D., Guelfi, S., Manzoni, C., Hubbard, L., Reynolds, R. H., Botía, J. A., Ryten, M., Ferrari, R., Lewis, P. A., et al. (2021) · JAMA Neurology · doi:10.1001/jamaneurol.2020.5257 · Cited by 206
“Braineac eQTL Data The UK Brain Expression Consortium Braineac data set contains data from 10 brain regions obtained from 134 control individuals: frontal cortex, temporal cortex,occipital cortex,hippocampus, thalamus, putamen, substantia nigra, medulla, cerebellum, andwhitematter, togetherwith themeanexpression acros…”
MethodSelf-citationInsights into TREM2 biology by network analysis of human brain gene expression data
Forabosco, P., Ramasamy, A., Trabzuni, D., Walker, R., Smith, C., Bras, J., Levine, A. P., Hardy, J., Pocock, J. M., Guerreiro, R., et al. (2013) · Neurobiology of Aging · doi:10.1016/j.neurobiolaging.2013.05.001 · Cited by 180
“We expressionprofiled 788 brain samples sampled from 101 neurologically and neuropathologically normal individuals (10 distinct brain regions each) as part of the UK Human Brain Expression Consortium (UKBEC), and used weighted gene co-expression network analysis (WGCNA) to group genes into modules in an unsupervised m…”
InfluentialSelf-citationAlpha‐synuclein mRNA expression in oligodendrocytes in MSA
Asi, Y. T., Simpson, J. E., Heath, P. R., Wharton, S. B., Lees, A. J., Révész, T., Houlden, H., & Holton, J. L. (2014) · Glia · doi:10.1002/glia.22653 · Cited by 197
“The expression trend found in MSA and control cases used in this study is similar to that documented in expression databases such as UKBEC and Allen Brain Atlas, which analyze gene expression in control human brains (Hawrylycz et al. 2012; Trabzuni et al. 2011).”
ResultMutations in the autoregulatory domain of β‐tubulin 4a cause hereditary dystonia
Hersheson, J., Mencacci, N. E., Davis, M. B., MacDonald, N., Trabzuni, D., Ryten, M., Pittman, A. M., Paudel, R., Kara, E., Fawcett, K. A., et al. (2012) · Annals of Neurology · doi:10.1002/ana.23832 · Cited by 179
“See Trabzuni et al for detailed methods.(23) CRBL 5 cerebellum; FCTX 5 frontal cortex; HIPP 5 hippocampus; MEDU 5 medulla; OCTX 5 occipital cortex; PUTM 5 putamen; SNIG 5 substantia nigra; TCTX 5 temporal cortex.”
BackgroundSelf-citationCellular correlates of cortical thinning throughout the lifespan
Vidal-Pineiro, D., Parker, N., Shin, J., French, L., Grydeland, H., Jackowski, A. P., Mowinckel, A. M., Patel, Y., Pausova, Z., Salum, G., et al. (2020) · Scientific Reports · doi:10.1038/s41598-020-78471-3 · Cited by 154
Recursive splicing in long vertebrate genes
Sibley, C. R., Emmett, W., Blázquez, L., Faro, A., Haberman, N., Briese, M., Trabzuni, D., Ryten, M., Weale, M. E., Hardy, J., et al. (2015) · Nature · doi:10.1038/nature14466 · Cited by 167
Self-citationThe clinical and genetic heterogeneity of paroxysmal dyskinesias
Gardiner, A., Jaffer, F., Dale, R. C., Labrum, R. W., Erro, R., Meyer, E., Xiromerisiou, G., Stamelou, M., Walker, M. C., Kullmann, D. M., et al. (2015) · Brain · doi:10.1093/brain/awv310 · Cited by 158
“Regional distribution of PRRT2, SLC2A1, PNKD, KCN1A, SNAP25 and CACNA1A mRNA expression in the normal human brain was determined using microarray analysis of human post-mortem brain tissue from the UK Human Brain Expression Consortium (Trabzuni et al., 2011).”
MethodPRRT2 Is a Key Component of the Ca2+-Dependent Neurotransmitter Release Machinery
Valente, P., Castroflorio, E., Rossi, P. I. A., Fadda, M., Sterlini, B., Cervigni, R. I., Prestigio, C., Giovedı̀, S., Onofri, F., Mura, E., et al. (2016) · Cell Reports · doi:10.1016/j.celrep.2016.03.005 · Cited by 153
A Missense Mutation in KCTD17 Causes Autosomal Dominant Myoclonus-Dystonia
Mencacci, N. E., Rubio‐Agusti, I., Zdebik, A. A., Asmus, F., Ludtmann, M. H. R., Ryten, M., Plagnol, V., Hauser, A., Bandrés‐Ciga, S., Bettencourt, C., et al. (2015) · The American Journal of Human Genetics · doi:10.1016/j.ajhg.2015.04.008 · Cited by 149
“0 ST Arrays and brain and CNS tissue originating from 134 control individuals, collected by the Medical Research Council (MRC) Sudden Death Brain and Tissue Bank, and the Sun Health Research Institute (SHRI), an affiliate of Sun Health Corporation, USA.(27) The plot shows significant variation in KCTD17 transcript exp…”
MethodSelf-citationSalpietro, V., Malintan, N. T., Llano-Rivas, I., Spaeth, C. G., Efthymiou, S., Striano, P., Vandrovcova, J., Cutrupi, M. C., Chimenz, R., David, E., et al. (2019) · The American Journal of Human Genetics · doi:10.1016/j.ajhg.2019.02.016 · Cited by 134
Hernandez, D. G., Nalls, M. A., Moore, M., Chong, S., Dillman, A., Trabzuni, D., Gibbs, J. R., Ryten, M., Arepalli, S., Weale, M. E., et al. (2012) · Neurobiology of Disease · doi:10.1016/j.nbd.2012.03.020 · Cited by 133
Self-citationSmeland, O. B., Frei, O., Kauppi, K., Hill, W. D., Li, W., Wang, Y., Krull, F., Bettella, F., Eriksen, J. A., Witoelar, A., et al. (2017) · JAMA Psychiatry · doi:10.1001/jamapsychiatry.2017.1986 · Cited by 137
Hall, J., Taylor, J., Valentine, H. R., Irlam, J. J., Eustace, A. J., Hoskin, P., Miller, C. J., & West, C. (2012) · British Journal of Cancer · doi:10.1038/bjc.2012.294 · Cited by 130
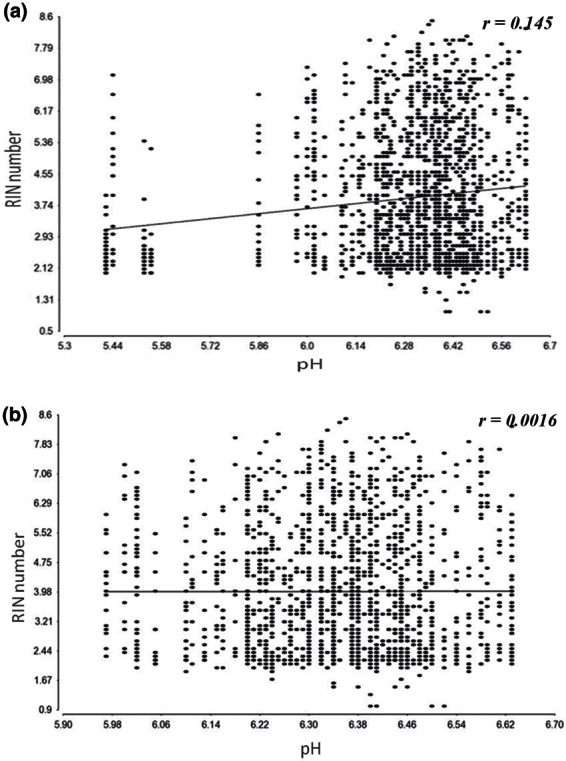
“Figure 1A shows that neither RNA yield nor RIN correlated with %DABG, which measures array performance (Linton et al, 2008; Trabzuni et al, 2011).”
BackgroundResultInfluentialErzurumluoglu, A. M., Liu, M., Jackson, V. E., Barnes, D. R., Datta, G., Melbourne, C., Young, R., Batini, C., Surendran, P., Jiang, T., et al. (2019) · Molecular Psychiatry · doi:10.1038/s41380-018-0313-0 · Cited by 126
De Novo Mutations in PDE10A Cause Childhood-Onset Chorea with Bilateral Striatal Lesions
Mencacci, N. E., Kamsteeg, E.-J., Nakashima, K., R’Bibo, L., Lynch, D. S., Balint, B., Willemsen, M. A. A. P., Adams, M. E., Wiethoff, S., Suzuki, K., et al. (2016) · The American Journal of Human Genetics · doi:10.1016/j.ajhg.2016.02.015 · Cited by 122
“0 ST arrays and brain tissue originating from 134 control individuals, collected by the Medical Research Council Sudden Death Brain and Tissue Bank and the SunHealth Research Institute, an affiliate of SunHealth Corporation.(20) This plot shows significant variation in PDE10A expression across the ten brain regions an…”
MethodResultSelf-citationGenome-wide association study of cerebral small vessel disease reveals established and novel loci
Chung, J., Marini, S., Pera, J., Norrving, B., Jiménez-Conde, J., Roquer, J., Fernández‐Cadenas, I., Tirschwell, D., Selim, M. H., Brown, D. L., et al. (2019) · Brain · doi:10.1093/brain/awz233 · Cited by 117
“eQTL) using the GTEx Portal (Consortium, 2015) and the Brain eQTL Almanac (Braineac) (Trabzuni et al., 2011).”
Truncating and Missense Mutations in IGHMBP2 Cause Charcot-Marie Tooth Disease Type 2
Cottenie, E., Kochański, A., Jordanova, A., Bánsági, B., Zimon, M., Horga, A., Jaunmuktane, Z., Saveri, P., Rašić, V. M., Baets, J., et al. (2014) · The American Journal of Human Genetics · doi:10.1016/j.ajhg.2014.10.002 · Cited by 113
“The mRNA expression of IGHMBP2 in six brain regions was assessed in humans during development.(42) After birth,”
Sousa, S. B., Jenkins, D., Chanudet, E., Tasseva, G., Ishida, M., Anderson, G., Docker, J., Ryten, M., Sa, J., Saraiva, J. M., et al. (2014) · Nature Genetics · doi:10.1038/ng.2829 · Cited by 115
Self-citationKrishnan, M. L., Van Steenwinckel, J., Schang, A.-L., Yan, J., Arnadottir, J., Le Charpentier, T., Csaba, Z., Dournaud, P., Cipriani, S., Auvynet, C., et al. (2017) · Nature Communications · doi:10.1038/s41467-017-00422-w · Cited by 105
A FreeSurfer view of the cortical transcriptome generated from the Allen Human Brain Atlas
French, L., & Paus, T. (2015) · Frontiers in Neuroscience · doi:10.3389/fnins.2015.00323 · Cited by 105
“To reduce the complexity of the Allen data, we have summarized the data into the Desikan– Killiany cortical atlas built into the FreeSurfer software for automatic labeling of regions of interest (Desikan et al., 2006).”
BackgroundMethodMutations in HPCA Cause Autosomal-Recessive Primary Isolated Dystonia
Charlesworth, G., Angelova, P. R., Bartolomé, F. B., Ryten, M., Trabzuni, D., Stamelou, M., Abramov, A. Y., Bhatia, K. P., & Wood, N. W. (2015) · The American Journal of Human Genetics · doi:10.1016/j.ajhg.2015.02.007 · Cited by 103
Self-citationThomas, A. C., Williams, H. J., Setó‐Salvia, N., Bacchelli, C., Jenkins, D., O’Sullivan, M. E., Mengrelis, K., Ishida, M., Ocaka, L., Chanudet, E., et al. (2014) · The American Journal of Human Genetics · doi:10.1016/j.ajhg.2014.10.007 · Cited by 105
“This was supported by data from both the human UK Brain Expression Consortium (UKBEC) and the Human Brain Transcriptome database.(34,35) SNX14 is expressed in all brain regions, with generally increasing levels during prenatal development and then plateauing.”
MethodSelf-citationYin, H., Pantazatos, S. P., Galfalvy, H., Huang, Y., Rosoklija, G. B., Dwork, A. J., Burke, A., Arango, V., Oquendo, M. A., & Mann, J. J. (2016) · American Journal of Medical Genetics Part B: Neuropsychiatric Genetics · doi:10.1002/ajmg.b.32423 · Cited by 91
ADCY5 mutations are another cause of benign hereditary chorea
Mencacci, N. E., Erro, R., Wiethoff, S., Hersheson, J., Ryten, M., Balint, B., Ganos, C., Stamelou, M., Quinn, N. P., Houlden, H., et al. (2015) · Neurology · doi:10.1212/wnl.0000000000001720 · Cited by 94
“Regional distribution of ADCY5 and NKX2-1 messenger RNA (mRNA) expression in the normal adult human brain was determined using microarray analysis of human postmortem brain tissue from the UK Human Brain Expression Consortium as previously described.(13) This dataset is based on exon array profiling of 1,231 samples f…”
MethodSelf-citationHypermethylation in the ZBTB20 gene is associated with major depressive disorder
Davies, M. N., Krause, L., Bell, J. T., Gao, F., Ward, K. J., Wu, H., Lu, H., Liu, Y., Tsai, P.-C., Collier, D. A., et al. (2014) · Genome biology · doi:10.1186/gb-2014-15-4-r56 · Cited by 98
“UK Brain Expression Consortium provided gene expression brain data.”
MethodInfluentialGenome-wide association study in essential tremor identifies three new loci
Müller, S. H., Girard, S. L., Hopfner, F., Merner, N. D., Bourassa, C. V., Lorenz, D., Clark, L. N., Tittmann, L., Soto-Ortolaza, A. I., Klebe, S., et al. (2016) · Brain · doi:10.1093/brain/aww242 · Cited by 88
“0008) in cerebellar cortex but not in other brain regions (Trabzuni et al., 2011) (Supplementary Fig.”
BackgroundInfluentialThe endocytic membrane trafficking pathway plays a major role in the risk of Parkinson's disease
Bandres‐Ciga, S., Saez‐Atienzar, S., Bonet‐Ponce, L., Billingsley, K., Vitale, D., Blauwendraat, C., Gibbs, J. R., Pihlstrøm, L., Gan‐Or, Z., The International Parkinson's Disease Genomics Consortium (IPDGC), et al. (2019) · Movement Disorders · doi:10.1002/mds.27614 · Cited by 90
Hancock, D. B., Reginsson, G. W., Gaddis, N. C., Chen, X., Saccone, N. L., Lutz, S. M., Qaiser, B., Sherva, R., Steinberg, S., Zink, F., et al. (2015) · Translational Psychiatry · doi:10.1038/tp.2015.149 · Cited by 85
Huang, Y., Skwarek‐Maruszewska, A., Horré, K., Vandewyer, E., Wolfs, L., Snellinx, A., Saito, T., Radaelli, E., Corthout, N., Colombelli, J., et al. (2015) · Science Translational Medicine · doi:10.1126/scitranslmed.aab3492 · Cited by 92
Self-citationde Vargas, D. M., Bastiani, M. A. D., Zimmer, E. R., & Klamt, F. (2018) · Alzheimer s Research & Therapy · doi:10.1186/s13195-018-0394-7 · Cited by 91
“Table 1 Gene expression microarray data used to infer human hippocampus transcriptional network and AD MR candidates GEO ID Description Samples (n) Reference GSE60862 Gene expression data of 10 regions of postmortem brains originating from 134 neurologically and neuropathologically normal Caucasian individuals Hippoca…”
BackgroundMethodInfluentialTranscriptomic signatures of brain regional vulnerability to Parkinson’s disease
Keo, A., Mahfouz, A. E., Ingrassia, A. M. T., Meneboo, J., Villenet, C., Mutez, E., Comptdaer, T., Lelieveldt, B. P. F., Figeac, M., Chartier‐Harlin, M., et al. (2020) · Communications Biology · doi:10.1038/s42003-020-0804-9 · Cited by 84
Parker, N., Patel, Y., Jackowski, A. P., Pan, P. M., Salum, G. A., Pausová, Z., & Paus, T. (2020) · JAMA Psychiatry · doi:10.1001/jamapsychiatry.2020.1495 · Cited by 87
White, K., Yang, P., Li, L., Farshori, A., Medina, A. E., & Zielke, H. R. (2018) · Biopreservation and Biobanking · doi:10.1089/bio.2017.0099 · Cited by 83
“As reported by others, shorter PMI values do not correlate with a high RIN value.(6,8,10,38) Indeed, neural tissue with a longer PMI may have high RIN values, indicating the overall tissue integrity even with longer death to freezing intervals.”
Ramasamy, A., Trabzuni, D., Gibbs, J. R., Dillman, A., Hernandez, D. G., Arepalli, S., WALKER, R. E., Smith, C., Ilori, G. P., Shabalin, A. A., et al. (2013) · Nucleic Acids Research · doi:10.1093/nar/gkt069 · Cited by 77
“Briefly, the Illumina HT12 data set consists of 304 individuals profiled by the North American Brain Expression Consortium (NABEC) (15–17), whereas the Affymetrix Human Exon data set consists of 134 individuals profiled by the UK Brain Expression Consortium (UKBEC) (18).”
MethodInfluentialSelf-citationGhosh, A., Mizuno, K., Tiwari, S. S., Proitsi, P., Gomez Perez-Nievas, B., Glennon, E., Martinez-Nunez, R. T., & Giese, K. P. (2020) · Translational Psychiatry · doi:10.1038/s41398-020-00882-7 · Cited by 78
PRRT2: from Paroxysmal Disorders to Regulation of Synaptic Function
Valtorta, F., Benfenati, F., Zara, F., & Meldolesi, J. (2016) · Trends in Neurosciences · doi:10.1016/j.tins.2016.08.005 · Cited by 78
Pergola, G., Carlo, P. D., D’Ambrosio, E., Gelao, B., Fazio, L., Papalino, M., Monda, A., Scozia, G., Pietrangelo, B., Attrotto, M. T., et al. (2017) · Translational Psychiatry · doi:10.1038/tp.2016.253 · Cited by 75
Advances in protein-protein interaction network analysis for Parkinson's disease
Tomkins, J. E., & Manzoni, C. (2021) · Neurobiology of Disease · doi:10.1016/j.nbd.2021.105395 · Cited by 78
“…splicing analysis with a combination of Coloc and transcriptome-wide association study (TWAS) analyses applied to expression data from Braineac (Ramasamy et al., 2014; Trabzuni et al., 2011), the Genotype-Tissue Expression (GTEx) portal (GTEx Consortium, 2013), and CommonMind (Dobbyn et al., 2018).”
Age-associated changes in gene expression in human brain and isolated neurons
Kumar, A., Gibbs, J. R., Beilina, A. G., Dillman, A., Kumaran, R., Trabzuni, D., Ryten, M., WALKER, R. E., Smith, C., Traynor, B. J., et al. (2012) · Neurobiology of Aging · doi:10.1016/j.neurobiolaging.2012.10.021 · Cited by 77
“These brain samples have previously been examined by microarrays [20,24], but on different platforms.”
BackgroundMethodInfluentialSelf-citationGenetic comorbidities in Parkinson's disease
Nalls, M. A., Saad, M., Noyce, A. J., Keller, M. F., Schrag, A. E., Bestwick, J., Traynor, B. J., Gibbs, J. R., Hernandez, D. G., Cookson, M., et al. (2013) · Human Molecular Genetics · doi:10.1093/hmg/ddt465 · Cited by 73
Self-citationUKBEC, Murthy, M. N., IPDGC, Blauwendraat, C., Guelfi, S., Hardy, J., Lewis, P. A., & Trabzuni, D. (2017) · Neurogenetics · doi:10.1007/s10048-017-0514-8 · Cited by 72
“12) using the Braineac microarray dataset [17]; a recent CAGEseq dataset [21]; GTEx Portal, which uses RNA sequence platform [22]; and NCBI’s Phenotype-Genotype Integrator (PheGenI) [6].”
Self-citationBrain expression of inflammatory mediators in Mesial Temporal Lobe Epilepsy patients
Leal, B., Chaves, J., Carvalho, C., Rangel, R., Santos, A., Bettencourt, A., Lopes, J., Ramalheira, J. E. P., da Silva, B. M., da Silva, A. M., et al. (2017) · Journal of Neuroimmunology · doi:10.1016/j.jneuroim.2017.10.014 · Cited by 72
MIR-NATs repress MAPT translation and aid proteostasis in neurodegeneration
Simone, R., Javad, F., Emmett, W., Wilkins, O. G., Almeida, F., Barahona‐Torres, N., Zarȩba-Pasławska, J., Ehteramyan, M., Zuccotti, P., Modelska, A., et al. (2021) · Nature · doi:10.1038/s41586-021-03556-6 · Cited by 70
Self-citationPrediction of Alzheimer's disease using multi-variants from a Chinese genome-wide association study
Jia, L., Li, F., Wei, C., Zhu, M., Qu, Q., Qin, W., Tang, Y., Shen, L., Wang, Y., Shen, L., et al. (2021) · Brain · doi:10.1093/brain/awaa364 · Cited by 67
“…presented by Ramasamy et al. (2014), COLOC analysis (http:// coloc.cs.ucl.ac.uk) (Giambartolomei et al. , 2014) using the brain-eQTL datasets (Trabzuni et al. , 2011; Ramasamy et al. , 2013), and summary Mendelian randomization-Heidi analysis (https://cnsgenomics.com/software/smr/) (Zhu et…”
Periyasamy, S., John, S., Padmavati, R., Rajendren, P., Thirunavukkarasu, P., Gratten, J., Vinkhuyzen, A. A. E., McRae, A. F., Holliday, E. G., Nyholt, D. R., et al. (2019) · JAMA Psychiatry · doi:10.1001/jamapsychiatry.2019.1335 · Cited by 65
Microglia recapitulate a hematopoietic master regulator network in the aging human frontal cortex
Wehrspaun, C. C., Haerty, W., & Ponting, C. P. (2015) · Neurobiology of Aging · doi:10.1016/j.neurobiolaging.2015.04.008 · Cited by 64
Transcriptomic and genetic analyses reveal potential causal drivers for intractable partial epilepsy
Guelfi, S., Botía, J. A., Thom, M., Ramasamy, A., Perona, M., Stanyer, L., Martinian, L., Trabzuni, D., Smith, C., WALKER, R. E., et al. (2019) · Brain · doi:10.1093/brain/awz074 · Cited by 60
Self-citationAssociation of a Schizophrenia-Risk Nonsynonymous Variant With Putamen Volume in Adolescents
Luo, Q., Chen, Q., Wang, W., Desrivières, S., Quinlan, E. B., Jia, T., Macare, C., Robert, G. H., Cui, J., Guedj, M., et al. (2019) · JAMA Psychiatry · doi:10.1001/jamapsychiatry.2018.4126 · Cited by 62
The Spectrum of PRRT2-Associated Disorders: Update on Clinical Features and Pathophysiology
Landolfi, A., Barone, P., & Erro, R. (2021) · Frontiers in Neurology · doi:10.3389/fneur.2021.629747 · Cited by 58
“The observed dissociation in terms of age at onset between the epilepsy and PKD phenotypes might in fact suggest an expression pattern shift across different brain regions during development (57).”
BackgroundFerrari, R., Forabosco, P., Vandrovcová, J., Botía, J. A., Guelfi, S., Warren, J. D., Momeni, P., Weale, M. E., Ryten, M., & Hardy, J. (2016) · Molecular Neurodegeneration · doi:10.1186/s13024-016-0085-4 · Cited by 57
“We assessed expression for FTD-genes in different brain areas by means of the Human Brain Atlas (HBA; [46]) and Braineac [47, 48].”
BackgroundMethodInfluentialSelf-citationInsights From Cerebellar Transcriptomic Analysis Into the Pathogenesis of Ataxia
Bettencourt, C., Ryten, M., Forabosco, P., Schorge, S., Hersheson, J., Hardy, J., & Houlden, H. (2014) · JAMA Neurology · doi:10.1001/jamaneurol.2014.756 · Cited by 57
Self-citationMok, K. Y., Schneider, S. A., Trabzuni, D., Stamelou, M., Edwards, M. J., Kasperavičiūtė, D., Pickering-Brown, S. M., Silverdale, M., Hardy, J., & Bhatia, K. P. (2013) · Movement Disorders · doi:10.1002/mds.25732 · Cited by 56
Self-citationThomas, R. S., Henson, A., Gerrish, A., Jones, L., Williams, J., & Kidd, E. J. (2016) · BMC Neuroscience · doi:10.1186/s12868-016-0288-1 · Cited by 55
“[31] eQTL dataset (150 healthy brains) and the UK Brain Expression Consortium eQTL dataset [32] (134 healthy brains) we found that the risk (major, G) allele of the most significant SNP in PICALM rs3851179 [2], and the risk allele (major, G) of the most significant SNP in PICALM from IGAP rs10792832 [4], are both asso…”
BackgroundMethodMarshe, V. S., Maciukiewicz, M., Rej, S., Tiwari, A. K., Sibille, E. L., Blumberger, D. M., Karp, J. F., Lenze, E. J., Reynolds, C. F., Kennedy, J. L., et al. (2017) · American Journal of Psychiatry · doi:10.1176/appi.ajp.2016.16050617 · Cited by 54
Bampton, A., Gatt, A. P., Humphrey, J., Cappelli, S., Bhattacharya, D., Foti, S. C., Brown, A., Asi, Y. T., Low, Y. H., Foiani, M., et al. (2021) · Acta Neuropathologica · doi:10.1007/s00401-021-02340-0 · Cited by 53
“HnRNP K is widely expressed in multiple brain regions [63, 64] and has been specifically implicated in the post-transcriptional regulation of genes essential for maintaining ATP levels during cellular stress [22], axogenesis [41], myelination [37] and synaptic plasticity [19].”
BackgroundRare variants in SQSTM1 and VCP genes and risk of sporadic inclusion body myositis
Gang, Q., Bettencourt, C., Machado, P. M., Brady, S., Holton, J. L., Pittman, A. M., Hughes, D., Healy, E., Parton, M., Hilton-Jones, D., et al. (2016) · Neurobiology of Aging · doi:10.1016/j.neurobiolaging.2016.07.024 · Cited by 51
“Total RNA was isolated from muscle tissue using the miRNeasy kit (Qiagen, Crawley, UK), and the concentration, purity, and integrity of each RNA sample were assessed as previously described (Trabzuni et al., 2011).”
MethodLorenzi, M., Altmann, A., Gutman, B. A., Wray, S., Arber, C., Hibar, D. P., Jahanshad, N., Schott, J. M., Alexander, D. C., Thompson, P. M., et al. (2018) · Proceedings of the National Academy of Sciences · doi:10.1073/pnas.1706100115 · Cited by 52
“org/) (19), facilitate the quantification of effects of SNPs on gene expression in numerous tissues, including various brain tissues.”
BackgroundPatani, R., Lewis, P. A., Trabzuni, D., Puddifoot, C. A., Wyllie, D. J. A., WALKER, R. E., Smith, C., Hardingham, G. E., Weale, M. E., Hardy, J., et al. (2012) · Journal of Neurochemistry · doi:10.1111/j.1471-4159.2012.07825.x · Cited by 52
Self-citationFine-Mapping, Gene Expression and Splicing Analysis of the Disease Associated LRRK2 Locus
Trabzuni, D., Ryten, M., Emmett, W., Ramasamy, A., Lackner, K. J., Zeller, T., WALKER, R. E., Smith, C., Lewis, P. A., Mamais, A., et al. (2013) · PLoS ONE · doi:10.1371/journal.pone.0070724 · Cited by 50
“Further details regarding sample processing for this section are reported in Trabzuni et al., 2011 [22].”
BackgroundMethodResultInfluentialSelf-citationRamasamy, A., Trabzuni, D., Forabosco, P., Smith, C., WALKER, R. E., Dillman, A., Sveinbjörnsdóttir, S., Hardy, J., Weale, M. E., & Ryten, M. (2013) · Multiple Sclerosis and Related Disorders · doi:10.1016/j.msard.2013.08.009 · Cited by 50
“Prior to use in eQTL analyses, the expression data was corrected for gender and batch effects (date of hybridization and brain bank or collection sites), as described previously (Trabzuni et al., 2011).”
InfluentialSelf-citationNovel C12orf65 mutations in patients with axonal neuropathy and optic atrophy
Tucci, A., Liu, Y., Preza, E., Pitceathly, R. D. S., Chalasani, A., Plagnol, V., Land, J. M., Trabzuni, D., Ryten, M., UKBEC, O. B. O., et al. (2013) · Journal of Neurology Neurosurgery & Psychiatry · doi:10.1136/jnnp-2013-306387 · Cited by 49
“12 A full description of the samples used and the methods of RNA isolation and processing can be found in Trabzuni et al , 13 and Trabzuni et al .”
MethodSelf-citationFerrari, R., Ryten, M., Simone, R., Trabzuni, D., Nicolaou, N., Hondhamuni, G., Ramasamy, A., Vandrovcová, J., Weale, M. E., Lees, A. J., et al. (2014) · Neurobiology of Aging · doi:10.1016/j.neurobiolaging.2014.01.010 · Cited by 44
“Further details regarding RNA isolation, quality control, and processing are reported in (Trabzuni et al., 2011).”
Self-citationWang, X., Campbell, M. R., Lacher, S. E., Cho, H.-Y., Wan, M., Crowl, C. L., Chorley, B. N., Bond, G. L., Kleeberger, S. R., Slattery, M., et al. (2016) · Cell Reports · doi:10.1016/j.celrep.2016.03.068 · Cited by 49
“Association of SNP genotype and MAPT expression The MAPT gene expression and SNP genotyping data were downloaded from the UK Brain Expression Consortium (UKBEC, http://www.braineac.org) (Ramasamy et al., 2014; Trabzuni et al., 2011).”
MethodPhysiological and Pathological Ageing of Astrocytes in the Human Brain
Verkerke, M., Hol, E. M., & Middeldorp, J. (2021) · Neurochemical Research · doi:10.1007/s11064-021-03256-7 · Cited by 51
Alterations in cholesterol metabolism–related genes in sporadic Alzheimer's disease
Picard, C., Julien, C., Frappier, J., Miron, J., Théroux, L., Dea, D., Breitner, J. C. S., & Poirier, J. (2018) · Neurobiology of Aging · doi:10.1016/j.neurobiolaging.2018.01.018 · Cited by 60
Limited predictability of postmortem human brain tissue quality by RNA integrity numbers
Sonntag, K., Tejada, G., Subburaju, S., Berretta, S., Benes, F. M., & Woo, T.-U. W. (2016) · Journal of Neurochemistry · doi:10.1111/jnc.13637 · Cited by 49
“A number of studies, including our own, have shown that good-quality RNA can be derived from postmortem human brain tissue and that samples with varying RINs can successfully be assessed using biochemical and molecular assays, such as microarrays, qPCR, or RNA-Seq (Gilbert et al. 1981; Sajdel-Sulkowska et al. 1988; Be…”
BackgroundMethodResultInfluentialMolecular mechanisms underlying noncoding risk variations in psychiatric genetic studies
Xiao, X., Chang, H., & Li, M. (2017) · Molecular Psychiatry · doi:10.1038/mp.2016.241 · Cited by 51
Lyu, Y., Zauhar, R. J., Dana, N., Strang, C. E., Hu, J., Wang, K., Liu, S., Pan, N., Gamlin, P. D., Kimble, J. A., et al. (2021) · Scientific Reports · doi:10.1038/s41598-021-95122-3 · Cited by 47
Gene expression in the Parkinson's disease brain
Lewis, P. A., & Cookson, M. (2011) · Brain Research Bulletin · doi:10.1016/j.brainresbull.2011.11.016 · Cited by 45
Wingo, A. P., Almli, L. M., Stevens, J. S., Jovanović, T., Wingo, T. S., Tharp, G. K., Li, Y., Lori, A., Briscione, M. A., Jin, P., et al. (2016) · Molecular Psychiatry · doi:10.1038/mp.2016.143 · Cited by 43
“Affymetrix GeneChip Human Exon 1.0 ST arrays were used to obtain whole transcriptome profiling 20 .”
InfluentialLongevity‐related molecular pathways are subject to midlife “switch” in humans
Timmons, J. A., Volmar, C., Crossland, H., Phillips, B. E., Sood, S., Janczura, K. J., Törmäkangas, T., Kujala, U. M., Kraus, W. E., Atherton, P. J., et al. (2019) · Aging Cell · doi:10.1111/acel.12970 · Cited by 41
“For human brain, the only sufficiently sized older age‐range exon‐based dataset was from Hardy and colleagues (Trabzuni et al., 2011).”
BackgroundStudy, T. C. F. A. A., Bury, J. J., Chambers, A., Heath, P. R., Ince, P. G., Shaw, P. J., Matthews, F. E., Brayne, C., Simpson, J. E., & Wharton, S. B. (2021) · Acta Neuropathologica Communications · doi:10.1186/s40478-020-01109-y · Cited by 44
Multi-omic insights into Parkinson's Disease: From genetic associations to functional mechanisms
Schilder, B. M., Navarro, E., & Raj, T. (2021) · Neurobiology of Disease · doi:10.1016/j.nbd.2021.105580 · Cited by 45
Initial Assessment of the Pathogenic Mechanisms of the Recently Identified Alzheimer Risk Loci
Holton, P., Ryten, M., Nalls, M., Trabzuni, D., Weale, M. E., Hernandez, D., Crehan, H., Gibbs, J. R., Mayeux, R., Haines, J. L., et al. (2013) · Annals of Human Genetics · doi:10.1111/ahg.12000 · Cited by 48
“Human post-mortem brain tissue collection and mRNA extraction A detailed description of the samples used in the study, tissue processing and dissection is provided in Trabzuni et al. (2011).”
Self-citationPergola, G., Carlo, P. D., Jaffe, A. E., Papalino, M., Chen, Q., Hyde, T. M., Kleinman, J. E., Shin, J. H., Rampino, A., Blasi, G., et al. (2019) · Biological Psychiatry · doi:10.1016/j.biopsych.2019.03.981 · Cited by 36
Metadata
- Authors
- Trabzuni, D., Ryten, M., Walker, R., Smith, C., Imran, S., Ramasamy, A., Weale, M. E., & Hardy, J.
- Affiliations
- UCL Queen Square Institute of Neurology (GB)
- University of Edinburgh (GB)
- Guy's Hospital (GB)
- Corresponding author
- Hardy, John
- ORCID
- Venue
- Journal of Neurochemistry
- Publisher
- Wiley
- Published
- 2011-09-20
- Volume
- 119
- Issue
- 2
- Pages
- 275-282
- ISSN
- 0022-3042 (ISSN-L)
- 1471-4159
- PMC
- PMC3664422
- OpenAlex
- W2066399252
- Cited by
- 229
- References
- 36
- Citations by year
- 2026: 5 · 2025: 7 · 2024: 4 · 2023: 10 · 2022: 10 · 2021: 22 · 2020: 13 · 2019: 24 · 2018: 23 · 2017: 25 · 2016: 24 · 2015: 20 · 2014: 16 · 2013: 14 · 2012: 9
- FWCI
- 5.45
- Type
- journal article
- Language
- en
- Open access
- green
- www.ncbi.nlm.nih.gov
- Locations
- Journal of Neurochemistry (publishedVersion)
- Europe PMC (PubMed Central) (publishedVersion, cc-by)
- PubMed Central (publishedVersion, cc-by)
- PubMed (publishedVersion)
- Research Portal (King's College London) (publishedVersion, other-oa)
- UCL Discovery (University College London) (submittedVersion)
- Edinburgh Research Explorer (University of Edinburgh) (submittedVersion, other-oa)
- Funders
- Wellcome Trust (089698)
- King Faisal Specialist Hospital and Research Centre
- Medical Research Council (MC_G1000735)
- Army Research Office
- Topics
- Life Sciences › Biochemistry, Genetics and Molecular Biology › Molecular Biology › Molecular Biology Techniques and Applications
- Life Sciences › Biochemistry, Genetics and Molecular Biology › Molecular Biology › Gene expression and cancer classification
- Life Sciences › Biochemistry, Genetics and Molecular Biology › Molecular Biology › Single-cell and spatial transcriptomics
- Keywords
- postmortem delay, agonal state, brain age, RNA integrity number, brain pH
- MeSH terms
- Adolescent, Adult, Aged, Aging, Brain Chemistry, Cause of Death, Exons, Female, United Kingdom, Humans, Hydrogen-Ion Concentration, Male, Middle Aged, Quality Control, RNA, Sex Characteristics, Tissue Banks, United States, Reproducibility of Results, DNA, Complementary, Reverse Transcriptase Polymerase Chain Reaction, Oligonucleotide Array Sequence Analysis, Gene Expression Profiling, Databases, Genetic, Microarray Analysis, Young Adult
About these checks
Registry, retraction, Cites and statistics results are computed, not judged, with one exception: a printed reference that no index lists is read once by a model before it counts as a citation error. Claims are extracted by a model and kept only when their quote appears verbatim in the text; each cited source is then checked, with a model’s help, for whether it says what the claim relies on. Those verdicts can be wrong — read the claim’s quote and the cited source before relying on one.
Statistics and arithmetic are recomputed, not judged.
Confidence bands are shown only for fields calibrated on our annotated test set. None is calibrated yet, so no band is shown.
What counts as a claim ›How we measure confidence ›How we check this ›
Are you an author, or do you see a problem with this page? Request a review
