Cited by 48

The DOI matches its Crossref record; 6 of the 6 references it cites were found in a registry or an index.

The nuclear DICER–circular RNA complex drives the deregulation of the glioblastoma cell microRNAome

Bronisz, A., Rooj, A. K., Krawczyński, K., Peruzzi, P., Salińska, E., Nakano, I., Purow, B., Chiocca, E. A., Godlewski, J.·2020·Science Advances

Abstract

A novel circRNA withholds the microRNA assembly line by arresting the manufacturing foreman in the nucleus of a cancer cell.

Overview

The claims and statistics of this paper haven’t been checked yet.

Run the check — free, no account needed. It reads the open-access text and checks the sources it cites.

A few free checks a day · papers already verified open instantly · results are public

Integrity signals

Registry

Crossref · 10.1126/sciadv.abc0221

Cites

6 of 6 references verified0 citation errors · 0 not checkable

Statistics

Figures

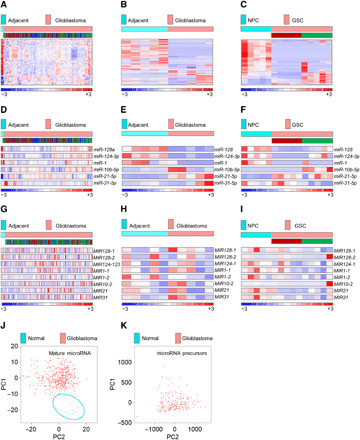
Fig. 1 Mature, but not precursor, microRNAome is suppressed in glioblastomas and GSCs. (A) Mature microRNAome in patients with glioblastoma (n = 490) versus healthy individuals (n = 11), based on 535 microRNAs in the TCGA database. The subtype identity: red, mesenchymal; blue, classical; green, proneural. (B and C) Mature microRNAome in glioblastoma tissue versus adjacent, nonpathological brain (n = 5 each) (B), and in GSCs (n = 5 per subtype) versus NPCs (n = 5) (C) based on 581 and 605 of 799 microRNAs by nCounter NanoString platform. GSC’s subtype identity is shown (red, mesenchymal; green, proneural). (D) Selected mature microRNAs in patients with glioblastoma (n = 490) versus healthy individuals (n = 11), based on the TCGA database. For the subtype identity, see (A). (E and F) Selected mature microRNAs in glioblastoma tissue versus adjacent, nonpathological brain (n = 5 each) (E), and in GSCs (n = 5 per subtype) versus NPCs (n = 5) (F), based on nCounter NanoString platform. For GSC’s subtype identity, see (B) and (C). (G) Selected microRNA precursors in patients with glioblastoma (n = 195) versus healthy individuals (n = 10), based on the TCGA database. For the subtype identity, see (A). (H and I) Selected microRNA precursors in glioblastoma tissue versus adjacent, nonpathological brain (n = 5 each) (H), and in GSCs (n = 5 per subtype) versus NPCs (n = 5) (I), based on custom NanoString precursor platform. For GSC’s subtype identity, see (B) and (C). (J and K) Mature microRNAome but not microRNA precursors distinguish between patients with glioblastoma and healthy individuals. PCA of mature (J) and precursors (K) microRNA in patients with glioblastoma (red dots, n = 490 and n = 205) versus healthy individuals (blue dots, n = 10) [(J) and (K), respectively].
Fig. 1 Mature, but not precursor, microRNAome is suppressed in glioblastomas and GSCs. (A) Mature microRNAome in patients with glioblastoma (n = 490) versus healthy individuals (n = 11), based on 535 microRNAs in the TCGA database. The subtype identity: red, mesenchymal; blue, classical; green, proneural. (B and C) Mature microRNAome in glioblastoma tissue versus adjacent, nonpathological brain (n = 5 each) (B), and in GSCs (n = 5 per subtype) versus NPCs (n = 5) (C) based on 581 and 605 of 799 microRNAs by nCounter NanoString platform. GSC’s subtype identity is shown (red, mesenchymal; green, proneural). (D) Selected mature microRNAs in patients with glioblastoma (n = 490) versus healthy individuals (n = 11), based on the TCGA database. For the subtype identity, see (A). (E and F) Selected mature microRNAs in glioblastoma tissue versus adjacent, nonpathological brain (n = 5 each) (E), and in GSCs (n = 5 per subtype) versus NPCs (n = 5) (F), based on nCounter NanoString platform. For GSC’s subtype identity, see (B) and (C). (G) Selected microRNA precursors in patients with glioblastoma (n = 195) versus healthy individuals (n = 10), based on the TCGA database. For the subtype identity, see (A). (H and I) Selected microRNA precursors in glioblastoma tissue versus adjacent, nonpathological brain (n = 5 each) (H), and in GSCs (n = 5 per subtype) versus NPCs (n = 5) (I), based on custom NanoString precursor platform. For GSC’s subtype identity, see (B) and (C). (J and K) Mature microRNAome but not microRNA precursors distinguish between patients with glioblastoma and healthy individuals. PCA of mature (J) and precursors (K) microRNA in patients with glioblastoma (red dots, n = 490 and n = 205) versus healthy individuals (blue dots, n = 10) [(J) and (K), respectively].CC BY-NC · PubMed Central
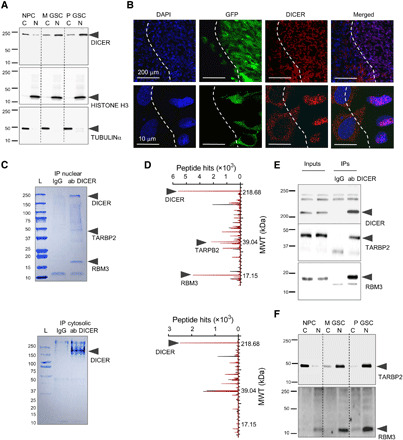
Fig. 2 DICER is retained in the nucleus of GSCs, forming a complex with RBM3 protein. (A) Representative Western blotting of DICER in cytosolic (C) and nuclear (N) fractions from NPCs and GSCs. (B) Representative images of GFP-positive M GSC–originated intracranial xenograft sections 10 days after implantation with DAPI (blue), GFP (green), and DICER immunohistochemistry (red) are shown, and white dashed line denotes approximate boundary between xenograft and the brain. (C and D) Representative Coomassie blue staining (C) and mass spectroscopy peaks of DICER-associated proteins (D) using GSC nuclear (top) and cytosolic (bottom) extract IP with either IgG (black peaks) or DICER antibodies (red peaks) (n = 3). Molecular weight (MWT) in kDa is indicated. (E) Representative Western blots of nuclear lysate inputs and IP obtained by IgG and DICER antibodies. (F) Representative Western blotting of cytosolic (C) and nuclear (N) fractions from NPCs and GSCs. Loading and fraction purity controls are shown in (A).
Fig. 2 DICER is retained in the nucleus of GSCs, forming a complex with RBM3 protein. (A) Representative Western blotting of DICER in cytosolic (C) and nuclear (N) fractions from NPCs and GSCs. (B) Representative images of GFP-positive M GSC–originated intracranial xenograft sections 10 days after implantation with DAPI (blue), GFP (green), and DICER immunohistochemistry (red) are shown, and white dashed line denotes approximate boundary between xenograft and the brain. (C and D) Representative Coomassie blue staining (C) and mass spectroscopy peaks of DICER-associated proteins (D) using GSC nuclear (top) and cytosolic (bottom) extract IP with either IgG (black peaks) or DICER antibodies (red peaks) (n = 3). Molecular weight (MWT) in kDa is indicated. (E) Representative Western blots of nuclear lysate inputs and IP obtained by IgG and DICER antibodies. (F) Representative Western blotting of cytosolic (C) and nuclear (N) fractions from NPCs and GSCs. Loading and fraction purity controls are shown in (A).CC BY-NC · PubMed Central
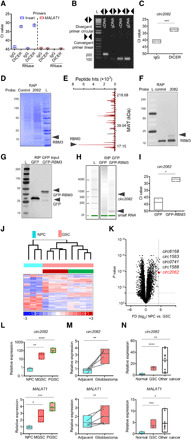
Fig. 3 DICER/RBM3 forms complex with circ2082. (A) RIP of nuclear lysates with DICER antibodies followed by RNA isolation, RNase treatment, and qPCR (n = 3) using indicated primers. (B) Agarose gel of PCR products using cDNA or genomic DNA (gDNA) and indicated primers. (C) RIP of nuclear extracts from GSC using IgG and DICER antibodies, qPCR analysis with means ± SD. (D to F) Coomassie blue staining (D), mass spectroscopy peaks of circ2082-associated proteins (E), and Western blot (F) using GSC protein extracts upon RAP with control or anti-circ2082 probes (n = 3). (G to I) RIP of lysates from GSC transfected with GFP or GFP-RBM3 vector. Protein inputs analyzed by Western blot (G), RNA profile by Agilent Bioanalyzer (H), and circ2082 enrichment in RIP by qPCR with means ± SD (I). (J) Heatmap with a hierarchical clustering for NPCs (n = 3) and GSCs (n = 4 per subtype), (n = 1270 of 12,659 detectable, P < 0.05). Subtype identity: red, mesenchymal; green, proneural. (K) Volcano plot for NPCs (n = 3) and GSCs (n = 10) and the top five most up-regulated circRNAs. Dashed lines indicate P value and fold cutoffs. (L to N) qPCR analysis of circ2082 (top) and linear MALAT1 (bottom) with means ± SD in NPCs versus M GSCs (50.1- and 2.5-fold, respectively) and NPCs versus P GSCs (150.2- and 3.8-fold, respectively) (n = 4 per group) (L); adjacent brain versus glioblastoma (2.3- and 1.4-fold paired, respectively), matching lines identify pairs (n = 5) (M); and NPCs versus GSCs (12.8- and 3.9-fold, respectively), and NPC versus other cancers (27.1- and 4.6-fold, respectively) (nonmalignant cells, n = 6; GSCs, n = 3 per subtype; other cancers, n = 9) (N); P values: *P < 0.05, **P < 0.01, ***P < 0.001, and ****P < 0.0001.
Fig. 3 DICER/RBM3 forms complex with circ2082. (A) RIP of nuclear lysates with DICER antibodies followed by RNA isolation, RNase treatment, and qPCR (n = 3) using indicated primers. (B) Agarose gel of PCR products using cDNA or genomic DNA (gDNA) and indicated primers. (C) RIP of nuclear extracts from GSC using IgG and DICER antibodies, qPCR analysis with means ± SD. (D to F) Coomassie blue staining (D), mass spectroscopy peaks of circ2082-associated proteins (E), and Western blot (F) using GSC protein extracts upon RAP with control or anti-circ2082 probes (n = 3). (G to I) RIP of lysates from GSC transfected with GFP or GFP-RBM3 vector. Protein inputs analyzed by Western blot (G), RNA profile by Agilent Bioanalyzer (H), and circ2082 enrichment in RIP by qPCR with means ± SD (I). (J) Heatmap with a hierarchical clustering for NPCs (n = 3) and GSCs (n = 4 per subtype), (n = 1270 of 12,659 detectable, P < 0.05). Subtype identity: red, mesenchymal; green, proneural. (K) Volcano plot for NPCs (n = 3) and GSCs (n = 10) and the top five most up-regulated circRNAs. Dashed lines indicate P value and fold cutoffs. (L to N) qPCR analysis of circ2082 (top) and linear MALAT1 (bottom) with means ± SD in NPCs versus M GSCs (50.1- and 2.5-fold, respectively) and NPCs versus P GSCs (150.2- and 3.8-fold, respectively) (n = 4 per group) (L); adjacent brain versus glioblastoma (2.3- and 1.4-fold paired, respectively), matching lines identify pairs (n = 5) (M); and NPCs versus GSCs (12.8- and 3.9-fold, respectively), and NPC versus other cancers (27.1- and 4.6-fold, respectively) (nonmalignant cells, n = 6; GSCs, n = 3 per subtype; other cancers, n = 9) (N); P values: *P < 0.05, **P < 0.01, ***P < 0.001, and ****P < 0.0001.CC BY-NC · PubMed Central
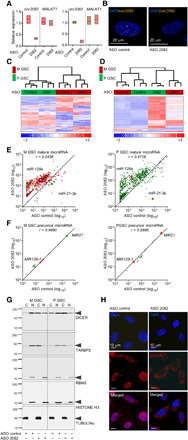
Fig. 4 The knockdown of circ2082 results in a widespread derepression of GSC microRNAome. (A) qPCR analysis for circ2082 or linear MALAT1 in GSCs with means ± SD. GSC (green, proneural; red, mesenchymal; n = 3 per subtype) were transfected with ASO control or circ2082. (B) Representative FISH images of the circ2082 in GSC transfected with ASO control or circ2082 with a fluorescently labeled junction probe and nuclei stained with DAPI (n = 4). (C) Heatmap with a hierarchical clustering for GSCs transfected with ASO control or circ2082 (n = 3 each subtype) based on the most variable mRNA transcripts (n = 3740 of 31,555, P < 0.05). GSC’s subtype identity: red, mesenchymal; green, proneural. (D) Heatmap with an unsupervised hierarchical clustering for GSCs transfected with ASO control or circ2082 (n = 3 per subtype) based on levels of 756 mature microRNAs. GSC’s subtype identity: red, mesenchymal; green, proneural. (E) Scatterplots for GSCs (M GSC: red, left; P GSC: green, right) transfected with ASO control or circ2082 (n = 3 each) based on levels of 756 mature microRNAs. (F) Scatterplots for GSCs (M GSC: red, left; P GSC: green, right) transfected with ASO control or circ2082 (n = 3 each) based on levels of 22 precursor. (G) Representative Western blotting of cytosolic (C) and nuclear (N) fractions of GSCs (n = 4) transfected with ASO control or circ2082. (H) Representative images of cultured GSC (n = 3) transfected with ASO control or circ2082. DAPI staining (blue) and DICER immunohistochemistry staining (red) analysis were performed.
Fig. 4 The knockdown of circ2082 results in a widespread derepression of GSC microRNAome. (A) qPCR analysis for circ2082 or linear MALAT1 in GSCs with means ± SD. GSC (green, proneural; red, mesenchymal; n = 3 per subtype) were transfected with ASO control or circ2082. (B) Representative FISH images of the circ2082 in GSC transfected with ASO control or circ2082 with a fluorescently labeled junction probe and nuclei stained with DAPI (n = 4). (C) Heatmap with a hierarchical clustering for GSCs transfected with ASO control or circ2082 (n = 3 each subtype) based on the most variable mRNA transcripts (n = 3740 of 31,555, P < 0.05). GSC’s subtype identity: red, mesenchymal; green, proneural. (D) Heatmap with an unsupervised hierarchical clustering for GSCs transfected with ASO control or circ2082 (n = 3 per subtype) based on levels of 756 mature microRNAs. GSC’s subtype identity: red, mesenchymal; green, proneural. (E) Scatterplots for GSCs (M GSC: red, left; P GSC: green, right) transfected with ASO control or circ2082 (n = 3 each) based on levels of 756 mature microRNAs. (F) Scatterplots for GSCs (M GSC: red, left; P GSC: green, right) transfected with ASO control or circ2082 (n = 3 each) based on levels of 22 precursor. (G) Representative Western blotting of cytosolic (C) and nuclear (N) fractions of GSCs (n = 4) transfected with ASO control or circ2082. (H) Representative images of cultured GSC (n = 3) transfected with ASO control or circ2082. DAPI staining (blue) and DICER immunohistochemistry staining (red) analysis were performed.CC BY-NC · PubMed Central
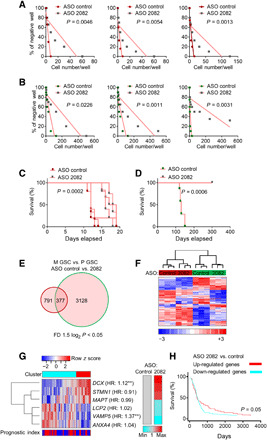
Fig. 5 The knockdown of circ2082 mitigates tumorigenicity of GSCs. (A and B) Representative sphere frequency assays using linear regression plot. GSCs (n = 3 per subtype) were transfected with ASO control or circ2082. P values are indicated. (C and D) Kaplan-Meier curves of mice intracranially injected (n = 5 per group) with GSCs (red, mesenchymal; green, proneural) transfected with ASO control or circ2082. P values are indicated. (E and F) GeneVenn analysis (E) and heatmap with hierarchical clustering (F) for GSCs transfected with ASO control or circ2082 (n = 3 per subtype) based on the most variable mRNA transcripts in both subtypes (n = 377 of the total 31,555), fold difference (FD) 1.5 log2, and P < 0.05 are shown. GSC’s subtype identity: red, mesenchymal; green, proneural. (G) Heatmap of the most varied genes (n = 6) in GSC with circ2082 knockdown with color annotations according to profile similarity and prognostic index stratification cluster based on TCGA database (left) and average relative expression based on qPCR analysis (n = 3) as a color bar (right). Molecule names are annotated with hazard ratios (HR) from Cox analysis; **, hazard ratios (HRs) with P ≤ 0.05. (H) Kaplan-Meier curve survival analysis based on six gene signatures in the TCGA database stratified according to their cluster membership [see (G)].
Fig. 5 The knockdown of circ2082 mitigates tumorigenicity of GSCs. (A and B) Representative sphere frequency assays using linear regression plot. GSCs (n = 3 per subtype) were transfected with ASO control or circ2082. P values are indicated. (C and D) Kaplan-Meier curves of mice intracranially injected (n = 5 per group) with GSCs (red, mesenchymal; green, proneural) transfected with ASO control or circ2082. P values are indicated. (E and F) GeneVenn analysis (E) and heatmap with hierarchical clustering (F) for GSCs transfected with ASO control or circ2082 (n = 3 per subtype) based on the most variable mRNA transcripts in both subtypes (n = 377 of the total 31,555), fold difference (FD) 1.5 log2, and P < 0.05 are shown. GSC’s subtype identity: red, mesenchymal; green, proneural. (G) Heatmap of the most varied genes (n = 6) in GSC with circ2082 knockdown with color annotations according to profile similarity and prognostic index stratification cluster based on TCGA database (left) and average relative expression based on qPCR analysis (n = 3) as a color bar (right). Molecule names are annotated with hazard ratios (HR) from Cox analysis; **, hazard ratios (HRs) with P ≤ 0.05. (H) Kaplan-Meier curve survival analysis based on six gene signatures in the TCGA database stratified according to their cluster membership [see (G)].CC BY-NC · PubMed Central
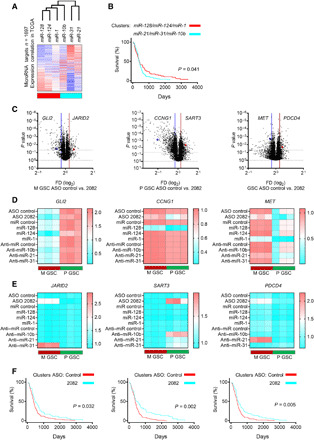
Fig. 6 The circ2082-dependent footprint is mediated via the rearrangements of the microRNAome. (A) Heatmap displaying the clustering of expression correlation of genes (n = 1697) and selected microRNAs using the TCGA database. The correlation value (blue, negative and red, positive) and annotations of profile similarity (bottom bar) are shown. (B) Kaplan-Meier curve survival analysis based on genes associated with six microRNA in the TCGA database and stratified according to their cluster membership [see (A)]. (C) Volcano plots of genes [n = 1697, see (A)] for M GSCs (n = 3, left), P GSCs (n = 3, middle), and all GSCs (n = 6, right) transfected with ASO control or circ2082 are shown. The selected deregulated targets are shown. Lines indicate a P value and fold difference cutoffs. (D and E) qPCR analysis for indicated mRNAs upon the treatment by ASO circ2082 or tumor-suppressive microRNAs (D) and ASO circ2082 or oncogenic anti-microRNAs (E) in GSCs (n = 3 per subtype). (F) Kaplan-Meier curve survival analysis using TCGA database and stratified according to their cluster membership (see fig. S6, D to F) after circ2082 knockdown in M GSCs (left), P GSCs (middle), and all GSCs (right).
Fig. 6 The circ2082-dependent footprint is mediated via the rearrangements of the microRNAome. (A) Heatmap displaying the clustering of expression correlation of genes (n = 1697) and selected microRNAs using the TCGA database. The correlation value (blue, negative and red, positive) and annotations of profile similarity (bottom bar) are shown. (B) Kaplan-Meier curve survival analysis based on genes associated with six microRNA in the TCGA database and stratified according to their cluster membership [see (A)]. (C) Volcano plots of genes [n = 1697, see (A)] for M GSCs (n = 3, left), P GSCs (n = 3, middle), and all GSCs (n = 6, right) transfected with ASO control or circ2082 are shown. The selected deregulated targets are shown. Lines indicate a P value and fold difference cutoffs. (D and E) qPCR analysis for indicated mRNAs upon the treatment by ASO circ2082 or tumor-suppressive microRNAs (D) and ASO circ2082 or oncogenic anti-microRNAs (E) in GSCs (n = 3 per subtype). (F) Kaplan-Meier curve survival analysis using TCGA database and stratified according to their cluster membership (see fig. S6, D to F) after circ2082 knockdown in M GSCs (left), P GSCs (middle), and all GSCs (right).CC BY-NC · PubMed Central

Verification

Claims the paper makes

The claims and statistics of this paper haven’t been checked yet.

Run the check — free, no account needed. It reads the open-access text and checks the sources it cites.

A few free checks a day · papers already verified open instantly · results are public

Claims other papers make about this one

Each is checked against this paper’s own text: does it say what the citing paper says it does?

Self-check

Percentages, sums and reported differences re-computed from the paper’s own numbers.

The self-check needs the paper’s full text.

Citations

Cites

Show all 6 references

Research works printed but not linked: 46

  1. 10.1093/nar/gkz097 · DOI · Paper page
  2. 10.1016/j.cell.2013.03.043 · DOI · Paper page
  3. 10.1016/S0092-8674(03)01018-3 · DOI · Paper page
  4. 10.1038/nature09092 · DOI · Paper page
  5. 10.1038/nature03702 · DOI
  6. 10.1007/978-3-030-14366-4_1 · DOI
  7. 10.1016/j.cell.2019.06.024 · DOI · Paper page
  8. 10.1073/pnas.1221478110 · DOI
  9. 10.1126/science.1254257 · DOI · Paper page
  10. 10.1016/j.celrep.2017.05.040 · DOI · Paper page
  11. 10.1016/j.ccell.2015.07.013 · DOI
  12. 10.1016/j.celrep.2016.05.018 · DOI
  13. 10.1016/j.cell.2018.05.022 · DOI
  14. 10.1038/nature11928 · DOI · Paper page
  15. 10.1038/nature11993 · DOI · Paper page
  16. 10.1038/onc.2017.361 · DOI
  17. 10.1186/1741-7015-6-14 · DOI · Paper page
  18. 10.1158/0008-5472.CAN-13-2650 · DOI · Paper page
  19. 10.1038/s41467-019-08390-z · DOI · Paper page
  20. 10.1016/j.stemcr.2017.04.024 · DOI
  21. 10.1093/nar/gkv328 · DOI
  22. 10.1371/journal.pone.0028446 · DOI
  23. 10.18632/oncotarget.14755 · DOI
  24. 10.1158/0008-5472.CAN-18-2170 · DOI
  25. 10.3892/ijo.2017.3946 · DOI
  26. 10.1016/j.yexcr.2013.07.031 · DOI
  27. 10.15252/emmm.201505495 · DOI
  28. 10.1186/1756-9966-27-85 · DOI
  29. 10.1038/nrc.2017.99 · DOI
  30. 10.1136/jclinpath-2011-200496 · DOI
  31. 10.1371/journal.pgen.1006095 · DOI
  32. 10.1038/s41580-018-0059-1 · DOI
  33. 10.1002/1878-0261.12468 · DOI
  34. M. Zhao, S. Wang, Q. Li, Q. Ji, P. Guo, X. Liu, MALAT1: A long non-coding RNA highly associated with human cancers. Oncol. Lett. 16, 19–26 (2018).
  35. 10.3390/ncrna5010025 · DOI
  36. 10.1016/j.celrep.2015.04.016 · DOI
  37. 10.1016/j.molcel.2010.02.018 · DOI
  38. 10.1007/978-1-4939-7562-4_6 · DOI
  39. 10.1158/0008-5472.CAN-08-2629 · DOI · Paper page
  40. 10.1073/pnas.1314085111 · DOI · Paper page
  41. 10.1038/nmeth.2089 · DOI · Paper page
  42. 10.1093/neuonc/now247 · DOI
  43. 10.1371/journal.pone.0101239 · DOI
  44. 10.5114/fn.2018.74657 · DOI
  45. 10.1016/j.molcel.2018.11.035 · DOI
  46. 10.1016/j.ccr.2009.12.020 · DOI · Paper page

Cited by

Sorted by citations

Metadata

Authors
Bronisz, A., Rooj, A. K., Krawczyński, K., Peruzzi, P., Salińska, E., Nakano, I., Purow, B., Chiocca, E. A., & Godlewski, J.
Affiliations
  • Department of Neurosurgery, Brigham and Women’s Hospital, Harvard Medical School, Boston, MA, USA.
  • Department of Neurochemistry, Mossakowski Medical Research Centre of Polish Academy of Sciences, Warsaw, Poland.
  • Department of Neurosurgery, University of Alabama, Birmingham, AL, USA.
  • Department of Neurology, University of Virginia, Charlottesville, VA, USA.
Venue
Science Advances
Published
2020-12-18
Volume
6
Issue
51
ISSN
2375-2548
Cited by
48
References
6
Language
en
Funders
  • National Cancer Institute (1R01 CA176203-01A1, R01NS11614)
  • National Science Center Poland (2018/29/B/NZ1/01016)

About these checks

Registry, retraction, Cites and statistics results are computed, not judged, with one exception: a printed reference that no index lists is read once by a model before it counts as a citation error. Claims are extracted by a model and kept only when their quote appears verbatim in the text; each cited source is then checked, with a model’s help, for whether it says what the claim relies on. Those verdicts can be wrong — read the claim’s quote and the cited source before relying on one.

Statistics and arithmetic are recomputed, not judged.

Confidence bands are shown only for fields calibrated on our annotated test set. None is calibrated yet, so no band is shown.

What counts as a claim ›How we measure confidence ›How we check this ›

Are you an author, or do you see a problem with this page? Request a review