

The DOI matches its Crossref record; 6 of the 6 references it cites were found in a registry or an index.
Structural basis for FLCN RagC GAP activation in MiT-TFE substrate-selective mTORC1 regulation
Abstract
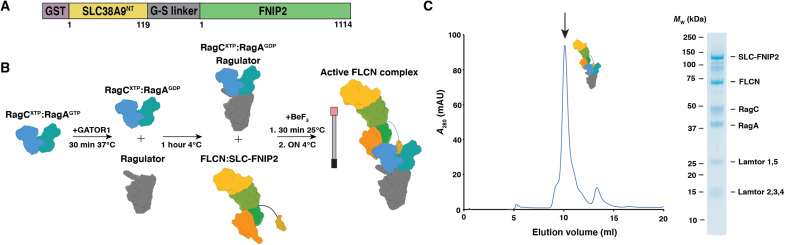
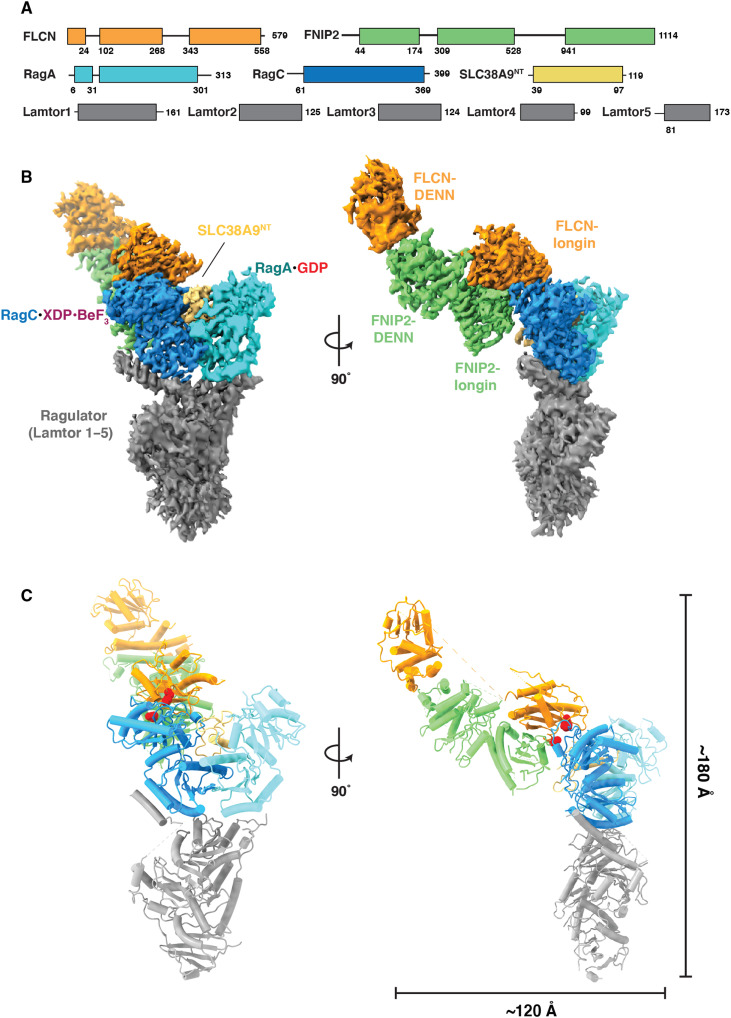
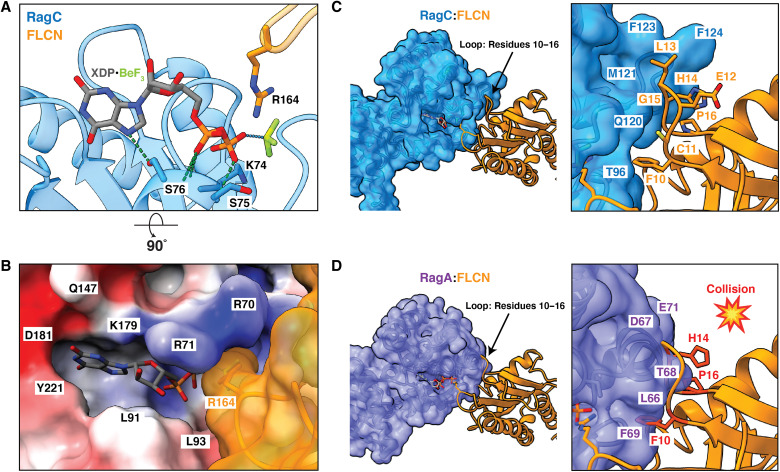
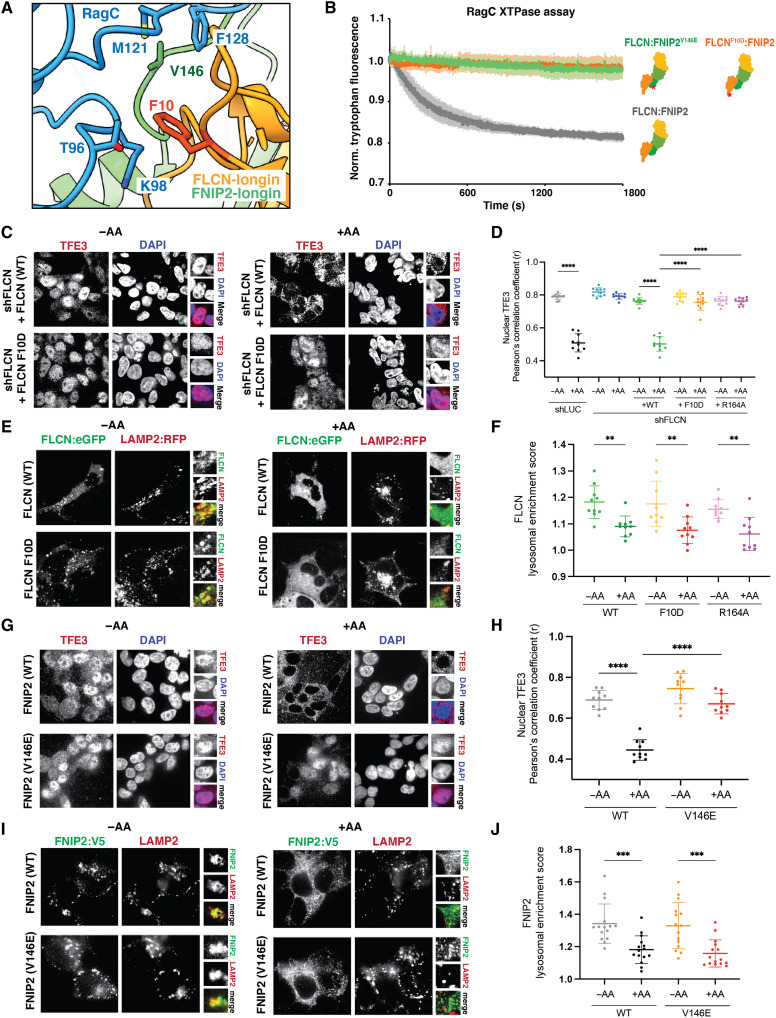
The mechanistic target of rapamycin complex 1 (mTORC1) regulates cell growth and catabolism in response to nutrients through phosphorylation of key substrates. The tumor suppressor folliculin (FLCN) is a RagC/D guanosine triphosphatase (GTPase)–activating protein (GAP) that regulates mTORC1 phosphorylation of MiT-TFE transcription factors, controlling lysosome biogenesis and autophagy. We determined the cryo–electron microscopy structure of the active FLCN complex (AFC) containing FLCN, FNIP2, the N-terminal tail of SLC38A9, the RagA GDP :RagC GDP.BeFx- GTPase dimer, and the Ragulator scaffold. Relative to the inactive lysosomal FLCN complex structure, FLCN reorients by 90°, breaks contact with RagA, and makes previously unseen contacts with RagC that position its Arg 164 finger for catalysis. Disruption of the AFC-specific interfaces of FLCN and FNIP2 with RagC eliminated GAP activity and led to nuclear retention of TFE3, with no effect on mTORC1 substrates S6K or 4E-BP1. The structure provides a basis for regulation of an mTORC1 substrate-specific pathway and a roadmap to discover MiT-TFE family selective mTORC1 antagonists.
Overview
The claims and statistics of this paper haven’t been checked yet.
Run the check — free, no account needed. It reads the open-access text and checks the sources it cites.
Integrity signals
Registry
Cites
Statistics
Figures
Verification
Claims the paper makes
The claims and statistics of this paper haven’t been checked yet.
Run the check — free, no account needed. It reads the open-access text and checks the sources it cites.
Claims other papers make about this one
Each is checked against this paper’s own text: does it say what the citing paper says it does?
The source backs part of the claim, not all of it — or backs it for a different population, condition or comparison.
In the citing paper
“The regulation of RagC and RagD is somewhat less well understood, but the FLCN complex has been shown to act as a GAP for these GTPases 174–177.”
From Targeting the biology of aging with mTOR inhibitors (2023) · cites this paper as [177]
Experimental — accuracy not yet measured
Self-check
Percentages, sums and reported differences re-computed from the paper’s own numbers.
The self-check needs the paper’s full text.
Citations
Cites
Sancak, Y., Bar-Peled, L., Zoncu, R., Markhard, A. L., Nada, S., & Sabatini, D. M. (2010) · Cell · doi:10.1016/j.cell.2010.02.024 · Cited by 2,464 · cited 2×
“The Rag-Ragulator complex consists of two Rag GTPases (commonly referred to as Rags) that function as obligate heterodimers and are anchored to the lysosomal membrane by the pentameric scaffold Ragulator ( 13 , 14 ).”
Self-citationBar-Peled, L., Chantranupong, L., Cherniack, A. D., Chen, W. W., Ottina, K. A., Grabiner, B. C., Spear, E. D., Carter, S. L., Meyerson, M., & Sabatini, D. M. (2013) · Science · doi:10.1126/science.1232044 · Cited by 1,080 · cited 1×
“Conversion between active and inactive states is regulated by the RagA/B-specific GAP, GAP activity towards Rags 1 (GATOR1), and by the RagC/D-specific GAP, FLCN:FLCN-interacting protein 2 (FNIP2) ( 16 , 17 ).”
The lysosome as a cellular centre for signalling, metabolism and quality control
Lawrence, R. E., & Zoncu, R. (2019) · Nature Cell Biology · doi:10.1038/s41556-018-0244-7 · Cited by 920
Self-citationSLC38A9 is a component of the lysosomal amino acid sensing machinery that controls mTORC1
Rebsamen, M., Pochini, L., Stasyk, T., de Araújo, M. E. G., Galluccio, M., Kandasamy, R. K., Snijder, B., Fauster, A., Rudashevskaya, E. L., Bruckner, M., et al. (2015) · Nature · doi:10.1038/nature14107 · Cited by 673
Recruitment of folliculin to lysosomes supports the amino acid–dependent activation of Rag GTPases
Petit, C. S., Roczniak-Ferguson, A., & Ferguson, S. M. (2013) · Journal of Cell Biology · doi:10.1083/jcb.201307084 · Cited by 355
Jeong, J.-H., Lee, K.-H., Kim, Y.-M., Kim, D.-H., Oh, B.-H., & Kim, Y.-G. (2012) · Journal of Biological Chemistry · doi:10.1074/jbc.c112.384420 · Cited by 68 · cited 1×
“3A) ( 26 , 27 ).”
Research works printed but not linked: 41
- 10.1016/j.cell.2017.02.004 · DOI · Paper page
- 10.1016/S0960-9822(03)00329-4 · DOI
- 10.1074/jbc.C200665200 · DOI
- 10.1126/science.1204592 · DOI · Paper page
- 10.1126/science.1174447 · DOI · Paper page
- 10.4161/auto.19653 · DOI · Paper page
- 10.1038/emboj.2012.32 · DOI · Paper page
- 10.1126/scisignal.2002790 · DOI
- 10.1038/s41586-020-2444-0 · DOI · Paper page
- 10.1126/science.aax0364 · DOI · Paper page
- 10.1101/gad.287953.116 · DOI
- 10.1074/jbc.M004389200 · DOI
- 10.1016/j.molcel.2017.09.026 · DOI · Paper page
- 10.1016/j.molcel.2013.09.016 · DOI · Paper page
- 10.1126/science.1257132 · DOI
- 10.1038/s41594-020-0490-9 · DOI
- 10.1371/journal.pbio.3001594 · DOI
- G. Napolitano, C. Di Malta, A. Ballabio, Non-canonical mTORC1 signaling at the lysosome. Trends Cell Biol. , S0962–S8924 (2022).
- 10.1016/j.cell.2019.10.036 · DOI
- 10.1021/bi00028a004 · DOI
- 10.1126/science.aax3939 · DOI · Paper page
- 10.1038/embor.2012.211 · DOI
- 10.1073/pnas.1214431110 · DOI
- 10.1093/nar/gky473 · DOI · Paper page
- 10.1038/s41467-021-24081-0 · DOI
- 10.1038/s41586-020-2633-x · DOI
- 10.1074/jbc.AC119.007382 · DOI
- 10.1016/j.molcel.2022.03.002 · DOI
- 10.1038/s41467-021-24499-6 · DOI
- 10.1126/sciadv.abj2485 · DOI · Paper page
- 10.1126/science.abf8271 · DOI
- 10.1038/s41598-021-99958-7 · DOI
- 10.1016/j.jsb.2005.07.007 · DOI
- 10.1016/j.jsb.2012.09.006 · DOI · Paper page
- 10.1038/nmeth.4193 · DOI
- 10.1038/nmeth.4169 · DOI · Paper page
- 10.1002/jcc.20084 · DOI
- 10.1107/S0907444910007493 · DOI · Paper page
- 10.1107/S2059798318002425 · DOI
- 10.1002/pro.3330 · DOI · Paper page
- 10.1111/j.1365-2818.2006.01706.x · DOI
Cited by
Sorted by citations
Targeting the biology of aging with mTOR inhibitors
Mannick, J. B., & Lamming, D. W. (2023) · Nature Aging · doi:10.1038/s43587-023-00416-y · Cited by 372
Structure of the endosomal Commander complex linked to Ritscher-Schinzel syndrome
Healy, M. D., McNally, K. E., Butkovič, R., Chilton, M., Kato, K., Sacharz, J., McConville, C., Moody, E. R. R., Shaw, S., Planelles-Herrero, V. J., et al. (2023) · Cell · doi:10.1016/j.cell.2023.04.003 · Cited by 91
Metadata
- Authors
- Jansen, R. M., Peruzzo, R., Fromm, S. A., Yokom, A. L., Zoncu, R., & Hurley, J. H.
- Affiliations
- Department of Molecular and Cell Biology, University of California, Berkeley, Berkeley, CA 94720, USA.
- Venue
- Science Advances
- Published
- 2022-09-16
- Volume
- 8
- Issue
- 37
- ISSN
- 2375-2548
- PMC
- PMC9473554
- Cited by
- 42
- References
- 6
- Language
- en
About these checks
Registry, retraction, Cites and statistics results are computed, not judged, with one exception: a printed reference that no index lists is read once by a model before it counts as a citation error. Claims are extracted by a model and kept only when their quote appears verbatim in the text; each cited source is then checked, with a model’s help, for whether it says what the claim relies on. Those verdicts can be wrong — read the claim’s quote and the cited source before relying on one.
Statistics and arithmetic are recomputed, not judged.
Confidence bands are shown only for fields calibrated on our annotated test set. None is calibrated yet, so no band is shown.
What counts as a claim ›How we measure confidence ›How we check this ›
Are you an author, or do you see a problem with this page? Request a review
