

A 2D Quantum Walk Simulation of Two-Particle Dynamics
Open accessThe DOI matches its Crossref record; 31 of the 33 references it cites were found in a registry or an index; none of the 25 sources its claims cite is checked for support yet.
Abstract
Here, There, Everywhere: Random walks are a powerful mathematical method that can be used to simulate certain processes in biology, chemistry, or even the stock market. They present a statistical method for mapping the possible routes that processes can take. Quantum walks are expected to be able to probe multiple paths simultaneously. Quantum walks have been demonstrated for one-dimensional, or straight-line, walks. Now, Schreiber et al. (p. 55 , published online 8 March) demonstrate an optical system that can simulate quantum walks over a two-dimensional system, thereby providing the capability of describing much more complex processes.
Overview
CoChat Summary
TL;DR
The paper reports a flexible 2D optical quantum walk on a fiber network, realizing a coherent walk over 12 steps and 169 positions. It uses the 2D lattice to simulate two-particle dynamics, including controlled interactions, bipartite entanglement, and bound-molecule-like behavior.
Key findings
- A 2D quantum walk was implemented over 12 steps and 169 positions using an optical fiber network, with separable and controlled coin operations.
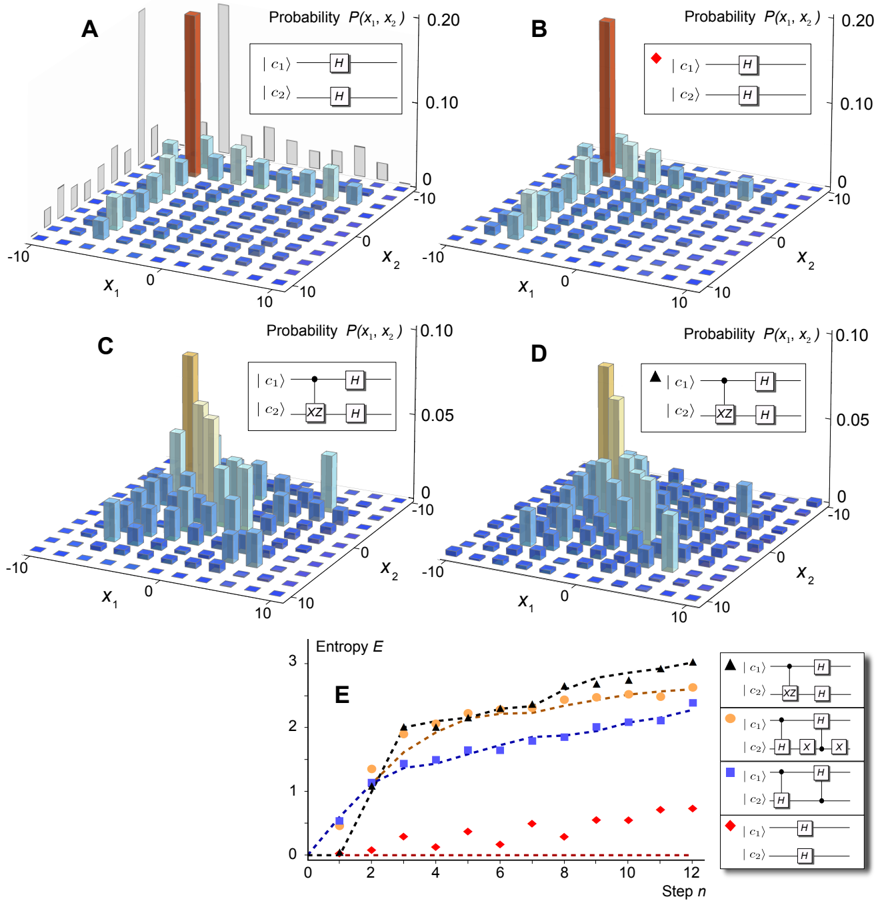
- For a 10-step Hadamard walk across 121 positions, measured similarity to theory was \(S = 0.957 \pm 0.003\); with controlling gates, \(S = 0.903 \pm 0.018\).
- Controlled operations produced simulated bipartite entanglement with a lower-bound von Neumann entropy of \(E = 2.63 \pm 0.01\) after 12 steps, stated as 56% of the maximal entropy.
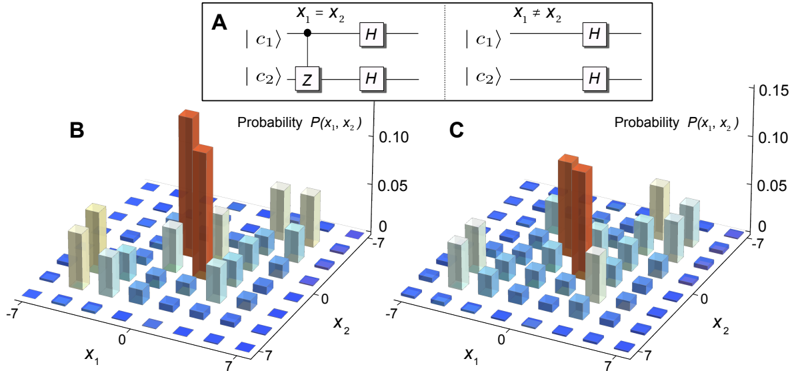
- A diagonal nonlinear coin simulated a bound molecule state: \(\sum_x P(x,x) = 0.317 \pm 0.006\) versus \(0.242 \pm 0.001\) for the Hadamard walk, with measured similarity \(S = 0.957 \pm 0.013\) after seven steps.
Methods
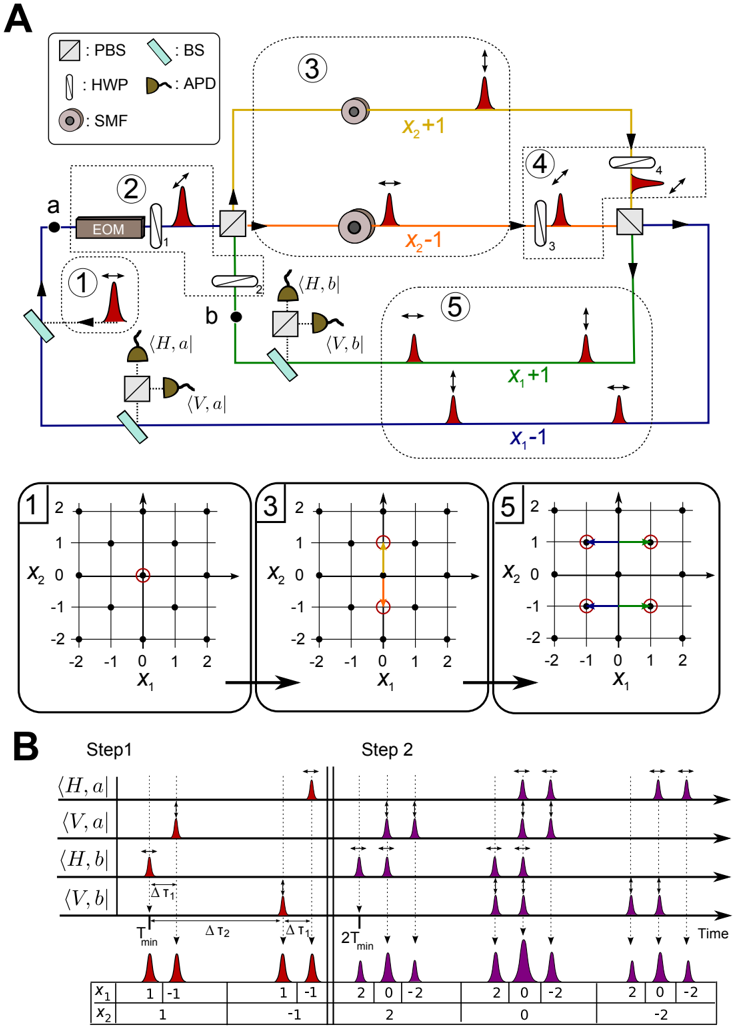
- Time-multiplexed optical setup using attenuated laser pulses from a pulsed diode laser (88 ps, 805 nm, 110 kHz), with coin states encoded in polarization and spatial modes and manipulated by HWPs, PBSs, and an EOM.
- Each round trip implemented one step; temporal delays were \(\Delta\tau_1 = 3.11\) ns and \(\Delta\tau_2 = 46.42\) ns, with minimum round-trip time \(T_{\min} = 676\) ns; detection used time-resolving single-photon counting modules/APDs.
- Analysis reconstructed output photostatistics and compared to theory via similarity \(S\); entanglement was quantified by von Neumann entropy assuming pure final states, with phases reconstructed from interference patterns and chosen to minimize entropy for a lower bound.
Limitations
- The paper states the EOM is the most significant systematic error: it affects the vertical polarization component with a factor \(1/3.5\) and distorts wavefronts differently for both polarizations, reducing achievable similarities.
- The paper states losses per step are the main scalability limit; adding the EOM for dynamic control limited the step number to \(n = 7\) due to higher losses, and temporal-overlap constraints required \(\Delta\tau_2 > 13 \cdot \Delta\tau_1\) and \(T_{\min} > 13 \cdot \Delta\tau_2\) for the first 12 steps.
- The paper states the entanglement values are lower bounds because phase information is not directly extractable, leaving three undetermined relative phases between coin states plus a global phase; it also notes the experiment uses an entirely classical light source to simulate quantum features.
Model-written summary. Check it against the paper before relying on it.
Integrity signals
Registry
Cites
Statistics
Figures

Verification
Claims the paper makes
0 Valid · 2 Not valid · 13 Not checked · 41 Own results and interpretations
A result the paper reports from its own data — it cites no other source for it, so there is none to check. The quote shows it is in the paper.
In the paper
“With our broad spectrum of quantum coins we were able to simulate the creation of entanglement in bipartite systems with conditioned interactions.”
plainstates a cause- Asserted: passes — The authors put it forward as true.
- Checkable: passes — It can be checked against evidence.
- Load-bearing: passes — The paper’s conclusions depend on it.
- Based: passes — The paper gives a reason why it holds.
A result the paper reports from its own data — it cites no other source for it, so there is none to check. The quote shows it is in the paper.
In the paper
“We realized a coherent quantum walk over 12 steps and 169 positions using an optical fiber network.”
plain- Asserted: passes — The authors put it forward as true.
- Checkable: passes — It can be checked against evidence.
- Load-bearing: passes — The paper’s conclusions depend on it.
- Based: passes — The paper gives a reason why it holds.
A result the paper reports from its own data — it cites no other source for it, so there is none to check. The quote shows it is in the paper.
In the paper
“For the Hadamard walk (Fig. 2A+B) we observe S = 0 . 957 ± 0 . 003, and for the quantum walk with controlling gates (Fig. 2C+D) S = 0 . 903 ± 0 . 018 (after 10 steps, across 121 positions).”
plain- Asserted: passes — The authors put it forward as true.
- Checkable: passes — It can be checked against evidence.
- Load-bearing: passes — The paper’s conclusions depend on it.
- Based: passes — The paper gives a reason why it holds.
A result the paper reports from its own data — it cites no other source for it, so there is none to check. The quote shows it is in the paper.
In the paper
“In Fig. 2E we show a lower bound for the simulated entanglement between the two particles during the stepwise evolution with four different coin operations.”
plain- Asserted: passes — The authors put it forward as true.
- Checkable: passes — It can be checked against evidence.
- Load-bearing: passes — The paper’s conclusions depend on it.
- Based: passes — The paper gives a reason why it holds.
- Rests on an assumption not shown here.
A result the paper states — it cites no source for it, so there is none to check. The quote shows it is in the paper.
In the paper
“We demonstrated that, with a physical resource overhead, a classical experiment can simulate many genuine quantum features.”
boostedstates a cause- Asserted: passes — The authors put it forward as true.
- Checkable: passes — It can be checked against evidence.
- Load-bearing: passes — The paper’s conclusions depend on it.
- Based: passes — The paper gives a reason why it holds.
29 more claims
Create a free account to see all 56 claims and to verify the 2 references still open.
- Probably not a substantial claim. 12
- It may state two separate claims as one. 14
Claims other papers make about this one
Each is checked against this paper’s own text: does it say what the citing paper says it does?
The cited source says what the claim attributes to it.
In the citing paper
“An additional physical dimension in the network can, in principle, entail the degrees of freedom offered by two walkers on a 1D-network [22,24,25].”
From Quantum Walks of Correlated Photon Pairs in Two-Dimensional Waveguide Arrays (2014) · cites this paper as [22]
The cited source says what the claim attributes to it.
In the citing paper
“A current limitation of our approach is that the walk evolution cannot be position-dependent (that is, OAM-dependent), in contrast to other implementations (9, 23).”
From Quantum walks and wavepacket dynamics on a lattice with twisted photons (2015) · cites this paper as [23]
Self-check
Percentages, sums and reported differences re-computed from the paper’s own numbers.
Each contradiction between two passages listed here was confirmed by an independent check.
Rated minor: it would not touch a result — a value no result rests on, a p-value that stays on the same side of the significance level, or a conflict that is clerical, resolved elsewhere in the paper, or outside its own findings.
In the paper
§ Appendix 2: Quantum walk implementation via time-multiplexing · p. 8
“T min + ∆ τ 1 stating position | 1 , -1 〉 , T min + ∆ τ 2 ( | -1 , 1 〉 )”
§ A 2D Quantum Walk Simulation of Two-Particle Dynamics · p. 2
“Each step consists of a shift in both x 1 direction, corresponding to a time difference of ∆ τ 1 = 3 . 11ns, and x 2 direction with ∆ τ 2 = 46 . 42ns.”
Citations
Cites
Experimental realization of any discrete unitary operator
Reck, M., Zeilinger, A., Bernstein, H. J., & Bertani, P. (1994) · Physical Review Letters · doi:10.1103/physrevlett.73.58 · Cited by 2,155
Aharonov, Y., Davidovich, L., & Zagury, N. (1993) · Physical Review A · doi:10.1103/physreva.48.1687 · Cited by 1,622
Environment-assisted quantum walks in photosynthetic energy transfer
Mohseni, M., Rebentrost, P., Lloyd, S., & Aspuru-Guzik, A. (2008) · The Journal of Chemical Physics · doi:10.1063/1.3002335 · Cited by 1,189
Quantum random-walk search algorithm
Shenvi, N., Kempe, J., & Whaley, K. B. (2003) · Physical Review A · doi:10.1103/physreva.67.052307 · Cited by 1,150
Universal Computation by Quantum Walk
Childs, A. M. (2009) · Physical Review Letters · doi:10.1103/physrevlett.102.180501 · Cited by 1,002
Dephasing-assisted transport: quantum networks and biomolecules
Plenio, M. B., & Huelga, S. F. (2008) · New Journal of Physics · doi:10.1088/1367-2630/10/11/113019 · Cited by 1,002
Quantum Walks of Correlated Photons
Peruzzo, A., Lobino, M., Matthews, J. C. F., Matsuda, N., Politi, A., Poulios, K., Zhou, X.-Q., Lahini, Y., Ismail, N., Wörhoff, K., et al. (2010) · Science · doi:10.1126/science.1193515 · Cited by 929
Quantum Walk in Position Space with Single Optically Trapped Atoms
Karski, M., Förster, L., Choi, J.-M., Steffen, A., Alt, W., Meschede, D., & Widera, A. (2009) · Science · doi:10.1126/science.1174436 · Cited by 659
Photons Walking the Line: A Quantum Walk with Adjustable Coin Operations
Schreiber, A., Cassemiro, K. N., Potoček, V., Gábris, A., Mosley, P. J., Andersson, E., Jex, I., & Silberhorn, C. (2010) · Physical Review Letters · doi:10.1103/physrevlett.104.050502 · Cited by 588
Self-citationTwo-Particle Bosonic-Fermionic Quantum Walk via Integrated Photonics
Sansoni, L., Sciarrino, F., Vallone, G., Mataloni, P., Crespi, A., Ramponi, R., & Osellame, R. (2012) · Physical Review Letters · doi:10.1103/physrevlett.108.010502 · Cited by 578
Research works printed but not linked: 6
- D. Aharonov, A. Ambainis, J. Kempe, U. Vazirani, in Proceedings of the Thirty-Third Annual ACM Symposium on Theory of Computing , STOC '01, Hersonissos, Greece, 6 to 8 July 2001 (ACM, New York, NY, USA, 2001), pp. 50-59.
- A. Ahlbrecht, et al. , arxiv: quant-ph/1105.1051 (2011).
- A. M. Childs, et al. , in Proceedings of the thirty-fifth ACM symposium on Theory of computing - STOC '03 (San Diego, CA, USA, 2003), p. 59.
- A. Ambainis, J. Kempe, A. Rivosh, in Proceedings of the Sixteenth ACM-SIAM Symposium on Discrete Algorithms , SODA '05, Vancouver, Canada, 23 to 25 January 2005 (Society for Industrial and Applied Mathematics, Philadelphia, 2005), p. 1099-1108.
- J. C. F. Matthews, et al. , arxiv: quant-ph/1106.1166 (2011).
- Y. Lahini, et al. , arxiv: quant-ph/1105.2273 (2011).
Cited by
Items 401–425 of 425
Marches quantiques et mécanique quantique relativiste
Forets, M. (2015) · theses.fr (ABES) · doi:10.70675/f216f111z2ef6z4bf5z8cd1z593aacf8e8ce
“This subject was pursued further in [BW11, ŠBK11, LZG13], and physically implemented in [SGR12].”
Nonlinearity‐Induced Enhancement of Entanglement in Quantum Walk
Ye, B., & Fei, S. (2024) · Advanced Quantum Technologies · doi:10.1002/qute.202400099
Quantum walks on a network based on a dual Sierpinski gasket and a dendrimer
Batalha, G. M., & Galiceanu, M. D. (2025) · Physical Review A · doi:10.1103/v78n-y49t
Topological quantum walk immersed in synthetic non-Abelian gauge fields
Pang, Z., Abdelghani, O., Soljacic, M., & Yang, Y. (2025) · Conference on Lasers and Electro-Optics · doi:10.1364/cleo_fs.2025.ff139_5
Asapanna, R., Hainaut, C., Amo, A., & Gómez-León, Á. (2026) · Physical Review A · doi:10.1103/dxjw-bmng
Xue, P. (2025) · Elsevier eBooks · doi:10.1016/b978-0-443-33965-3.00003-1
Extended Poster Abstract: Graph Matching Trotterization for CTQW Circuit Simulation
Atallah, M., Dilley, D., Gaidai, I., Gonzales, A., Saleem, Z. H., & Herrman, R. (2025) · IEEE International Conference on Quantum Computing and Engineering (QCE) · doi:10.1109/qce65121.2025.10442
“…quantum walks (CTQWs) represent a powerful computational paradigm that has demonstrated quantum advantages across numerous applications including spatial search [1], [2], element distinctness with exponential speedups [3], optimization [4], quantum simulation [5], and state preparation [6].”
Geib, T. (2022) · Institutional Repository of Leibniz Universität Hannover (Leibniz Universität Hannover) · doi:10.15488/11931 · Cited by 1
An Optical Reservoir Computing Design based on Two-Dimensional Quantum Walk
Wang, Y., Ding, Y., Chen, Y., Long, Y., Tang, M., & Wang, C. (2025) · Asia Communications and Photonics Conference · doi:10.1109/acp66871.2025.11349917
“Moreover, optical high-dimensional quantum walk can usually be implemented by bulk optics with time-multiplexing structures [14] or integrated photonics [15].”
Non-cascade random walks in solid-state high harmonic generation
Zuo, Z., Wang, Y., Pan, S., Han, L., Xu, Y., Wu, D., Jiang, S., & Wu, J. (2026) · Nature Communications · doi:10.1038/s41467-026-69668-7
Quantum-driven sampling of the almost-uniform distribution via quantum walks
Radaelli, M., Benedetti, C., & Olivares, S. (2026) · New Journal of Physics · doi:10.1088/1367-2630/ae4820 · Cited by 1
The Convergence of Quantum Computing and Artificial Intelligence
Tank, N. (2026) · Advances in computational intelligence and robotics book series · doi:10.4018/979-8-3373-7779-7.ch004
Quantum walks of photons in disordered media
Defienne, H. (2015) · theses.fr (ABES) · doi:10.70675/0e85da43z5815z4df3z9a8aze657713c561f · Cited by 5
Quantum walks : background geometry and gauge invariance
Márquez-Martín, I. (2019) · theses.fr (ABES) · doi:10.70675/8d7024f3z592fz4cb1z9f10z46474a4e0721
Marches quantiques sous champ magnétique et cages d’Aharonov-Bohm
Perrin, H. (2021) · theses.fr (ABES) · doi:10.70675/a7c32d2bz9caaz4ec0z8380z92fc4da9d335
Two-dimensional topological properties of photonic mesh lattices subject to discrete step walks
Sokhen, R. E. (2024) · theses.fr (ABES) · doi:10.70675/64dde291z69a6z4a6az8c7bz448d4922bf48
Exploration of localization physics with atomic, molecular, and optical platforms
Gao, J., Li, H., Zwiller, V., & Elshaari, A. W. (2026) · Journal of Physics Condensed Matter · doi:10.1088/1361-648x/ae6aee · Cited by 1
Enhancing delocalization and entanglement in asymmetric discrete-time quantum walks
Zhao, H., He, Q., Yang, F., Kong, C., Cao, H., Yan, T., Zhong, B., Tian, K., WANG, J., Shan, C., et al. (2026) · Optics Express · doi:10.1364/oe.586985
Global topological protection of entanglement in integrated photonic quantum walks
Anonymous, Plotnik, Y., Palatnik, A., Lyubarov, M. D., Segal, O., Oz, Y., & Segev, M. (2026) · Physical Review Research · doi:10.1103/3nkp-m3w3
Ghasemi, S. H. (2026) · Physical review. E · doi:10.1103/s6mj-4f1s
Non-Hermitian Topological Beam Splitting and Beam Encoding
Anonymous, Wang, S., Yan, Y., Tianhan, Z., Jia, X., & Shen, H. (2026) · Physical Review Letters · doi:10.1103/wk1c-gfk6
Engineering Dirac points with hybrid photonic synthetic dimensions in a cavity
Yang, M., Wei, X.-H., Luo, X.-W., Xu, J., Li, C., & Guo, G. (2026) · Science Advances · doi:10.1126/sciadv.aef2406
Tunable two-dimensional energy orbital angular momentum synthetic lattices with free electrons
Anonymous, Jiang, Y., Wen, W., Anonymous, & Liu, Y. (2026) · Physical Review Research · doi:10.1103/rpst-tkh7
Photonic entanglement : new sources and new applications
Svozilík, J. (2014) · UPCommons institutional repository (Universitat Politècnica de Catalunya) · doi:10.5821/dissertation-2117-95525
Two-Dimensional Quantum Walk of Correlated Photons
Jiao, Z.-Q., Gao, J., Zhou, W.-H., Wang, X.-W., Ren, R.-J., Xu, X.-Y., Qiao, L.-F., & Jin, X.-M. (2020) · arXiv · doi:10.48550/arxiv.2007.06554
“[30] A.”
Method
Metadata
- Authors
- Schreiber, A., Gábris, A., Rohde, P. P., Laiho, K., Štefaňák, M., Potoček, V., Hamilton, C., Jex, I., & Silberhorn, C.
- Affiliations
- Paderborn University (DE)
- HUN-REN Wigner Research Centre for Physics (HU)
- Czech Technical University in Prague (CZ)
- Corresponding author
- Schreiber, Andreas
- ORCID
- Venue
- Science
- Published
- 2012-04-06
- Volume
- 336
- Issue
- 6077
- Pages
- 55-58
- ISSN
- 0036-8075 (ISSN-L)
- 1095-9203
- OpenAlex
- W1999799374
- Cited by
- 425
- References
- 31
- Citations by year
- 2026: 20 · 2025: 18 · 2024: 27 · 2023: 21 · 2022: 30 · 2021: 21 · 2020: 30 · 2019: 41 · 2018: 39 · 2017: 30 · 2016: 38 · 2015: 33 · 2014: 39 · 2013: 27 · 2012: 10
- FWCI
- 34.33
- Type
- journal article
- Language
- en
- Open access
- green
- arxiv.org
- Locations
- Science (publishedVersion)
- PubMed (publishedVersion)
- arXiv (Cornell University) (submittedVersion)
- ENLIGHTEN (Jurnal Bimbingan dan Konseling Islam) (submittedVersion)
- UTS ePRESS (University of Technology Sydney) (submittedVersion)
- MPG.PuRe (Max Planck Society) (submittedVersion)
- arXiv (Cornell University)
- Topics
- Physical Sciences › Computer Science › Artificial Intelligence › Quantum Computing Algorithms and Architecture
- Physical Sciences › Physics and Astronomy › Atomic and Molecular Physics, and Optics › Quantum Information and Cryptography
- Physical Sciences › Physics and Astronomy › Atomic and Molecular Physics, and Optics › Quantum Mechanics and Applications
- Keywords
- quantum walks, two-dimensional quantum walk, optical fiber communication, quantum coin, entanglement generation, bipartite entanglement, two-body scattering, nonlinear quantum dynamics, quantum simulation, topological structure
About these checks
Registry, retraction, Cites and statistics results are computed, not judged, with one exception: a printed reference that no index lists is read once by a model before it counts as a citation error. Claims are extracted by a model and kept only when their quote appears verbatim in the text; each cited source is then checked, with a model’s help, for whether it says what the claim relies on. Those verdicts can be wrong — read the claim’s quote and the cited source before relying on one.
A language model drew the claims from the paper on 2026-11-10, under version 3 of the claim definition (model deepseek-v4.1-flash, prompt extract-v3).
A second model labelled each claim on 2026-11-10 (model jev-1.13-20260917, definition revision gold-guideline-v0.2).
Statistics and arithmetic are recomputed, not judged.
Confidence bands are shown only for fields calibrated on our annotated test set. None is calibrated yet, so no band is shown.
What counts as a claim ›How we measure confidence ›How we check this ›
Are you an author, or do you see a problem with this page? Request a review
Data sources
Bibliographic data: Semantic Scholar, OpenAlex, Crossref.
Contains information from the Semantic Scholar Academic Graph Datasets, made available under the ODC Attribution License (ODC-BY 1.0).
Semantic Scholar’s data is described in: Kinney, R., et al. (2023). The Semantic Scholar Open Data Platform. arXiv:2301.10140.
