Cited by 340

The DOI matches its Crossref record; 21 of the 21 references it cites were found in a registry or an index.

Mapping the developing human immune system across organs

Suo, Chenqu, Dann, Emma, Goh, Issac, Jardine, Laura, Kleshchevnikov, Vitalii, Park, Jong-Eun, Botting, Rachel A., Stephenson, Emily, Engelbert, Justin, Tuong, Zewen Kelvin, Polanski, Krzysztof, Yayon, Nadav, Xu, Chuan, Suchanek, Ondrej, Elmentaite, Rasa, Domínguez Conde, Cecilia, He, Peng, Pritchard, Sophie, Miah, Mohi, Moldovan, Corina, Steemers, Alexander S., Mazin, Pavel, Prete, Martin, Horsfall, Dave, Marioni, John C., Clatworthy, Menna R., Haniffa, Muzlifah, Teichmann, Sarah A.·2022·Science

Published version of a preprint

Abstract

Single-cell genomics studies have decoded the immune cell composition of several human prenatal organs but were limited in describing the developing immune system as a distributed network across tissues. We profiled nine prenatal tissues combining single-cell RNA sequencing, antigen-receptor sequencing, and spatial transcriptomics to reconstruct the developing human immune system. This revealed the late acquisition of immune-effector functions by myeloid and lymphoid cell subsets and the maturation of monocytes and T cells before peripheral tissue seeding. Moreover, we uncovered system-wide blood and immune cell development beyond primary hematopoietic organs, characterized human prenatal B1 cells, and shed light on the origin of unconventional T cells. Our atlas provides both valuable data resources and biological insights that will facilitate cell engineering, regenerative medicine, and disease understanding.

Overview

The claims and statistics of this paper haven’t been checked yet.

Run the check — free, no account needed. It reads the open-access text and checks the sources it cites.

A few free checks a day · papers already verified open instantly · results are public

Integrity signals

Registry

Crossref · 10.1126/science.abo0510

Cites

21 of 21 references verified0 citation errors · 0 not checkable

Statistics

Figures

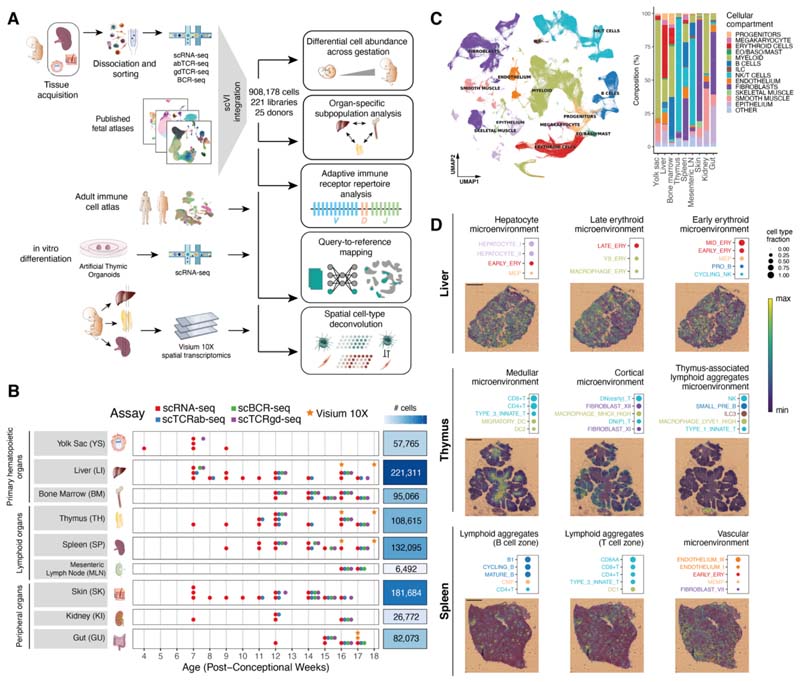
Fig. 1 Cross-tissue cellular atlas of the developing human immune system. (A) Overview of study design and analysis pipeline. We generated scRNA-seq and scVDJ-seq data from prenatal spleen, yolk sac and skin which were integrated via scVI with a collection of publicly available single-cell RNA-seq datasets. This cell atlas was used for (i) differential abundance analysis across gestation and organs with Milo, (ii) antigen receptor repertoire analysis with scirpy and dandelion, (iii) comparison with adult immune cells and in vitro differentiated cells with scArches and CellTypist, and (iv) spatial cell type deconvolution on Visium 10X data of hematopoietic and lymphoid organs using cell2location. (B) Summary of analyzed samples by gestational stage (x-axis) and organ (y-axis). Colors denote the types of molecular assays performed for each sample. The side bar indicates the total number of cells collected for each organ (after quality control). (C) Left: UMAP embedding of scRNA-seq profiles in prenatal tissues (908,178 cells) colored by broad cellular compartments. Right: bar plot of percentage of cells assigned to each broad compartment for each of the profiled organs. Raw cell proportions are adjusted to account for FACS-based CD45 enrichment. The category “Other” denotes clusters annotated as low-quality cells. (Eo/Baso/Mast: eosinophils/basophils/mast cells; ILC: innate lymphoid cells; NK: natural killer cells). (D) Representative colocalization patterns identified with non-negative matrix factorization of spatial cell type abundances estimated with cell2location. For each annotated microenvironment, we show (top) a dot plot of relative contribution of cell types to microenvironment (dot size) and (bottom) spatial locations of microenvironments on tissue slides, with the color representing the weighted contribution of each microenvironment to each spot. Each scale bar indicates a length of 1 mm.
Fig. 1 Cross-tissue cellular atlas of the developing human immune system. (A) Overview of study design and analysis pipeline. We generated scRNA-seq and scVDJ-seq data from prenatal spleen, yolk sac and skin which were integrated via scVI with a collection of publicly available single-cell RNA-seq datasets. This cell atlas was used for (i) differential abundance analysis across gestation and organs with Milo, (ii) antigen receptor repertoire analysis with scirpy and dandelion, (iii) comparison with adult immune cells and in vitro differentiated cells with scArches and CellTypist, and (iv) spatial cell type deconvolution on Visium 10X data of hematopoietic and lymphoid organs using cell2location. (B) Summary of analyzed samples by gestational stage (x-axis) and organ (y-axis). Colors denote the types of molecular assays performed for each sample. The side bar indicates the total number of cells collected for each organ (after quality control). (C) Left: UMAP embedding of scRNA-seq profiles in prenatal tissues (908,178 cells) colored by broad cellular compartments. Right: bar plot of percentage of cells assigned to each broad compartment for each of the profiled organs. Raw cell proportions are adjusted to account for FACS-based CD45 enrichment. The category “Other” denotes clusters annotated as low-quality cells. (Eo/Baso/Mast: eosinophils/basophils/mast cells; ILC: innate lymphoid cells; NK: natural killer cells). (D) Representative colocalization patterns identified with non-negative matrix factorization of spatial cell type abundances estimated with cell2location. For each annotated microenvironment, we show (top) a dot plot of relative contribution of cell types to microenvironment (dot size) and (bottom) spatial locations of microenvironments on tissue slides, with the color representing the weighted contribution of each microenvironment to each spot. Each scale bar indicates a length of 1 mm.CC BY · PubMed Central
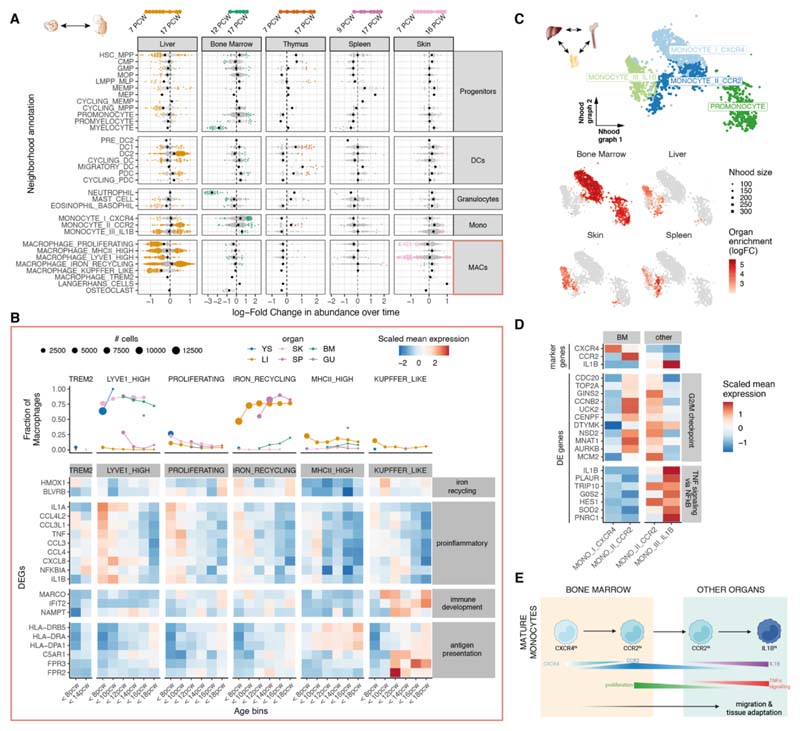
Fig. 2 Myeloid variation across time and tissues. (A) Beeswarm plot of log-fold change (x-axis) in cell abundance across gestational stages in Milo neighborhoods of myeloid cells. Results from five organs are shown. Neighborhoods overlapping the same cell population are grouped together (y-axis), and colored if displaying significant differential abundance (DA) (SpatialFDR 10%). The black dot denotes the median log-fold change. The top bar denotes the range of gestational stages of the organ samples analyzed. (B) Heat map of average expression across time of a selection of markers of stage-specific macrophage neighborhoods. Mean log-normalized expression for each gene is scaled (z-score). Gestational ages are grouped in 5 age bins. Age bins where less than 30 cells of a given subset were present are not shown. The top panel shows the fraction of all macrophages belonging to the specified macrophage population in each time point and each organ (color). (C) Close-up view of monocytes on Milo neighborhood embedding of myeloid cells (subset from fig. S16). Top: neighborhoods are colored by overlapping cell population. Bottom: neighborhoods displaying significant DA (SpatialFDR 10%) are colored by log-fold change in abundance between the specified organ and all other organs. (D) Mean expression of a selection of differentially expressed genes between CCR2hi monocytes from bone marrow and other organs. Log-normalized expression for each gene is scaled (z-score). We show genes upregulated in bone marrow associated with G2/M checkpoint and genes downregulated in bone marrow associated with TNF signaling (from MSigDB Hallmark 2020 gene sets). (E) Schematic of the proposed process of monocyte egression from the bone marrow mediated by CXCR4 and CCR2 expression: CXCR4hi monocytes are retained in the bone marrow, until they switch to a proliferative state with increased expression of CCR2, mediating tissue egression. CCR2hi monocytes seed peripheral tissues and then mature further to the periphery-specific IL1B expressing subtype.
Fig. 2 Myeloid variation across time and tissues. (A) Beeswarm plot of log-fold change (x-axis) in cell abundance across gestational stages in Milo neighborhoods of myeloid cells. Results from five organs are shown. Neighborhoods overlapping the same cell population are grouped together (y-axis), and colored if displaying significant differential abundance (DA) (SpatialFDR 10%). The black dot denotes the median log-fold change. The top bar denotes the range of gestational stages of the organ samples analyzed. (B) Heat map of average expression across time of a selection of markers of stage-specific macrophage neighborhoods. Mean log-normalized expression for each gene is scaled (z-score). Gestational ages are grouped in 5 age bins. Age bins where less than 30 cells of a given subset were present are not shown. The top panel shows the fraction of all macrophages belonging to the specified macrophage population in each time point and each organ (color). (C) Close-up view of monocytes on Milo neighborhood embedding of myeloid cells (subset from fig. S16). Top: neighborhoods are colored by overlapping cell population. Bottom: neighborhoods displaying significant DA (SpatialFDR 10%) are colored by log-fold change in abundance between the specified organ and all other organs. (D) Mean expression of a selection of differentially expressed genes between CCR2hi monocytes from bone marrow and other organs. Log-normalized expression for each gene is scaled (z-score). We show genes upregulated in bone marrow associated with G2/M checkpoint and genes downregulated in bone marrow associated with TNF signaling (from MSigDB Hallmark 2020 gene sets). (E) Schematic of the proposed process of monocyte egression from the bone marrow mediated by CXCR4 and CCR2 expression: CXCR4hi monocytes are retained in the bone marrow, until they switch to a proliferative state with increased expression of CCR2, mediating tissue egression. CCR2hi monocytes seed peripheral tissues and then mature further to the periphery-specific IL1B expressing subtype.CC BY · PubMed Central
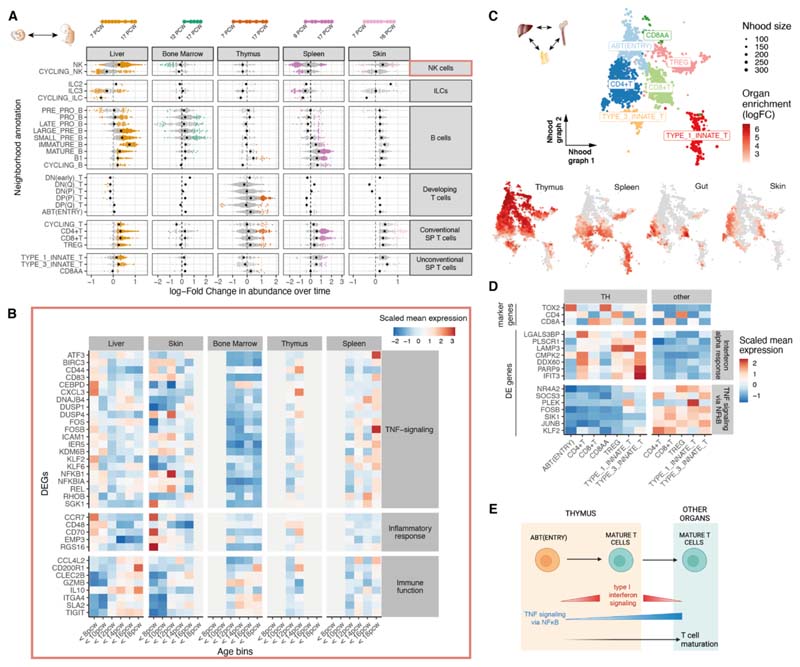
Fig. 3 Lymphoid variation across time and tissues. (A) Beeswarm plot of log-fold change (x-axis) in cell abundance across gestational stages in Milo neighborhoods of lymphoid cells (as in fig. 2A). (B) Heat map showing average expression across time of a selection of genes identified as markers of early-specific and late-specific NK neighborhoods (as in fig. 2B): NK cells identified in liver and skin before 12 pcw express TNF proinflammatory genes, whereas expression of immune-effector genes such as cytokines, chemokines and granzyme genes increases after 12 pcw. Age bins where less than 30 NK cells were present in a given organ are grayed out. (C) Close-up view of single-positive T cells on Milo neighborhood embedding of lymphoid cells. Each point represents a neighborhood, the layout of points is determined by the position of the neighborhood index cell in the UMAP in fig. S4I. Top: neighborhoods are colored by the cell population they overlap. Bottom: neighborhoods are colored by their log-fold change in abundance between the specified organ and all other organs. Only neighborhoods displaying significant differential abundance (SpatialFDR 10%) are colored. (D) Mean expression of a selection of differentially expressed genes between single-positive T cells from thymus (TH) and other organs. We show genes downregulated in the thymus associated with TNF signaling (using MSigDB Hallmark 2020 gene sets) and genes upregulated in the thymus associated with an IFN-α response. (E) Schematic of the proposed mechanism of thymocyte maturation and egression from thymus mediated by type I interferon signaling and NF-κB signaling.
Fig. 3 Lymphoid variation across time and tissues. (A) Beeswarm plot of log-fold change (x-axis) in cell abundance across gestational stages in Milo neighborhoods of lymphoid cells (as in fig. 2A). (B) Heat map showing average expression across time of a selection of genes identified as markers of early-specific and late-specific NK neighborhoods (as in fig. 2B): NK cells identified in liver and skin before 12 pcw express TNF proinflammatory genes, whereas expression of immune-effector genes such as cytokines, chemokines and granzyme genes increases after 12 pcw. Age bins where less than 30 NK cells were present in a given organ are grayed out. (C) Close-up view of single-positive T cells on Milo neighborhood embedding of lymphoid cells. Each point represents a neighborhood, the layout of points is determined by the position of the neighborhood index cell in the UMAP in fig. S4I. Top: neighborhoods are colored by the cell population they overlap. Bottom: neighborhoods are colored by their log-fold change in abundance between the specified organ and all other organs. Only neighborhoods displaying significant differential abundance (SpatialFDR 10%) are colored. (D) Mean expression of a selection of differentially expressed genes between single-positive T cells from thymus (TH) and other organs. We show genes downregulated in the thymus associated with TNF signaling (using MSigDB Hallmark 2020 gene sets) and genes upregulated in the thymus associated with an IFN-α response. (E) Schematic of the proposed mechanism of thymocyte maturation and egression from thymus mediated by type I interferon signaling and NF-κB signaling.CC BY · PubMed Central
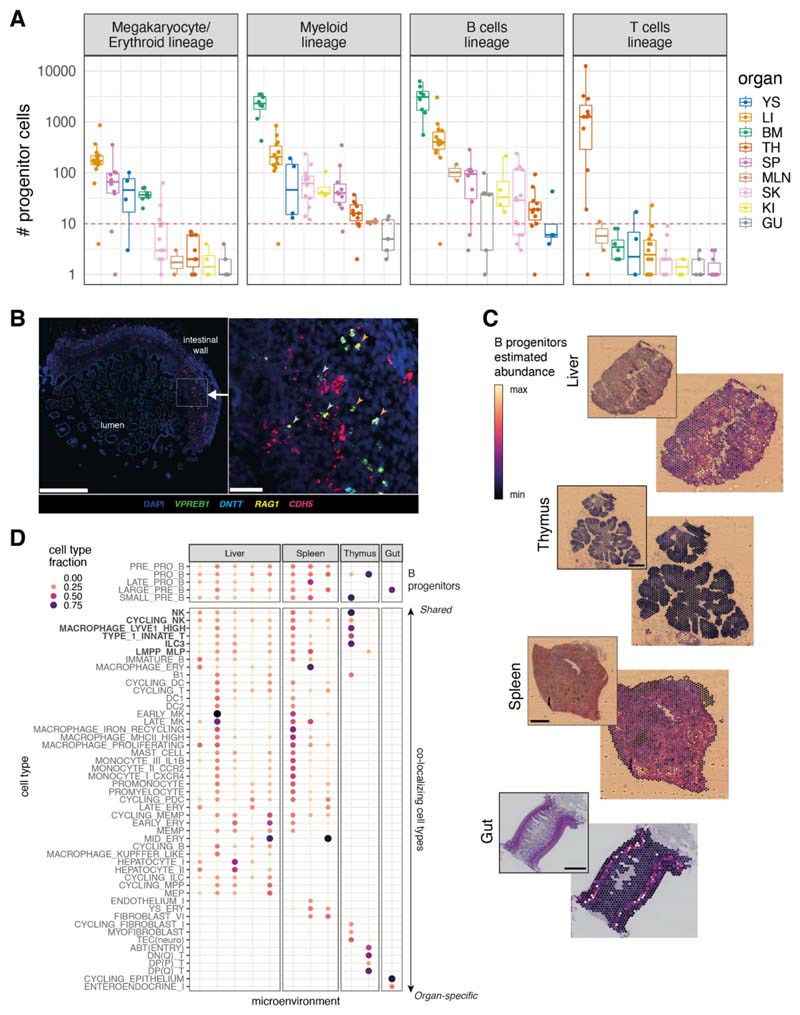
Fig. 4 System-wide blood and immune cell development. (A) Boxplots of the number of progenitor cells in all donors across organs. Each point represents a donor, color-coded by organ (YS: yolk sac; LI: liver; BM: bone marrow; TH: thymus; SP: spleen; MLN: mesenteric lymph node; SK: skin; GU: gut; KI: kidney). The red dash line marks the threshold of 10 cells for potential technical artefacts. B_prog: B cell lineage progenitors; M/E_prog: megakaryocyte/erythroid progenitors; MYE_prog: myeloid progenitors; T_prog: T cell progenitors. Detailed cell types included in each lineage are shown in table S5. Boxes capture the first-to-third quartile of the cell number and whisks span a further 1.5X interquartile range on each side of the box. (B) Multiplex smFISH staining with DAPI, CDH5 for endothelial cells, and VPREB1, DNTT, RAG1 for B cell progenitors in the human prenatal intestine at 15 pcw. Left panel shows a zoomed-out view with the area of interest boxed in white (scale bar: 500 μm). Right panel shows a detailed view of the area of interest (scale bar: 50 μm). Gray arrows point to B cell progenitors associated with blood vessels and orange arrows point to B cell progenitors away from blood vessels. (C) Scaled sum of abundances of B progenitor cell types estimated with cell2location, shown on representative slides for each organ, with the corresponding H&E staining. Each scale bar represents the length of 1 mm. (D) Cell type contributions to microenvironments containing B cell progenitors in different organs identified with non-negative matrix factorization of spatial cell type abundances estimated with cell2location. The color and the size of the dots represent the relative fraction of cells of a type assigned to the microenvironment.
Fig. 4 System-wide blood and immune cell development. (A) Boxplots of the number of progenitor cells in all donors across organs. Each point represents a donor, color-coded by organ (YS: yolk sac; LI: liver; BM: bone marrow; TH: thymus; SP: spleen; MLN: mesenteric lymph node; SK: skin; GU: gut; KI: kidney). The red dash line marks the threshold of 10 cells for potential technical artefacts. B_prog: B cell lineage progenitors; M/E_prog: megakaryocyte/erythroid progenitors; MYE_prog: myeloid progenitors; T_prog: T cell progenitors. Detailed cell types included in each lineage are shown in table S5. Boxes capture the first-to-third quartile of the cell number and whisks span a further 1.5X interquartile range on each side of the box. (B) Multiplex smFISH staining with DAPI, CDH5 for endothelial cells, and VPREB1, DNTT, RAG1 for B cell progenitors in the human prenatal intestine at 15 pcw. Left panel shows a zoomed-out view with the area of interest boxed in white (scale bar: 500 μm). Right panel shows a detailed view of the area of interest (scale bar: 50 μm). Gray arrows point to B cell progenitors associated with blood vessels and orange arrows point to B cell progenitors away from blood vessels. (C) Scaled sum of abundances of B progenitor cell types estimated with cell2location, shown on representative slides for each organ, with the corresponding H&E staining. Each scale bar represents the length of 1 mm. (D) Cell type contributions to microenvironments containing B cell progenitors in different organs identified with non-negative matrix factorization of spatial cell type abundances estimated with cell2location. The color and the size of the dots represent the relative fraction of cells of a type assigned to the microenvironment.CC BY · PubMed Central
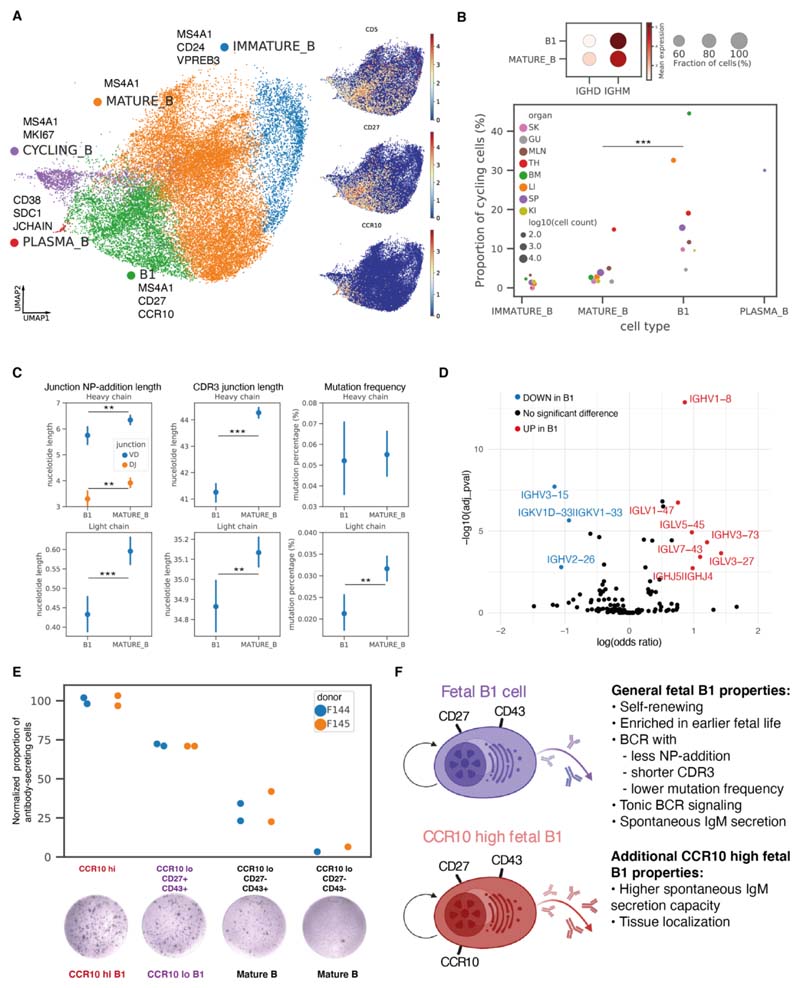
Fig. 5 Identification of putative prenatal B1 cells. (A) Left: Close-up view of non-progenitor B cell populations on UMAP embedding of all lymphoid cells (fig. S4I), with marker genes listed next to each cell type. Right: expression of B1 marker genes on UMAP. (B) Top: dot plot of IGHM and IGHD expressions in B1 and mature B cells, with color of dots representing the mean expression and size representing the fraction of cells expressing the gene. Bottom: cycling cell proportions within each B cell subtype colored by organs, with dot size representing log10(cell count) and only dots with at least 10 cells shown. B1 cells had significantly higher cycling proportions than mature B cells in a logistic regression controlling for donors and organs. (C) Point plots of NP-addition length, CDR3 junction length, and mutation frequency in BCR heavy chains or light chains in B1 (N=2,357) and mature B (N=7,387) cells, with points representing the mean and lines representing 95% confidence intervals. Heavy chain VD and DJ junction NP-addition lengths are only calculated for cells with high-quality D gene mapping (B1: N=615, mature B: N=2,430). Difference in characteristics were tested with linear regressions controlling for donors and organs. (D) Volcano plot summarizing results of BCR heavy and light chain V, J gene segment usage comparison between B1 and mature B cells. The y-axis is the −log10(Benjamini–Hochberg adjusted P-value) and the x-axis is log(odds ratio) computed using logistic regression controlling for donors and organs. (E) Normalized proportions of antibody-secreting cells in different sorted fractions of the ELISpot experiments (raw counts in table S6), colored by donor. Each point represents a reaction well. The proportions of antibody-secreting cells were normalized against the average proportion in CCR10hi wells for each donor to remove donor-specific effects. A representative well image for each sorted fraction is shown on the bottom. (F) Schematic illustration summarizing the features of all human prenatal B1 cells, and additional features specific to CCR10hi prenatal B1 cells.
Fig. 5 Identification of putative prenatal B1 cells. (A) Left: Close-up view of non-progenitor B cell populations on UMAP embedding of all lymphoid cells (fig. S4I), with marker genes listed next to each cell type. Right: expression of B1 marker genes on UMAP. (B) Top: dot plot of IGHM and IGHD expressions in B1 and mature B cells, with color of dots representing the mean expression and size representing the fraction of cells expressing the gene. Bottom: cycling cell proportions within each B cell subtype colored by organs, with dot size representing log10(cell count) and only dots with at least 10 cells shown. B1 cells had significantly higher cycling proportions than mature B cells in a logistic regression controlling for donors and organs. (C) Point plots of NP-addition length, CDR3 junction length, and mutation frequency in BCR heavy chains or light chains in B1 (N=2,357) and mature B (N=7,387) cells, with points representing the mean and lines representing 95% confidence intervals. Heavy chain VD and DJ junction NP-addition lengths are only calculated for cells with high-quality D gene mapping (B1: N=615, mature B: N=2,430). Difference in characteristics were tested with linear regressions controlling for donors and organs. (D) Volcano plot summarizing results of BCR heavy and light chain V, J gene segment usage comparison between B1 and mature B cells. The y-axis is the −log10(Benjamini–Hochberg adjusted P-value) and the x-axis is log(odds ratio) computed using logistic regression controlling for donors and organs. (E) Normalized proportions of antibody-secreting cells in different sorted fractions of the ELISpot experiments (raw counts in table S6), colored by donor. Each point represents a reaction well. The proportions of antibody-secreting cells were normalized against the average proportion in CCR10hi wells for each donor to remove donor-specific effects. A representative well image for each sorted fraction is shown on the bottom. (F) Schematic illustration summarizing the features of all human prenatal B1 cells, and additional features specific to CCR10hi prenatal B1 cells.CC BY · PubMed Central
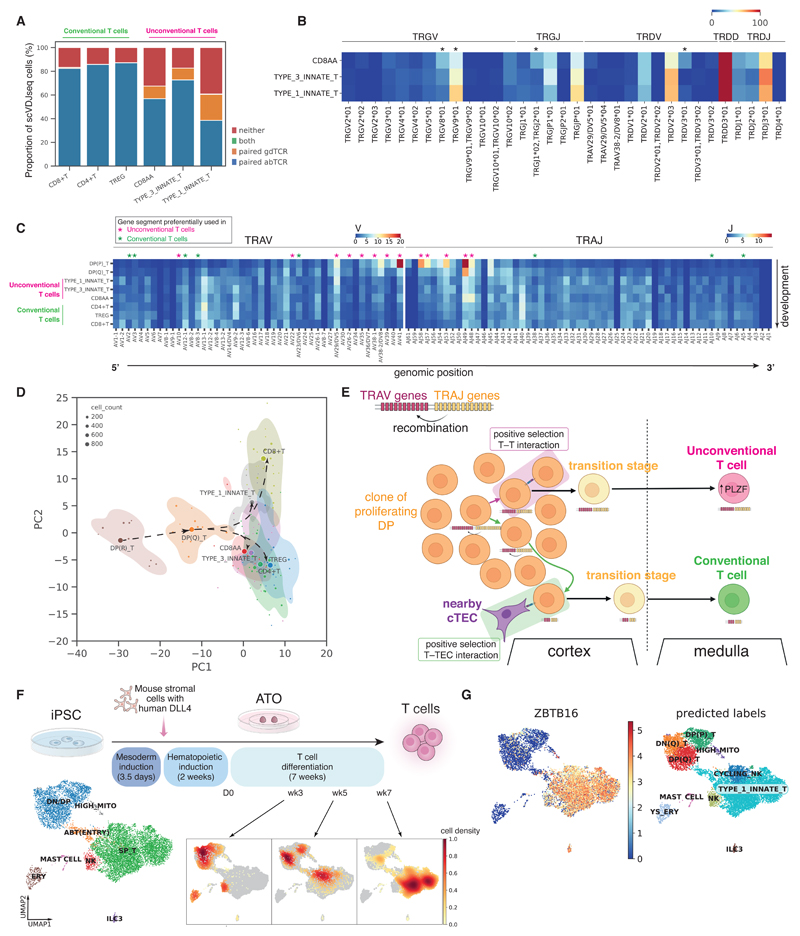
Fig. 6 Deep characterization of human unconventional T cells. (A) Proportions of cells expressing paired γδTCR, paired αβTCR, or both or neither. The proportions were calculated over cells that have had both single-cell αβTCR and γδTCR sequencing. The cells that expressed neither paired αβTCR nor paired γδTCR could be due to dropouts in single-cell TCR sequencing as over 50% of these contained orphan VDJ or VJ chains of αβTCR or γδTCR (fig. S28A). (B) Heat map showing the percentage of each γδTCR gene segment present in different T cell subtypes. Differential usage between cell subtypes was computed using the chi-squared test and gene segments with Benjamini–Hochberg adjusted P-values < 0.05 are marked with *. (C) Heat map showing the proportion of each TCRα gene segment present in different T cell subtypes. The gene segment usage in unconventional T cells and conventional T cells was compared using logistic regression, controlling for donors and organs. Gene segments with Benjamini–Hochberg adjusted P-value<0.05 are marked with magenta * (for preferential usage in unconventional T cells) and green * (for preferential usage in conventional T cells). (D) PCA plot summarizing TRAV, TRAJ, TRBV, TRBJ gene segment usage proportion in different T cell subtypes. Each dot represents a sample of at least 20 cells, with its size representing the cell count. The centroid of each cell type is shown as a filled circle, and 80% confidence contours are shown around the centroids. Arrows illustrate the proposed developmental trajectories. (E) Schematic illustration showing the T–T training origin of unconventional T cells in contrast to the T–TEC training origin of conventional T cells. (F) Top: schematic showing the experimental set-up of T cell differentiation from iPSCs in ATOs. Bottom left: UMAP visualization of different cell types in the ATO. Bottom right: density plots of cells from each time point over UMAP embedding. (G) Left: predicted annotations from logistic regression overlaid on the same UMAP plot as in (F); right: ZBTB16 expression pattern overlaid onto the same UMAP plot.
Fig. 6 Deep characterization of human unconventional T cells. (A) Proportions of cells expressing paired γδTCR, paired αβTCR, or both or neither. The proportions were calculated over cells that have had both single-cell αβTCR and γδTCR sequencing. The cells that expressed neither paired αβTCR nor paired γδTCR could be due to dropouts in single-cell TCR sequencing as over 50% of these contained orphan VDJ or VJ chains of αβTCR or γδTCR (fig. S28A). (B) Heat map showing the percentage of each γδTCR gene segment present in different T cell subtypes. Differential usage between cell subtypes was computed using the chi-squared test and gene segments with Benjamini–Hochberg adjusted P-values < 0.05 are marked with *. (C) Heat map showing the proportion of each TCRα gene segment present in different T cell subtypes. The gene segment usage in unconventional T cells and conventional T cells was compared using logistic regression, controlling for donors and organs. Gene segments with Benjamini–Hochberg adjusted P-value<0.05 are marked with magenta * (for preferential usage in unconventional T cells) and green * (for preferential usage in conventional T cells). (D) PCA plot summarizing TRAV, TRAJ, TRBV, TRBJ gene segment usage proportion in different T cell subtypes. Each dot represents a sample of at least 20 cells, with its size representing the cell count. The centroid of each cell type is shown as a filled circle, and 80% confidence contours are shown around the centroids. Arrows illustrate the proposed developmental trajectories. (E) Schematic illustration showing the T–T training origin of unconventional T cells in contrast to the T–TEC training origin of conventional T cells. (F) Top: schematic showing the experimental set-up of T cell differentiation from iPSCs in ATOs. Bottom left: UMAP visualization of different cell types in the ATO. Bottom right: density plots of cells from each time point over UMAP embedding. (G) Left: predicted annotations from logistic regression overlaid on the same UMAP plot as in (F); right: ZBTB16 expression pattern overlaid onto the same UMAP plot.CC BY · PubMed Central

Verification

Claims the paper makes

The claims and statistics of this paper haven’t been checked yet.

Run the check — free, no account needed. It reads the open-access text and checks the sources it cites.

A few free checks a day · papers already verified open instantly · results are public

Claims other papers make about this one

Each is checked against this paper’s own text: does it say what the citing paper says it does?

Self-check

Percentages, sums and reported differences re-computed from the paper’s own numbers.

The self-check needs the paper’s full text.

Citations

Cites

Show all 21 references

Research works printed but not linked: 82

  1. 10.1126/science.aaz9330 · DOI
  2. 10.1242/dev.083147 · DOI
  3. 10.1126/science.aat5031 · DOI
  4. 10.1038/s41422-019-0228-6 · DOI
  5. 10.1016/j.immuni.2019.09.008 · DOI
  6. 10.1126/science.aay3224 · DOI
  7. 10.1016/j.devcel.2020.11.010 · DOI
  8. 10.1038/s41586-021-03929-x · DOI
  9. 10.1038/s41587-021-01139-4 · DOI · Paper page
  10. 10.1038/s41467-018-06318-7 · DOI · Paper page
  11. 10.3389/fgene.2021.781272 · DOI
  12. 10.1126/science.abl5197 · DOI
  13. 10.1038/s41587-021-01033-z · DOI · Paper page
  14. 10.3389/fimmu.2019.02700 · DOI
  15. 10.1002/ijc.21596 · DOI
  16. F. Hua, Y. Tian, CCL4 promotes the cell proliferation, invasion and migration of endometrial carcinoma by targeting the VEGF-A signal pathway. Int. J. Clin. Exp. Pathol. 10, 11288–11299 (2017). 31966483
  17. 10.1016/S0065-230X(10)06003-3 · DOI
  18. 10.1074/jbc.M208231200 · DOI
  19. 10.1034/j.1600-0463.2002.100501.x · DOI
  20. 10.1016/j.yexcr.2015.11.022 · DOI
  21. 10.1016/j.devcel.2017.01.001 · DOI
  22. 10.1016/j.smim.2008.02.003 · DOI
  23. 10.1038/nature19814 · DOI
  24. 10.1038/s41590-018-0294-9 · DOI
  25. 10.1016/j.cell.2021.04.039 · DOI
  26. 10.1038/ni.3419 · DOI
  27. 10.1084/jem.20151604 · DOI
  28. 10.1007/s10875-021-01059-7 · DOI
  29. 10.1034/j.1398-9995.2000.00118.x · DOI
  30. 10.1084/jem.20101499 · DOI
  31. 10.3389/fimmu.2012.00122 · DOI
  32. 10.1111/nyas.12137 · DOI
  33. 10.1002/eji.1830190315 · DOI
  34. 10.1084/jem.157.1.202 · DOI
  35. 10.1016/j.immuni.2011.11.017 · DOI
  36. A. B. Kantor, C. E. Merrill, L. A. Herzenberg, J. L. Hillson, An unbiased analysis of V(H)-D-J(H) sequences from B-1a, B-1b, and conventional B cells. J. Immunol. 158, 1175–1186 (1997). 9013957 · DOI
  37. 10.1002/j.1460-2075.1995.tb07157.x · DOI
  38. 10.1084/jem.168.2.811 · DOI
  39. 10.1038/s41586-021-03852-1 · DOI
  40. 10.1016/j.immuni.2006.10.010 · DOI
  41. 10.1016/j.coi.2010.12.016 · DOI
  42. 10.1073/pnas.1412058112 · DOI
  43. 10.1126/sciimmunol.abf0125 · DOI
  44. 10.1038/s41586-021-03578-0 · DOI
  45. 10.1016/j.celrep.2017.05.045 · DOI
  46. 10.1084/jem.20091519 · DOI
  47. 10.1073/pnas.1105118108 · DOI
  48. 10.1038/s41467-021-22589-z · DOI
  49. 10.1101/gad.10.8.948 · DOI
  50. 10.1038/nri913 · DOI
  51. 10.1016/j.stem.2018.12.011 · DOI
  52. 10.1016/j.exphem.2021.10.002 · DOI
  53. 10.1182/blood.2021013450 · DOI
  54. 10.1084/jem.20200737 · DOI
  55. 10.2147/JBM.S7224 · DOI
  56. 10.1038/s41593-021-00880-y · DOI
  57. 10.1016/j.immuni.2021.09.016 · DOI
  58. 10.1038/ni1301 · DOI
  59. 10.1073/pnas.0811632106 · DOI
  60. 10.1073/pnas.1015841108 · DOI
  61. 10.1016/j.coi.2018.01.001 · DOI
  62. 10.1126/science.aau8475 · DOI
  63. 10.1038/s41592-019-0392-0 · DOI · Paper page
  64. S. J. Fleming J. C. Marioni M. Babadi CellBender remove-background: a deep generative model for unsupervised removal of background noise from scRNA-seq datasets bioRxiv 791699 [Preprint] (2019); .10.1101/791699 · DOI · Paper page
  65. 10.1016/j.cels.2018.11.005 · DOI · Paper page
  66. F. Pedregosa., Scikit-learn: Machine learning in python. j. mach. learn. res. 12, 2825–2830 (2011).
  67. K. Polański, M. D. Young, Z. Miao, K. B. Meyer, S. A. Teichmann, J. E. Park, BBKNN: Fast batch alignment of single cell transcriptomes. Bioinformatics 36, 964–965 (2020). 31400197 · DOI · Paper page
  68. 10.1093/bioinformatics/btaa1009 · DOI
  69. 10.1038/s41467-021-25960-2 · DOI · Paper page
  70. 10.1093/bioinformatics/btp616 · DOI · Paper page
  71. 10.1093/bioinformatics/btaa611 · DOI
  72. 10.1038/s41591-021-01329-2 · DOI · Paper page
  73. 10.1093/bioinformatics/btv359 · DOI
  74. 10.1038/s41596-020-0292-x · DOI · Paper page
  75. 10.1038/s41588-021-00972-2 · DOI
  76. 10.1038/s41592-021-01346-6 · DOI
  77. 10.1038/s41592-021-01358-2 · DOI
  78. I. Virshup S. Rybakov F. J. Theis P. Angerer F. A. Wolf anndata: Annotated data bioRxiv 473007 [Preprint] (2021); 10.1101/2021.12.16.473007 · DOI
  79. 10.1126/sciimmunol.abf7777 · DOI · Paper page
  80. 10.1073/pnas.1417683112 · DOI
  81. 10.1016/S1074-7613(01)00185-6 · DOI
  82. 10.1038/382635a0 · DOI

Cited by

Sorted by citations

Metadata

Authors
Suo, C., Dann, E., Goh, I., Jardine, L., Kleshchevnikov, V., Park, J.-E., Botting, R. A., Stephenson, E., Engelbert, J., Tuong, Z. K., Polanski, K., Yayon, N., Xu, C., Suchanek, O., Elmentaite, R., Domínguez Conde, C., He, P., Pritchard, S., Miah, M., Moldovan, C., Steemers, A. S., Mazin, P., Prete, M., Horsfall, D., Marioni, J. C., Clatworthy, M. R., Haniffa, M., & Teichmann, S. A.
Affiliations
  • Wellcome Sanger Institute, Wellcome Genome Campus, Hinxton, Cambridge, UK.
  • Biosciences Institute, Newcastle University, Newcastle upon Tyne, UK.
  • Molecular Immunity Unit, University of Cambridge Department of Medicine, Cambridge, UK.
  • Department of Cellular Pathology, Newcastle upon Tyne Hospitals NHS Foundation Trust, Newcastle upon Tyne, UK.
Venue
Science
Published
2022-06-03
Volume
376
Issue
6597
ISSN
  • 0036-8075
  • 1095-9203
Cited by
340
References
21
Language
en

About these checks

Registry, retraction, Cites and statistics results are computed, not judged, with one exception: a printed reference that no index lists is read once by a model before it counts as a citation error. Claims are extracted by a model and kept only when their quote appears verbatim in the text; each cited source is then checked, with a model’s help, for whether it says what the claim relies on. Those verdicts can be wrong — read the claim’s quote and the cited source before relying on one.

Statistics and arithmetic are recomputed, not judged.

Confidence bands are shown only for fields calibrated on our annotated test set. None is calibrated yet, so no band is shown.

What counts as a claim ›How we measure confidence ›How we check this ›

Are you an author, or do you see a problem with this page? Request a review