

The DOI matches its Crossref record; 107 of the 107 references it cites were found in a registry or an index; 54 of the 64 sources its claims cite were checked for support.
Confronting false discoveries in single-cell differential expression
Open accessAbstract
Differential expression analysis in single-cell transcriptomics enables the dissection of cell-type-specific responses to perturbations such as disease, trauma, or experimental manipulation. While many statistical methods are available to identify differentially expressed genes, the principles that distinguish these methods and their performance remain unclear. Here, we show that the relative performance of these methods is contingent on their ability to account for variation between biological replicates. Methods that ignore this inevitable variation are biased and prone to false discoveries. Indeed, the most widely used methods can discover hundreds of differentially expressed genes in the absence of biological differences. Our results suggest an urgent need for a paradigm shift in the methods used to perform differential expression analysis in single-cell data.
Overview
CoChat Summary
TL;DR
The paper benchmarks 14 differential expression methods on 18 ground-truth datasets and finds that pseudobulk methods, which aggregate cells within biological replicates, outperform single-cell methods. Methods that ignore between-replicate variation are biased toward highly expressed genes and can produce hundreds of false discoveries even without biological differences.
Key findings
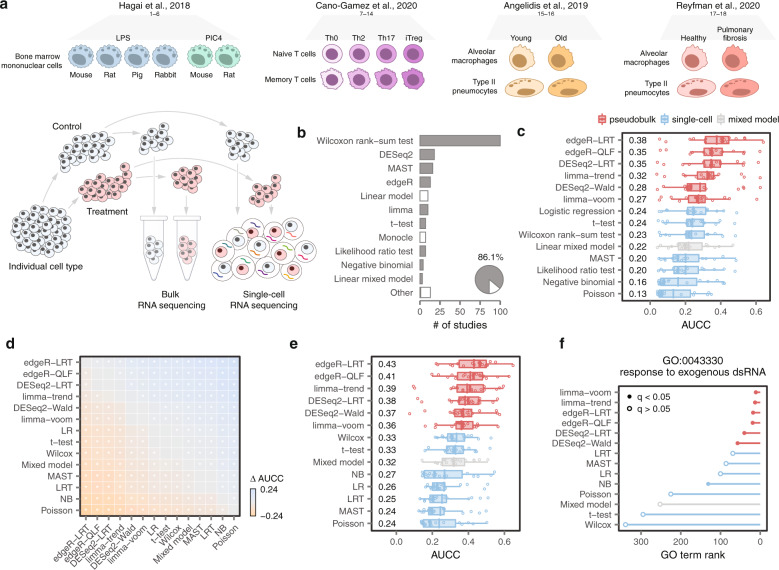
- In 18 ground-truth datasets, all six top-performing DE methods aggregated cells within biological replicates to form pseudobulks; pseudobulk versus single-cell differences were highly significant and robust to concordance methodology.
- Single-cell DE methods were biased toward highly expressed genes: false positives were more highly expressed, abundant ERCC spike-ins were incorrectly called DE, and a compendium of 46 scRNA-seq datasets showed a systematic preference for highly expressed genes.
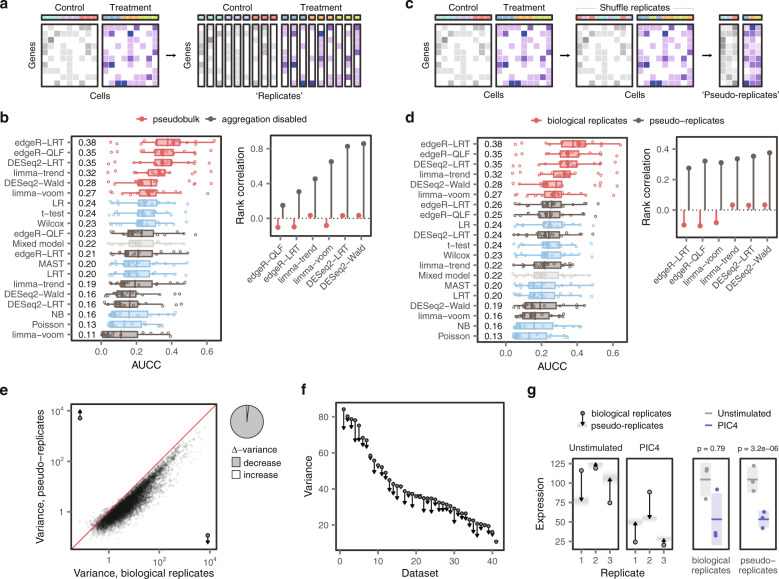
- Failing to account for biological replicates produced false discoveries: simulations identified hundreds of DE genes with no perturbation; random splits of unstimulated controls in 14 datasets produced excess false positives; spatial transcriptomics identified thousands of DE genes within each spinal cord region.
- In injured mouse spinal cord snRNA-seq (19,237 nuclei), RNAscope validated 5 of 6 genes called by edgeR-LRT versus 3 of 13 called by Wilcoxon rank-sum (p < 0.05, χ² test); GLMMs converged to pseudobulk performance in datasets of 500 or more cells and took an average of 13.5 h per cell type versus minutes for pseudobulk methods.
Methods
- Literature review of 500 recent scRNA-seq studies, of which 205 conducted DE analysis between biological conditions, identified 14 methods: 7 single-cell methods, 6 pseudobulk methods, and 1 linear mixed model.
- The study used 18 ground-truth datasets from four publications with matched bulk and scRNA-seq in the same purified cells, perturbations, and laboratories; concordance was measured by area under the concordance curve (AUCC) and rank correlation, with GO term enrichment, a 46-dataset scRNA-seq compendium, Splatter simulations, 14 control-group datasets, spatial transcriptomics, and spinal cord injury snRNA-seq plus RNAscope.
- Additional analyses disabled pseudobulk aggregation, created pseudo-replicates by shuffling replicates, compared variance between biological replicates and pseudo-replicates, and evaluated Poisson or negative binomial GLMMs.
Limitations
- The paper does not include a dedicated limitations section. It states that the enormous computational requirements of GLMMs prevented evaluation in the full ground-truth datasets, so downsampled datasets of 25–1,000 cells were used; the ground-truth resource was limited to 18 datasets from four publications.
- Evident from the text: simulations used parameters estimated from the Kang et al. dataset and may not capture all biological or technical heterogeneity; the in vivo RNAscope validation screened selected putatively DE genes rather than all DE genes; and human-versus-mouse variability conclusions rely on the assembled compendium datasets.
Model-written summary. Check it against the paper before relying on it.
Integrity signals
Registry
Cites
Statistics
Figures



Verification
Claims the paper makes
21 Valid · 9 Not valid · 4 Not checked · 144 Own results and interpretations
Some cited sources support this claim and some don’t — read each source’s verdict below.
In the paper
“Within our compendium, we identified a total of fourteen studies with control groups that included six or more samples5,6,15,49–59.”
§ Confronting false discoveries in single-cell differential expression > Methods > Analysis of published scRNA-seq control groups
What the sources say
- Supportedcites [5] source
The citation identifies a study eligible for the citing authors’ compendium, rather than attributing the tally of fourteen studies to Kang et al. In Methods > IFN-β stimulation and culture (page not provided), the paper reports eight untreated samples pooled as the control condition, meeting the six-sample threshold. (LLM, conf=0.92)
- Supportedcites [6] 2019, Single-cell transcriptomic analysis of Alzheimer’s disease, Nature source
The Methods section (‘Selection of individuals from the Religious Order Study (ROS) cohort’) says this study selected 24 no-pathology controls and 24 individuals with AD pathology. It therefore qualifies as a study with at least six control samples. The total of fourteen studies describes the citing authors’ compendium, not a finding attributed to this individual source. (LLM, conf=0.91)
- Supportedcites [15] source
The Results section (‘Lung aging atlas reveals deregulated transcriptional control’; page not provided) reports single-cell data from eight young mice and seven old mice. This supports citing the paper as one study with a control group of at least six samples; the total of fourteen studies is the citing authors’ count of their compendium, not a count attributed to this source alone. (LLM, conf=0.92)
- Supportedcites [49] 2020, Single-nucleus transcriptomics of the prefrontal cortex in major depressive disorder implicates oligodendrocyte precursor cells and excitatory neurons, Nat. Neu-rosci source
This paper is cited as one of the studies in the compendium, not as the source of the compendium-wide count. Its Table 1 reports 17 controls, exceeding the six-sample threshold. (LLM, conf=0.91)
- Supportedcites [50] source
The citation identifies this paper as one of the studies in the citing authors’ compendium with at least six control samples; the count of fourteen is the citing authors’ own tally. The Methods (Subjects and specimen collection) state that blood was collected from six asymptomatic control donors, and the Abstract likewise reports six healthy controls. (LLM, conf=0.92)
- Partly supportedcites [51] sourceExperimental — accuracy not yet measured
The Fig. 9 caption reports six Sham/Veh controls for behavioral tests, so this paper does contain a control group of six. But the Methods report only three Sham samples in the Drop-seq data and four per group selected for T4-treatment sequencing. The paper cannot establish the citing authors’ count of fourteen studies or show that this study had six control sequencing samples. (LLM, conf=0.84)
- Disputedcites [52] 2018, Single-cell RNA-seq uncovers a robust transcriptional response to morphine by glia, Cell Rep sourceExperimental — accuracy not yet measured
The cited paper is one study, so it cannot establish the compendium-wide total of fourteen. For its own control group, STAR⋆METHODS reports four mock-treatment biological replicates in the single-cell analysis, not six or more samples; its bulk RNA-seq analysis reports three mock-treatment replicates. (LLM, conf=0.86)
Checked by a reasoning model — may be wrong.
- Partly supportedcites [53] sourceExperimental — accuracy not yet measured
The study description (section labeled Abstract; page not provided) reports uninjured, intact-tail samples alongside amputated-tail samples, supporting its identification as a study with a control condition. It says there were at least two biological replicates per condition, but does not establish that the control group had six or more samples. The count of fourteen studies is the citing authors’ compendium count, not a finding attributed to this individual source. (LLM, conf=0.77)
- Supportedcites [54] 2019, Cell type-specific transcriptional programs in mouse prefrontal cortex during adolescence and addiction, Nat. Commun source
This citation identifies one study included in the citing authors’ compendium; it is not offered as evidence for the compendium-wide count of fourteen. The Methods (Animals; Tissue collection and library preparation, pages unavailable) report 12 mice in each saline and cocaine group, with two mice pooled per biological replicate, yielding six control replicates. (LLM, conf=0.91)
- Disputedcites [55] 2020, Single cell transcriptome profiling of the human alcohol-dependent brain, Hum. Mol. Genet sourceExperimental — accuracy not yet measured
The Results and Discussion section (page unavailable) says this study included four control donors, not six or more. The Conclusions section likewise describes seven donors in total: three with alcohol dependence and four controls. This source therefore cannot support its inclusion as a study meeting the stated control-group threshold; it does not address the compendium-wide count of fourteen. (LLM, conf=0.91)
Checked by a reasoning model — may be wrong.
plainn = 14- Asserted: passes — The authors put it forward as true.
- Checkable: passes — It can be checked against evidence.
- Load-bearing: passes — The paper’s conclusions depend on it.
- Based: passes — The paper gives a reason why it holds.
- Rests on an assumption not shown here.
- Supported
Every source the paper cites for this claim was checked and supports it.
In the paper
“Moreover, comparisons to matching proteomics data 13 revealed that pseudobulk methods also more accurately predicted changes in protein abundance (Supplementary Fig. 1e-f ).”
What the sources say
- Supportedcites [13] 2018, Gene expression variability across cells and species shapes innate immunity, Nature source
Citation 13 is attached to the matching proteomics data, not to the pseudobulk-versus-single-cell comparison, which the citing authors report from their own Supplementary Fig. 1e–f. The source’s Methods (‘Cell state specific gene signatures’; page unavailable) describes matching its proteomics and RNA-seq data by gene name, supporting its identification as the data source. (LLM, conf=0.88)
plainstates an association- Asserted: passes — The authors put it forward as true.
- Checkable: passes — It can be checked against evidence.
- Load-bearing: passes — The paper’s conclusions depend on it.
- Based: passes — The paper gives a reason why it holds.
- Supported
Every source the paper cites for this claim was checked and supports it.
In the paper
“Within the same experimental condition, replicates exhibit inherent differences in gene expression, which reflect both biological and technical factors 22 .”
What the sources say
- Supportedcites [22] source
The Discussion’s “Outlook” section describes biological and technical components of gene-expression variation among single-cell samples from the same biological condition. The Results section on batch effects also reports substantial variation between technical replicates from the same individual. Page numbers are not provided in our copy. (LLM, conf=0.89)
plainstates a cause- Asserted: passes — The authors put it forward as true.
- Checkable: passes — It can be checked against evidence.
- Load-bearing: passes — The paper’s conclusions depend on it.
- Based: passes — The paper gives a reason why it holds.
- Supported
Every source the paper cites for this claim was checked and supports it.
In the paper
“This analysis immediately revealed that all six of the top-performing methods shared a common analytical property. These methods aggregated cells within a biological replicate, to form so-called ‘pseudobulks’, before applying a statistical test (Fig. 1c ) 18 .”
What the sources say
- Supportedcites [18] source
Section 3.1 describes summing counts across cells within each plate, then using those sums for DE testing with plates treated as replicates. The statement that six methods were top-performing is presented as the citing authors’ own analysis, not a finding attributed to this source. (LLM, conf=0.87)
plain- Asserted: passes — The authors put it forward as true.
- Checkable: passes — It can be checked against evidence.
- Load-bearing: passes — The paper’s conclusions depend on it.
- Based: passes — The paper gives a reason why it holds.
- Supported
The cited sources that could be checked couldn’t confirm or dispute this claim.
In the paper
“For example, single-cell methods failed to identify the relevant GO term when comparing mouse phagocytes stimulated with poly(I:C) 12 , a synthetic double-stranded RNA (Fig. 1f ).”
What the sources say
- Could not verifycites [12] sourceExperimental — accuracy not yet measured
The Methods section on bone marrow-derived phagocytes reports poly(I:C) stimulation of rodent cells and single-cell analysis, but does not report whether a GO term was identified. Searches for GO-term enrichment and a failure to identify a term found no passage addressing the claimed result. (LLM, conf=0.76)
plainSingle case- Asserted: passes — The authors put it forward as true.
- Checkable: passes — It can be checked against evidence.
- Load-bearing: passes — The paper’s conclusions depend on it.
- Based: passes — The paper gives a reason why it holds.
- Could not verify
133 more claims · 12 with their cited sources checked
Create a free account to see all 178 claims and every source verdict.
- It may state two separate claims as one. 21
- Probably not a substantial claim. 21
- The quote only partly states this claim. 2
Claims other papers make about this one
Each is checked against this paper’s own text: does it say what the citing paper says it does?
The source backs part of the claim, not all of it — or backs it for a different population, condition or comparison.
In the citing paper
“Previous benchmark study showed that Seurat18, DESeq226, edgeR27, and Limma25 are among the top methods in discovering differentially expressed genes using single-cell data28.”
From ASGARD is a single-cell guided pipeline to aid repurposing of drugs (2023) · cites this paper as [28]
Experimental — accuracy not yet measuredThe source backs part of the claim, not all of it — or backs it for a different population, condition or comparison.
In the citing paper
“Demultiplexing of pooled scRNA-seq is required to associate metadata with individual samples to account for between sample variation, replicate strengthened differential expression analysis, and confirmation of sample representation across scRNA-seq datasets and cell clusters (Squair et al, 2021; Zimmerman et al, 2021).”
From Evaluation of genetic demultiplexing of single-cell sequencing data from model species (2023) · cites this paper as Squair et al, 2021
Experimental — accuracy not yet measuredThe cited source says what the claim attributes to it.
In the citing paper
“On the one hand, modeling pseudobulk counts has been demonstrated to prevent pseudo-replication bias36,37.”
From Transcriptome-wide analysis of differential expression in perturbation atlases (2025) · cites this paper as [36]
The cited source says what the claim attributes to it.
In the citing paper
“Two benchmarking studies, one applying the aforementioned simulation tool and one using different example data sets, demonstrated that the “pseudobulk” approach in combination with classical differential gene expression methods such as edgeR44 and limma-voom45 outperforms single cell specific methods and mixed models in multi sample DE analysis43,46.”
From scPower accelerates and optimizes the design of multi-sample single cell transcriptomic studies (2021) · cites this paper as [46]
The cited source says what the claim attributes to it.
In the citing paper
“DGE analysis was conducted using a pseudobulk approach to mitigate Type I error inflation [25].”
From Cardiac Macrophages Exhibit Dynamic Heterogeneity and Functional Specialization During Experimental Autoimmune Myocarditis. (2026) · cites this paper as [25]
6 more claims about this paper
Create a free account to see every claim other papers make about this one.
Self-check
Percentages, sums and reported differences re-computed from the paper’s own numbers.
Each contradiction between two passages listed here was confirmed by an independent check.
Rated minor: it would not touch a result — a value no result rests on, a p-value that stays on the same side of the significance level, or a conflict that is clerical, resolved elsewhere in the paper, or outside its own findings.
In the paper
§ Confronting false discoveries in single-cell differential expression > Results > False discoveries in single-cell DE
“we calculated the variability between replicates within 41 human and mouse scRNA-seq datasets.”
§ Confronting false discoveries in single-cell differential expression > Methods > Analysis of published scRNA-seq control groups
“we computed the mean ∆-variance across all genes in the 38 human or mouse scRNA-seq datasets in our compendium (n = 18 human datasets and 20 mouse datasets).”
Rated minor: it would not touch a result — a value no result rests on, a p-value that stays on the same side of the significance level, or a conflict that is clerical, resolved elsewhere in the paper, or outside its own findings.
In the paper
§ Confronting false discoveries in single-cell differential expression > Methods > Application to spinal cord injury
“7 genes identified by edgeR-LRT (Slc7a11, catalog no. 422511; Gjb2, catalog no. 518881; Pi16, catalog no. 451311; Rbp4, catalog no. 508501; Col1a1, catalog no. 319371; Igfbp6, catalog no. 425721).”
§ Confronting false discoveries in single-cell differential expression > Results > True and false discoveries in the injured mouse spinal cord
“RNAscope validated five of the six genes called as DE by edgeR-LRT.”
Citations
Cites
Moderated estimation of fold change and dispersion for RNA-seq data with DESeq2
Love, M. I., Huber, W., & Anders, S. (2014) · Genome Biology · doi:10.1186/s13059-014-0550-8 · Cited by 95,106
Subramanian, A., Tamayo, P., Mootha, V. K., Mukherjee, S., Ebert, B. L., Gillette, M. A., Paulovich, A., Pomeroy, S. L., Golub, T. R., Lander, E. S., et al. (2005) · Proceedings of the National Academy of Sciences · doi:10.1073/pnas.0506580102 · Cited by 53,625
Robinson, M. D., McCarthy, D. J., & Smyth, G. K. (2010) · Bioinformatics · doi:10.1093/bioinformatics/btp616 · Cited by 41,364
limma powers differential expression analyses for RNA-sequencing and microarray studies
Ritchie, M. E., Phipson, B., Wu, D., Hu, Y., Law, C. W., Shi, W., & Smyth, G. K. (2015) · Nucleic Acids Research · doi:10.1093/nar/gkv007 · Cited by 40,458
Integrated analysis of multimodal single-cell data
Hao, Y., Hao, S., Andersen-Nissen, E., Mauck, W. M., Zheng, S., Butler, A., Lee, M. J., Wilk, A. J., Darby, C., Zagar, M., et al. (2020) · doi:10.1101/2020.10.12.335331 · Cited by 15,508
Comprehensive Integration of Single-Cell Data
Stuart, T., Butler, A., Hoffman, P., Hafemeister, C., Papalexi, E., Mauck, W. M., Hao, Y., Stoeckius, M., Smibert, P., & Satija, R. (2019) · Cell · doi:10.1016/j.cell.2019.05.031 · Cited by 15,453
RNA-Seq: a revolutionary tool for transcriptomics
Wang, Z., Gerstein, M., & Snyder, M. (2009) · Nature Reviews Genetics · doi:10.1038/nrg2484 · Cited by 13,174
SCANPY: large-scale single-cell gene expression data analysis
Wolf, F. A., Angerer, P., & Theis, F. J. (2018) · Genome Biology · doi:10.1186/s13059-017-1382-0 · Cited by 8,881
voom: precision weights unlock linear model analysis tools for RNA-seq read counts
Law, C. W., Chen, Y., Shi, W., & Smyth, G. K. (2014) · Genome Biology · doi:10.1186/gb-2014-15-2-r29 · Cited by 6,155
McCarthy, D. J., Chen, Y., & Smyth, G. K. (2012) · Nucleic Acids Research · doi:10.1093/nar/gks042 · Cited by 5,195
Research works printed but not linked: 1
- 10.1007/978-1-4939-3578-9$\_$19 · doi:10.1007/978-1-4939-3578-9$_$19
Cited by
Best practices for single-cell analysis across modalities
Heumos, L., Schaar, A. C., Lance, C., Litinetskaya, A., Drost, F., Zappia, L., Lücken, M. D., Strobl, D. C., Henao, J., Curion, F., et al. (2023) · Nature Reviews Genetics · doi:10.1038/s41576-023-00586-w · Cited by 1,051
An integrated cell atlas of the lung in health and disease
Sikkema, L., Ramírez-Suástegui, C., Strobl, D. C., Gillett, T. E., Zappia, L., Madissoon, E., Markov, N. S., Zaragosi, L.-E., Ji, Y., Ansari, M., et al. (2023) · Nature Medicine · doi:10.1038/s41591-023-02327-2 · Cited by 854
“Modeling these covariates at the cell level (that is, treating single cells as independent samples even when they come from the same sample) has been shown to inflate P values 104,105 .”
BackgroundhdWGCNA identifies co-expression networks in high-dimensional transcriptomics data
Morabito, S., Reese, F., Rahimzadeh, N., Miyoshi, E., & Swarup, V. (2023) · Cell Reports Methods · doi:10.1016/j.crmeth.2023.100498 · Cited by 1,027
APOE4/4 is linked to damaging lipid droplets in Alzheimer’s disease microglia
Haney, M. S., Pálovics, R., Munson, C. N., Long, C., Johansson, P. K., Yip, O., Dong, W., Rawat, E., West, E., Schlachetzki, J. C. M., et al. (2024) · Nature · doi:10.1038/s41586-024-07185-7 · Cited by 667
“We summed the raw counts per patient sample and hence derived ‘pseu-dobulk’ samples 47 from the single-cell counts.”
Maturation and circuit integration of transplanted human cortical organoids
Revah, O., Gore, F., Kelley, K. W., Andersen, J., Sakai, N., Chen, X., Li, M.-Y., Birey, F., Yang, X., Saw, N. L., et al. (2022) · Nature · doi:10.1038/s41586-022-05277-w · Cited by 504
Metadata
- Authors
- Squair, J. W., Gautier, M., Kathe, C., Anderson, M. A., James, N. D., Hutson, T. H., Hudelle, R., Qaiser, T., Matson, K. J. E., Barraud, Q., Levine, A. J., La Manno, G., Skinnider, M. A., & Courtine, G.
- Affiliations
- University of British Columbia (CA)
- Centre Hospitalier Universitaire Vaudois (CH)
- National Institute of Neurological Disorders and Stroke (US)
- Corresponding author
- Skinnider, Michael A.
- Courtine, Grégoire
- ORCID
- Venue
- Nature Communications
- Publisher
- openRxiv
- Published
- 2021-03-12
- Volume
- 12
- Issue
- 1
- Pages
- 5692-5692
- ISSN
- 2041-1723 (ISSN-L)
- PMC
- PMC8479118
- OpenAlex
- W3202649987
- Cited by
- 1,086
- References
- 104
- Citations by year
- 2026: 396 · 2025: 214 · 2024: 231 · 2023: 145 · 2022: 86 · 2021: 12
- FWCI
- 34.62
- Type
- journal article
- Language
- en
- Open access
- gold
- doi.org
- Licence
- Locations
- Nature Communications (publishedVersion, cc-by)
- bioRxiv (Cold Spring Harbor Laboratory) (submittedVersion)
- PubMed Central (publishedVersion, cc-by)
- PubMed (publishedVersion)
- SERVAL (Université de Lausanne) (publishedVersion, cc-by)
- IRIS (submittedVersion, cc-by)
- RePEc: Research Papers in Economics (submittedVersion)
- DOAJ (DOAJ: Directory of Open Access Journals) (submittedVersion, cc-by-sa)
- Infoscience (Ecole Polytechnique Fédérale de Lausanne) (submittedVersion, cc-by-nc-nd)
- Funders
- National Science Foundation
- Wings for Life
- Compute Canada
- Western Canada Research Grid
- Wyss Center for Bio and Neuroengineering
- Schweizerischer Nationalfonds zur Förderung der Wissenschaftlichen Forschung (185728, 192558, 193445, 190495, 310030)
- University of British Columbia
- National Institutes of Health
- Canadian Institutes of Health Research
- National Supercomputing Center, Korea Institute of Science and Technology Information
- National Institute of Neurological Disorders and Stroke
- H2020 European Research Council (682999)
- Topics
- Life Sciences › Biochemistry, Genetics and Molecular Biology › Molecular Biology › Single-cell and spatial transcriptomics
- Life Sciences › Biochemistry, Genetics and Molecular Biology › Molecular Biology › Gene expression and cancer classification
- Life Sciences › Biochemistry, Genetics and Molecular Biology › Molecular Biology › Bioinformatics and Genomic Networks
- Keywords
- single-cell differential expression, false discovery, biological replicates, comparison of statistical methods, differentially expressed genes, spinal cord injury, mouse spinal cord, cell type-specific responses, false positives
- MeSH terms
- Data Accuracy, Biological Variation, Population, Biological Variation, Individual, RNA-Seq, Animals, Gene Expression Regulation, Humans, Rabbits, Swine, Models, Statistical, Mice, Rats, Single-Cell Analysis, Datasets as Topic
About these checks
Registry, retraction, Cites and statistics results are computed, not judged, with one exception: a printed reference that no index lists is read once by a model before it counts as a citation error. Claims are extracted by a model and kept only when their quote appears verbatim in the text; each cited source is then checked, with a model’s help, for whether it says what the claim relies on. Those verdicts can be wrong — read the claim’s quote and the cited source before relying on one.
The claim verdicts this report counts are experimental: their accuracy is not yet measured.
A language model drew the claims from the paper on 2026-10-10, under version 3 of the claim definition (model deepseek-v4.1-flash, prompt extract-v3).
A second model labelled each claim on 2026-10-10 (model jev-1.13-20260917, definition revision gold-guideline-v0.2).
Cited sources are checked with a language model’s help (gpt-6-sol).
Statistics and arithmetic are recomputed, not judged.
Confidence bands are shown only for fields calibrated on our annotated test set. None is calibrated yet, so no band is shown.
What counts as a claim ›How we measure confidence ›How we check this ›
Are you an author, or do you see a problem with this page? Request a review
How to cite
Cite CoChat for the checks on this page, and the paper for its own findings.
- This page
- CoChat. (2026). Citation check: Confronting false discoveries in single-cell differential expression. https://app.cochat.ai/papers/10.1101/2021.03.12.435024
- The paper
- Squair, J. W., Gautier, M., Kathe, C., Anderson, M. A., James, N. D., Hutson, T. H., Hudelle, R., Qaiser, T., Matson, K. J. E., Barraud, Q., Levine, A. J., La Manno, G., Skinnider, M. A., & Courtine, G. (2021). Confronting false discoveries in single-cell differential expression. Nature Communications. https://doi.org/10.1101/2021.03.12.435024
Data sources
Bibliographic data: Semantic Scholar, OpenAlex, Crossref.
Contains information from the Semantic Scholar Academic Graph Datasets, made available under the ODC Attribution License (ODC-BY 1.0).
Semantic Scholar’s data is described in: Kinney, R., et al. (2023). The Semantic Scholar Open Data Platform. arXiv:2301.10140.
