

The DOI matches its Crossref record; 22 of the 23 references it cites were found in a registry or an index.
Evaluation of statistical methods for normalization and differential expression in mRNA-Seq experiments
Open accessAbstract
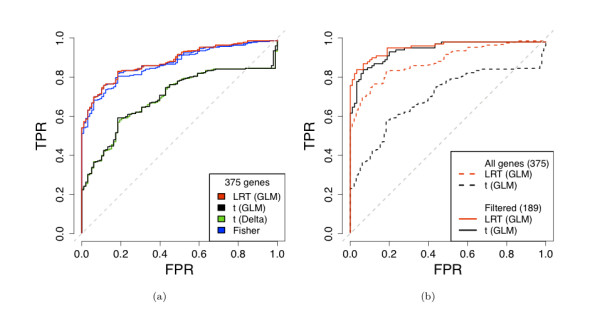
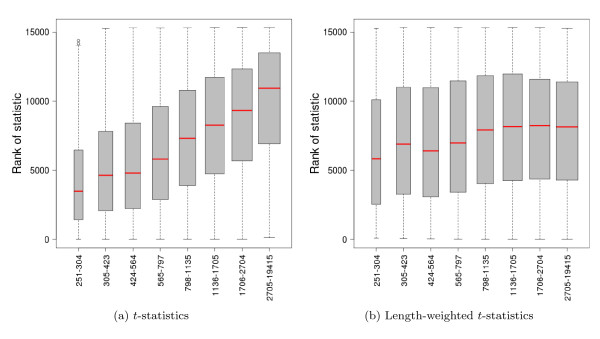
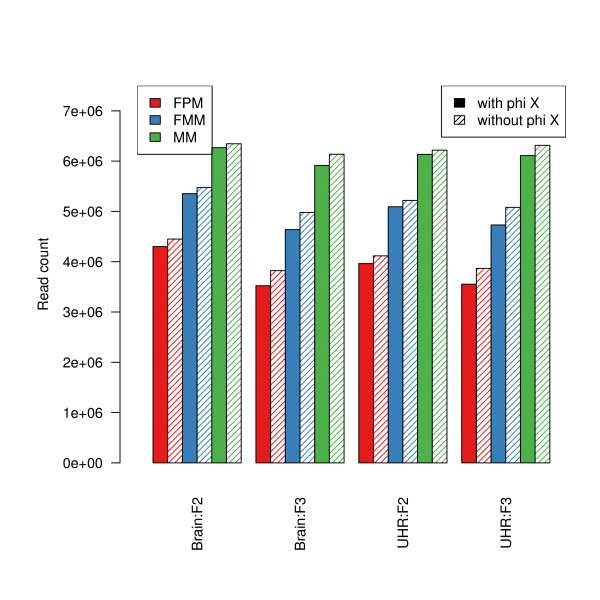
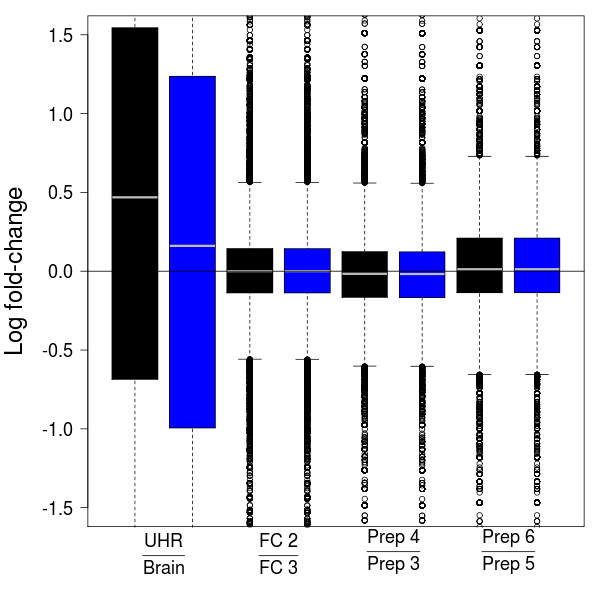
BACKGROUND: High-throughput sequencing technologies, such as the Illumina Genome Analyzer, are powerful new tools for investigating a wide range of biological and medical questions. Statistical and computational methods are key for drawing meaningful and accurate conclusions from the massive and complex datasets generated by the sequencers. We provide a detailed evaluation of statistical methods for normalization and differential expression (DE) analysis of Illumina transcriptome sequencing (mRNA-Seq) data. RESULTS: We compare statistical methods for detecting genes that are significantly DE between two types of biological samples and find that there are substantial differences in how the test statistics handle low-count genes. We evaluate how DE results are affected by features of the sequencing platform, such as, varying gene lengths, base-calling calibration method (with and without phi X control lane), and flow-cell/library preparation effects. We investigate the impact of the read count normalization method on DE results and show that the standard approach of scaling by total lane counts (e.g., RPKM) can bias estimates of DE. We propose more general quantile-based normalization procedures and demonstrate an improvement in DE detection. CONCLUSIONS: Our results have significant practical and methodological implications for the design and analysis of mRNA-Seq experiments. They highlight the importance of appropriate statistical methods for normalization and DE inference, to account for features of the sequencing platform that could impact the accuracy of results. They also reveal the need for further research in the development of statistical and computational methods for mRNA-Seq.
Overview
The claims and statistics of this paper haven’t been checked yet.
Run the check — free, no account needed. It reads the open-access text and checks the sources it cites.
Integrity signals
Registry
Cites
Statistics
Figures
![Figure 8 Comparison of normalization procedures: Goodness-of-fit of Poisson model. The multiplicative Poisson model (GLM 1 in [Additional file 2: Supplemental Table S4]) is fit to the seven Brain lanes in the MAQC-2 experiment after (a) total-count, (b) POLR2A, (c) upper-quartile, and (d) quantile normalization. Goodness-of-fit statistics are computed and displayed in χ2 quantile-quantile plots. Genes with goodness-of-fit statistics in the top quantiles of the χ2-distribution are displayed using colored plotting symbols: red (1, 5]%, purple (.1, 1]%, gold [0, .1]%. Similar plots for UHR show the same patterns.](/paper-figures/d99eb5ce90ee4a9ebac8c9f438b4c283/evaluation-of-statistical-methods-for-normalization-and-differential-expression-figure-8.jpg)
Verification
Claims the paper makes
The claims and statistics of this paper haven’t been checked yet.
Run the check — free, no account needed. It reads the open-access text and checks the sources it cites.
Claims other papers make about this one
Each is checked against this paper’s own text: does it say what the citing paper says it does?
The source backs part of the claim, not all of it — or backs it for a different population, condition or comparison.
In the citing paper
“These approaches rely on normalizing methods that are based on total or effective counts, and tend to perform poorly when samples have heterogeneous transcript distributions, that is, when highly and differentially expressed features can skew the count distribution [45, 46].”
From A survey of best practices for RNA-seq data analysis (2016) · cites this paper as [45]
Experimental — accuracy not yet measuredIn the citing paper
“While reproducibility in RNA-seq is usually high at the level of sequencing [1, 45], other steps such as RNA extraction and library preparation are noisier and may introduce biases in the data that can be minimized by adopting good experimental procedures (Box 2).”
From A survey of best practices for RNA-seq data analysis (2016) · cites this paper as [45]
Self-check
Percentages, sums and reported differences re-computed from the paper’s own numbers.
The self-check needs the paper’s full text.
Citations
Cites
Ultrafast and memory-efficient alignment of short DNA sequences to the human genome.
Langmead, B., Trapnell, C., Pop, M., & Salzberg, S. L. (2009) · Genome Biology · doi:10.1186/gb-2009-10-3-r25 · Cited by 21,849 · cited 1×
“We used Bowtie to map reads to the genome (GRCh37 assembly) [ 16 ].”
Method(2005) · Springer eBooks · doi:10.1007/0-387-27255-0_9 · Cited by 20,333
Mapping and quantifying mammalian transcriptomes by RNA-Seq
Mortazavi, A., Williams, B. A., McCue, K., Schaeffer, L., & Wold, B. (2008) · Nature Methods · doi:10.1038/nmeth.1226 · Cited by 13,696 · cited 6×
“These high-throughput sequencing technologies have already been applied to monitor genome-wide transcription levels (mRNA-Seq), DNA-protein interactions (ChIP-Seq), chromatin structure, and DNA methylation [1-9].”
BackgroundMethodInfluentialSmyth, G. K. (2004) · Statistical Applications in Genetics and Molecular Biology · doi:10.2202/1544-6115.1027 · Cited by 11,829
Exploration, normalization, and summaries of high density oligonucleotide array probe level data
Irizarry, R. A. (2003) · Biostatistics · doi:10.1093/biostatistics/4.2.249 · Cited by 10,603
Base-Calling of Automated Sequencer Traces Using Phred. I. Accuracy AssessmentPreprint
Ewing, B., Hillier, L., Wendl, M. C., & Green, P. (1998) · Genome Research · doi:10.1101/gr.8.3.175 · Cited by 6,993
Base-Calling of Automated Sequencer Traces Using Phred. II. Error Probabilities
Ewing, B., & Green, P. (1998) · Genome Research · doi:10.1101/gr.8.3.186 · Cited by 5,439 · cited 1×
“quality scores for the other seven lanes [[15], Supplementary Information, p. 7]. Bustard can also be run using the auto-calibration method, which scores basecalls in a manner similar to the phred base-caller [ 17 ] and does not require a control lane per flow-cell.”
MethodAlternative isoform regulation in human tissue transcriptomes
Wang, E. T., Sandberg, R., Luo, S., Khrebtukova, I., Zhang, L., Mayr, C., Kingsmore, S. F., Schroth, G. P., & Burge, C. B. (2008) · Nature · doi:10.1038/nature07509 · Cited by 5,181
Accurate whole human genome sequencing using reversible terminator chemistry
Bentley, D. R., Balasubramanian, S., Swerdlow, H. P., Smith, G. P., Milton, J., Brown, C. G., Hall, K. P., Evers, D. J., Barnes, C. L., Bignell, H. R., et al. (2008) · Nature · doi:10.1038/nature07517 · Cited by 3,684 · cited 1×
“quality scores for the other seven lanes [[15], Supplementary Information, p.”
BackgroundRNA-seq: An assessment of technical reproducibility and comparison with gene expression arrays
Marioni, J. C., Mason, C. E., Mane, S. M., Stephens, M., & Gilad, Y. (2008) · Genome Research · doi:10.1101/gr.079558.108 · Cited by 2,771 · cited 7×
“These high-throughput sequencing technologies have already been applied to monitor genome-wide transcription levels (mRNA-Seq), DNA-protein interactions (ChIP-Seq), chromatin structure, and DNA methylation [1-9].”
BackgroundMethodResultInfluential
Research works printed but not linked: 4
- Illumina:Sequencing Analysis Software User Guide For Pipeline Version 1.3 and CASAVA Version 1.0 T. Illumina, Inc.; 2008. [Part # 1005359 Rev. A] [ http://icom.illumina.com/icom/software.ilmn?id=277 ] [Part # 1005359 Rev. A]
- Illumina:Preparing Samples for Sequencing mRNA. Ilumina, Inc.; 2009. [Part # 1004898 Rev. A] [ http://icom.illumina.com/icom/software.ilmn?id=277 ] [Part # 1004898 Rev. A]
- Taub MA: Analysis of high-throughput biological data: some statistical problems in RNA-seq and mouse genotyping. PhD thesis. Department of Statistics, UC Berkeley; 2009.
- Irizarry RA, Hobbs B, Collin F, Beazer-Barclay YD, Antonellis KJ, Scherf U, Speed TP: Exploration, normalization, and summaries of high density oligonucleotide array probe level data. Biostatistics 2003, 4(1465–4644 (Print)):249–64. 10.1093/biostatistics/4.2.249 · DOI · Paper page
Cited by
Sorted by citations
Items 901–999 of 999
Mains, R. E., Blaby, C., Rheaume, B. A., & Eipper, B. A. (2018) · Endocrinology · doi:10.1210/en.2018-00235 · Cited by 11
Single-cell transcriptomes reveal the mechanism for a breast cancer prognostic gene panel
Li, S. C., Stucky, A., Chen, X., Kabeer, M. H., Loudon, W. G., Plant, A., Torno, L. R., Nangia, C. S., Cai, J., Gang, Z., et al. (2018) · Oncotarget · doi:10.18632/oncotarget.26044 · Cited by 13
“[28] Read counts per gene in all samples were normalized using Upper Quartile normalization [29] and analyzed for differential expression using Partek’s Gene Specific Analysis method (genes with less than 10 reads in any sample were excluded).”
MethodCastillo-Castañeda, A. C., Cañas-Duarte, S. J., Guevara‐Suarez, M., Guarro, J., Restrepo, S., & Ramírez, A. M. C. (2020) · Microbiology · doi:10.1099/mic.0.000927 · Cited by 13
“Despite that being widely accepted [44, 45] we have corroborated our results by qRT- PCR, which is the gold standard for quantifying the level of expression of genes under different conditions [46].”
ResultDelgado-Chaves, F. M., Gómez-Vela, F., Divina, F., García-Torres, M., & Rodríguez–Baena, D. S. (2020) · Genes · doi:10.3390/genes11070831 · Cited by 13
“By convention, a sequencing depth per gene below 10 is considered neglectable [57,58].”
BackgroundHighly conserved sperm function-related transcripts across three species: human, rat and mouse
Bianchi, E., Stermer, A. R., Nolan, T. M., Li, H., Hall, S., Boekelheide, K., Sigman, M., & Hwang, K. (2021) · Reproductive Toxicology · doi:10.1016/j.reprotox.2021.06.012 · Cited by 13
YbdO Promotes the Pathogenicity of Escherichia coli K1 by Regulating Capsule Synthesis
Fan, Y., Sun, H., Yang, W., Bai, J., Liu, P., Huang, M., Guo, X., Yang, B., & Feng, L. (2022) · International Journal of Molecular Sciences · doi:10.3390/ijms23105543 · Cited by 13
“RNA-seq analysis of genes exhibiting low expression can lead to relatively large fold biases and inaccurate results [48].”
First Trimester Maternal Plasma Aberrant miRNA Expression Associated with Spontaneous Preterm Birth
Mavreli, D., Theodora, M., Avgeris, M., Papantoniou, N., Antsaklis, P. G., Daskalakis, G. J., & Kοlialexi, A. (2022) · International Journal of Molecular Sciences · doi:10.3390/ijms232314972 · Cited by 14
“All counts were normalized by reads per million [39].”
Method‘OMICS-based’ Biomarkers for Environmental Health Studies
Espín-Pérez, A., Krauskopf, J., de Kok, T. M. C. M., & Kleinjans, J. C. S. (2014) · Current Environmental Health Reports · doi:10.1007/s40572-014-0028-6 · Cited by 13
Zhang, H., Xu, J., Jiang, N., Hu, X., & Luo, Z. (2015) · Statistics in Medicine · doi:10.1002/sim.6449 · Cited by 13
Cluster Analysis of RNA-Sequencing Data
Liu, P., & Si, Y. (2014) · Springer eBooks · doi:10.1007/978-3-319-07212-8_10 · Cited by 13
MGMR: leveraging RNA-Seq population data to optimize expression estimation
Rozov, R., Halperin, E., & Ron Shamir, A. (2012) · BMC Bioinformatics · doi:10.1186/1471-2105-13-s6-s2 · Cited by 13
contamDE: differential expression analysis of RNA-seq data for contaminated tumor samples
Shen, Q., Hu, J., Jiang, N., Hu, X., Luo, Z., & Zhang, H. (2015) · Bioinformatics · doi:10.1093/bioinformatics/btv657 · Cited by 13
Transcriptome analysis in heart failure
Matkovich, S. J. (2016) · Current Opinion in Cardiology · doi:10.1097/hco.0000000000000275 · Cited by 13
“However, their accuracy and performance have been compared by independent groups [11,19,20].”
BackgroundA unique CD8+ T lymphocyte signature in pediatric type 1 diabetes
Hamel, Y., Mauvais, F., Pham, H., Kratzer, R., Marchi, C., Barilleau, É., Waeckel-Énée, E., Arnoux, J., Hartemann, A., Cordier, C., et al. (2016) · Journal of Autoimmunity · doi:10.1016/j.jaut.2016.06.003 · Cited by 13
Kang, H. G., Seo, H., Lim, J. H., Kim, J., Han, K. H., Park, H. W., Koo, J. W., Kim, K. H., Kim, J. H., Cheong, H. I., et al. (2017) · Journal of International Medical Research · doi:10.1177/0300060516652762 · Cited by 13
“Variancestabilizing normalization and upper-quartile normalization were applied to the boost sensitivity without a loss of specificity.(33) The DEGs were obtained from one-way analyses of variance (ANOVA) for 950 Journal of International Medical Research 45(3)”
MethodA Unified Model for Joint Normalization and Differential Gene Expression Detection in RNA-Seq Data
Liu, K., Ye, J., Yang, Y., Shen, L., & Jiang, H. (2018) · IEEE Transactions on Computational Biology and Bioinformatics · doi:10.1109/tcbb.2018.2790918 · Cited by 13
“This include CPM/RPM (counts/reads per million) [8], upper-quartile normalization [11], trimmedmean of M values [8] andDESeq normalization [12].”
Patchett, A. L., Wilson, R., Charlesworth, J., Corcoran, L. M., Papenfuss, A. T., Lyons, B. A., Woods, G. M., & Tovar, C. (2018) · Oncotarget · doi:10.18632/oncotarget.24634 · Cited by 13
“Expression levels were normalized by upper quartile normalisation using EDAseq [70, 71].”
MethodIdentification of novel ΔNp63α-regulated miRNAs using an optimized small RNA-Seq analysis pipeline
Sakaram, S., Craig, M. P., Hill, N. T., Aljagthmi, A. A., Garrido, C. M., Paliy, O., Bottomley, M. A., Raymer, M. L., & Kadakia, M. (2018) · Scientific Reports · doi:10.1038/s41598-018-28168-5 · Cited by 13
Drejeris, R., & Miceikienė, A. (2018) · Sustainability · doi:10.3390/su10093347 · Cited by 13
“When it is known which key financial ratio indicators show an improvement or a negative development, one can go into financial statements to examine the reasons for such changes [29].”
BackgroundInference of Gene Co-expression Networks from Single-Cell RNA-Sequencing Data
Lamere, A. T., & Li, J. (2019) · Methods in molecular biology · doi:10.1007/978-1-4939-9057-3_10 · Cited by 13
Improving single-cell transcriptome sequencing efficiency with a microfluidic phase-switch device
Zhang, B., Xu, H., Huang, Y., Shu, W., Feng, H., Cai, J., Zhong, J. F., & Chen, Y. (2019) · The Analyst · doi:10.1039/c9an00823c · Cited by 13
Ljungberg, L. U., Zegeye, M. M., Kardeby, C., Fälker, K., Repsilber, D., & Sirsjö, A. (2020) · Mediators of Inflammation · doi:10.1155/2020/4623107 · Cited by 13
“First, read numbers were normalized with respect to total numbers of reads and compositional differences between the libraries [20], followed by fitting a two-factorial block design (knockdown/no knockdown, and experimental block in 1 : 4, representing the four replicates) with a linear model, separately for the cases…”
MethodAn Integrating Immune-Related Signature to Improve Prognosis of Hepatocellular Carcinoma
Zhu, R., Guo, W., Xu, X., & Zhu, L. (2020) · Computational and Mathematical Methods in Medicine · doi:10.1155/2020/8872329 · Cited by 13
“Additionally, in this study, the expression of RNA-seq was normalized by log2 (FPKM-UQ+1), of which FPKM-UQ [39, 40] is a modified version of the FPKM [41, 42] (the values of FPKM-UQ were provided by TCGA database).”
MethodUsing normalization to resolve RNA-Seq biases caused by amplification from minimal input
Ager-Wick, E., Henkel, C. V., Haug, T. M., & Weltzien, F. (2014) · Physiological Genomics · doi:10.1152/physiolgenomics.00196.2013 · Cited by 13
What Is the Transcriptome and How it is Evaluated?
Assis, A. F., de Oliveira, E. H. D., Donate, P. B., Giuliatti, S., Nguyen, C., & Passos, G. A. S. (2014) · Springer eBooks · doi:10.1007/978-3-319-11985-4_1 · Cited by 14
Co-expression analysis is biased by a mean-correlation relationshipPreprint
Wang, Y., Hicks, S. C., & Hansen, K. D. (2020) · bioRxiv (Cold Spring Harbor Laboratory) · doi:10.1101/2020.02.13.944777 · Cited by 13
“This model has been experimentally verified (Marioni et al., 2008; Bullard et al., 2010).”
Self-citationGeneCloudOmics: A Data Analytic Cloud Platform for High-Throughput Gene Expression Analysis
Helmy, M., Agrawal, R., Ali, J., Soudy, M., Bui, T. T., & Selvarajoo, K. (2021) · Frontiers in Bioinformatics · doi:10.3389/fbinf.2021.693836 · Cited by 13
“…raw read counts, the user can choose one of the normalization options: Fragments Per Kilobase Million (FPKM), Reads Per Kilobase Million (RPKM), Transcripts Per Kilobase Million (TPM) (Li et al., 2015), Remove Unwanted Variation (RUV) (Risso et al., 2014) or Upper Quartile (Bullard et al., 2010).”
BackgroundDepth normalization of small RNA sequencing: using data and biology to select a suitable method
Düren, Y., Lederer, J., & Qin, L. (2022) · Nucleic Acids Research · doi:10.1093/nar/gkac064 · Cited by 13
“Different normalization methods may lead to different analysis results, and no method has been found to work systematically best in studies comparing the performance of these methods (10,13–16).”
Lohani, N., Golicz, A. A., Allu, A. D., Bhalla, P. L., & Singh, M. B. (2023) · Plant Cell Reports · doi:10.1007/s00299-022-02960-0 · Cited by 12
Evolution of structural rearrangements in prostate cancer intracranial metastases
Khani, F., Hooper, W. F., Wang, X., Chu, T. R., Shah, M. J., Winterkorn, L. H., Sigouros, M., Conteduca, V., Pisapia, D. J., Wobker, S. E., et al. (2023) · npj Precision Oncology · doi:10.1038/s41698-023-00435-3 · Cited by 13
“Nanostring raw counts were normalized by a RUVSeq-based process 57 , which performs both upper quartile normalization 58 and normalization with RUVg 59 to estimate RUV factors using the endogenous housekeeping genes.”
Addressing erroneous scale assumptions in microbe and gene set enrichment analysis
McGovern, K. C., Nixon, M. P., & Silverman, J. D. (2023) · PLoS Computational Biology · doi:10.1371/journal.pcbi.1011659 · Cited by 11
Chéron, J., Beccari, L. L., Hagué, P., Icick, R., Despontin, C., Carusone, T. M., Defrance, M., Bhogaraju, S., Martín‐García, E., Capellán, R., et al. (2023) · Nature Communications · doi:10.1038/s41467-023-44120-2 · Cited by 12
Chen, L. (2012) · Statistics in Biosciences · doi:10.1007/s12561-012-9064-7 · Cited by 14
Atallah, J., Plachetzki, D. C., Jasper, W. C., & Johnson, B. R. (2013) · PLoS ONE · doi:10.1371/journal.pone.0084160 · Cited by 12
Identification of significant features in DNA microarray data
Bair, E. (2013) · Wiley Interdisciplinary Reviews Computational Statistics · doi:10.1002/wics.1260 · Cited by 12
JCDB: a comprehensive knowledge base for Jatropha curcas, an emerging model for woody energy plants
Zhang, X., Pan, B.-Z., Chen, M.-S., Chen, W., Li, J., Xu, Z., & Liu, C. (2019) · BMC Genomics · doi:10.1186/s12864-019-6356-z · Cited by 12
“For digital gene expression data, read count tables were created using htseq-count in the HTSeq toolkit [44] and then normalized using the DESeq method [45].”
MethodRegulatory Divergence among Beta-Keratin Genes during Bird Evolution
Bhattacharjee, M. J., Yu, C.-P., Lin, J.-J., Ng, C. S., Wang, T., Lin, H.-H., & Li, W. (2016) · Molecular Biology and Evolution · doi:10.1093/molbev/msw165 · Cited by 12
“To compare expression of the selected genes across the conditions, we applied the upper quartile normalization procedure (Bullard et al. 2010).”
MethodFroussios, K., Schurch, N., Mackinnon, K., Gierliński, M., Duc, C., Simpson, G. G., & Barton, G. J. (2019) · Bioinformatics · doi:10.1093/bioinformatics/btz089 · Cited by 12
Poisson hurdle model-based method for clustering microbiome features
Qiao, Z., Barnes, E. M., Tringe, S. G., Schachtman, D. P., & Liu, P. (2022) · Bioinformatics · doi:10.1093/bioinformatics/btac782 · Cited by 11
Extracellular vesicle miRNome during subclinical mastitis in dairy cows
Cuccato, M., Divari, S., Giannuzzi, D., Grange, C., Moretti, R., Rinaldi, A., Leroux, C., Sacchi, P., & Cannizzo, F. T. (2024) · Veterinary Research · doi:10.1186/s13567-024-01367-x · Cited by 11
“Differential analysis was performed by comparing samples according to their SCC threshold level of 200 000 cells/ mL. Counts from expressed genes were first normalized with the calcNormFactors() function [37].”
MethodGenomic Characteristics Related to Histology-Based Immune Features in Breast Cancer
Cha, Y. J., O'Connell, C. E., Calhoun, B. C., Felsheim, B., Fernández-Martínez, A., Fan, C., Brueffer, C., Larsson, C., Borg, Å., Saal, L. H., et al. (2025) · Modern Pathology · doi:10.1016/j.modpat.2025.100736 · Cited by 11
Kim, S.-I., Ma, X., Kong, L., Guo, W., Xu, L., Shan, L., Zhang, R., & He, P. (2025) · Genome biology · doi:10.1186/s13059-025-03529-2 · Cited by 11
Functional Genomics, Proteomics, Metabolomics and Bioinformatics for Systems Biology
Ballereau, S. J., Glaab, E., Kolodkin, A. N., Chaiboonchoe, A., Biryukov, M., Vlassis, N. A., Ahmed, H., Pellet, J., Baliga, N. S., Hood, L., et al. (2013) · Springer eBooks · doi:10.1007/978-94-007-6803-1_1 · Cited by 10
Exploring the transcriptome space of a recombinant BHK cell line through next generation sequencing
Johnson, K. C., Yongky, A., Vishwanathan, N., Jacob, N. M., Jayapal, K. P., Goudar, C. T., Karypis, G., & Hu, W. (2013) · Biotechnology and Bioengineering · doi:10.1002/bit.25135 · Cited by 11
A Note on an Exon-Based Strategy to Identify Differentially Expressed Genes in RNA-Seq Experiments
Laiho, A., & Elo, L. L. (2014) · PLoS ONE · doi:10.1371/journal.pone.0115964 · Cited by 12
AUCTSP: an improved biomarker gene pair class predictor
Kagaris, D., Khamesipour, A., & Yiannoutsos, C. T. (2018) · BMC Bioinformatics · doi:10.1186/s12859-018-2231-1 · Cited by 11
“As a non-parametric based technique, AUCTSP can also have potential benefits in areas such as RNA sequence analysis (see, e.g. [ 34]), but this extension is left for future work.”
Höök, L., Leal, L. G., Talla, V., & Backström, N. (2019) · Genome Biology and Evolution · doi:10.1093/gbe/evz176 · Cited by 11
“…Advance Access publication August 10, 2019 2647 D ow nloaded from https://academ ic.oup.com /gbe/article-abstract/11/9/2633/5545957 by guest on 15 N ovem ber 2019 (highly expressed) genes escapes downregulation in the same way as during human X-inactivation (Carrel et al. 1999).”
BackgroundInfluentialA systematic comparison of normalization methods for eQTL analysis
Yang, J., Wang, D., Yang, Y., Yang, W., Jin, W., Niu, X., & Gong, J. (2021) · Briefings in Bioinformatics · doi:10.1093/bib/bbab193 · Cited by 10
MUREN: a robust and multi-reference approach of RNA-seq transcript normalization
Feng, Y., & Li, L. M. (2021) · BMC Bioinformatics · doi:10.1186/s12859-021-04288-0 · Cited by 10
Perez, M. F., & Sarkies, P. (2021) · Genome biology · doi:10.1186/s13059-021-02541-6 · Cited by 11
“read counts rather than total read count, so as to exclude the influence of a minority of highly expressed genes [23].”
Zandavi, S. M., Koch, F. C., Vijayan, A., Zanini, F., Valdés‐Mora, F., Gallego‐Ortega, D., & Vafaee, F. (2022) · Nucleic Acids Research · doi:10.1093/nar/gkac436 · Cited by 11
“The default setting was chosen to select a top ranked method among scone library wrapper (31), upperquartile scaling normalization (32), full-quantile normalization (33), and relative log-expression scaling normalization (34).”
MethodPre- and Post-Processing Workflow for Affinity Purification Mass Spectrometry Data
Fischer, M., Zilkenat, S., Gerlach, R. G., Wagner, S., & Renard, B. Y. (2014) · Journal of Proteome Research · doi:10.1021/pr401249b · Cited by 11
Zebrafish-Based Systems Pharmacology of Cancer Metastasis
Shimada, Y., Nishimura, Y., & Tanaka, T. (2014) · Methods in molecular biology · doi:10.1007/978-1-4939-0856-1_15 · Cited by 11
Hovhannisyan, H., & Gabaldón, T. (2018) · Current topics in microbiology and immunology · doi:10.1007/82_2018_122 · Cited by 11
Linnstaedt, S. D., Pan, Y., Mauck, M. C., Sullivan, J., Zhou, C. Y., Jung, L., Rueckeis, C. A., Blount, J. D., Carson, M. S., Tungate, A. S., et al. (2018) · Frontiers in Psychiatry · doi:10.3389/fpsyt.2018.00597 · Cited by 11
“Raw RSEM read counts for all samples were normalized to the overall upper quartile (59) before comparison and visualization.”
MethodBlount, J. R., Meyer, D. N., Akemann, C., Johnson, S. L., Gurdziel, K., Baker, T. R., & Todi, S. V. (2019) · Biology Open · doi:10.1242/bio.043372 · Cited by 8
“, 2012) as well as the length of the identified genes (Bullard et al., 2010).”
BackgroundReis, A. L. M., Deveson, I. W., Wong, T., Madala, B. S., Barker, C., Blackburn, J., Marcellin, E., & Mercer, T. R. (2020) · Nature Communications · doi:10.1038/s41467-020-17445-5 · Cited by 11
Subedi, S. D., & Browne, R. P. (2020) · Stat · doi:10.1002/sta4.310 · Cited by 11
“A numberof initial works on univariate analysis fora count variable from next-generation sequencing data focused on a Poisson model (Bullard et al., 2010; Marioni et al., 2008; Witten et al., 2010).”
BackgroundZhao, L., Zhang, J., Xuan, S., Liu, Z., Wang, Y., & Zhao, P. (2021) · Frontiers in Cell and Developmental Biology · doi:10.3389/fcell.2021.600506 · Cited by 10
“Before performing the differential gene expression analysis, lowabundance genes with raw counts <10 in more than 75% of samples were removed (Bullard et al., 2010).”
Using RNA-seq Data to Detect Differentially Expressed Genes
Lorenz, D. J., Gill, R. S., Mitra, R., & Datta, S. (2014) · Springer eBooks · doi:10.1007/978-3-319-07212-8_2 · Cited by 11
Sun, W., Liu, Y., Crowley, J. J., Chen, T., Zhou, H., Chu, H., Huang, S., Kuan, P. F., Li, Y., Miller, D. R., et al. (2015) · Journal of the American Statistical Association · doi:10.1080/01621459.2015.1040880 · Cited by 11
Barron, M., Zhang, S., & Li, J. (2017) · Nucleic Acids Research · doi:10.1093/nar/gkx1113 · Cited by 11
DFI: gene feature discovery in RNA-seq experiments from multiple sources
Özer, H. G., Parvin, J. D., & Huang, K. (2012) · BMC Genomics · doi:10.1186/1471-2164-13-s8-s11 · Cited by 11
Development of Reference Genes for Horticultural Plants
Ahmed, U., Xie, Q., Shi, X., & Zheng, B. (2022) · Critical Reviews in Plant Sciences · doi:10.1080/07352689.2022.2084227 · Cited by 10
“Rather, they deal with reads count normalization to regulate potential technical effects and diverse lane sequencing depths (Bullard et al., 2010).”
BackgroundTranscriptomic analysis of genes: expression and regulation
Horta, M. A. C., Pimenta, R. J. G., Almeida, D. A., Rosolen, R. R., Aono, A. H., Filho, J. A. F., de Oliveira, F. A., Niederauer, G. F., Ferreira, R. C. U., Bajay, S. K., et al. (2022) · Elsevier eBooks · doi:10.1016/b978-0-323-91810-7.00017-0 · Cited by 10
Compositionally aware estimation of cross-correlations for microbiome data
Jensen, I. T., Janss, L., Radutoiu, S., & Waagepetersen, R. P. (2024) · PLoS ONE · doi:10.1371/journal.pone.0305032 · Cited by 9
“We compare the methods considered using simulations from models that are more complex and realistic than (1), see the section “Simulation models”.”
ML-GAP: machine learning-enhanced genomic analysis pipeline using autoencoders and data augmentation
Ağraz, M., Göksülük, D., Zhang, P., Choi, B., Clements, R., Choudhary, G., & Karniadakis, G. E. (2024) · Frontiers in Genetics · doi:10.3389/fgene.2024.1442759 · Cited by 10
“…techniques, such as the trimmed mean of M-values, upper quantile, Reads Per Kilobase per Million mapped reads (RPKM), and the logarithm of counts per million reads (log-CPM), are discussed in pertinent literature (Bullard et al., 2010; Mortazavi et al., 2008; Robinson and Oshlack, 2010).”
BackgroundPourmajidian, M., Hansen, J. Y., Shafiei, G., Mišić, B., & Dagher, A. (2026) · PLoS Biology · doi:10.1371/journal.pbio.3003619 · Cited by 11
“Expression values were log 2 transformed and normalized using the upper quartile method [204–206].”
Comparative analysis of zygospore transcripts during early germination in Chlamydomonas reinhardtii
Aoyama, H., Saitoh, S., Kuroiwa, T., & Nakamura, S. (2014) · Journal of Plant Physiology · doi:10.1016/j.jplph.2014.07.016 · Cited by 11
Differential expression analysis for sequence count data via mixtures of negative binomials
Bonafede, E. (2015) · AMS Dottorato Institutional Doctoral Theses Repository (University of Bologna) · doi:10.6092/unibo/amsdottorato/6741 · Cited by 9
Sheep skeletal muscle transcriptome analysis reveals muscle growth regulatory lncRNAs
Chao, T., Ji, Z., Hou, L., Wang, J., Zhang, C., Wang, G., & Wang, J. (2018) · PeerJ · doi:10.7717/peerj.4619 · Cited by 10
“Then, we normalized the expression matrix using upper-quartile (UQ) normalization from EDASeq (Bullard et al., 2010).”
MethodFinite mixtures of matrix variate Poisson-log normal distributions for three-way count data
Silva, A., Qin, X., Rothstein, S. J., McNicholas, P. D., & Subedi, S. D. (2023) · Bioinformatics · doi:10.1093/bioinformatics/btad167 · Cited by 10
“While some early work utilized the Poisson distribution to model such count data (Marioni et al. 2008; Bullard et al. 2010), this was not ideal because of its restrictive mean–variance relationship, and so the negative binomial distribution emerged as the uni-variate distribution of choice (Love et…”
MethodChowdhury, T. R., Bramer, L., Brown, J., Kim, Y., Zink, E., Metz, T., McCue, L. A., Diefenderfer, H. L., & Bailey, V. (2022) · Microorganisms · doi:10.3390/microorganisms10081653 · Cited by 10
“Count data were screened for changes in relative abundance based on upper 75th-quartile normalized library counts (Bullard et al., 2010 [35]).”
MethodUBASH3A Interacts with PTPN22 to Regulate IL2 Expression and Risk for Type 1 Diabetes
Newman, J. R. B., CONCANNON, P. J., & Ge, Y. (2023) · International Journal of Molecular Sciences · doi:10.3390/ijms24108671 · Cited by 10
Designing alternative splicing RNA-seq studies. Beyond generic guidelines
Attolini, C. S., Peña, V., & Rossell, D. (2015) · Bioinformatics · doi:10.1093/bioinformatics/btv436 · Cited by 10
“We used quantile normalization, which Bullard et al. (2010) found useful for RNA-seq data, followed by the linear model adjustment ĝgij 1⁄4 ~ggij xjb̂gi, where ~ggij are raw expression estimates, xj a covariate vector (e.g. batches) and b̂gi the least-squares estimate from regressing ~ggij on xj and the group indicato…”
MethodInfluentialLinville, J. L., Rodríguez‐Barranco, M., Brown, S. D., Mielenz, J. R., & Cox, C. D. (2014) · BMC Microbiology · doi:10.1186/s12866-014-0215-5 · Cited by 9
A bi-Poisson model for clustering gene expression profiles by RNA-seq
Wang, N., Wang, Y., Hao, H., Wang, L., Wang, Z., Wang, J. J., & Wu, R. (2013) · Briefings in Bioinformatics · doi:10.1093/bib/bbt029 · Cited by 10
Transcriptomic analysis of cobalt stress in the marine yeastDebaryomyces hansenii
Gumá-Cintrón, Y., Bandyopadhyay, A. A., Rosado, W., Shu-Hu, W., & Govind, N. S. (2015) · FEMS Yeast Research · doi:10.1093/femsyr/fov099 · Cited by 8
“To adjust for the variability in sequencing depth using the upper quantile normalization procedure (Bullard et al. 2010).”
MethodZhou, Y., Wang, G., Zhang, J., & Li, H. (2017) · PLoS ONE · doi:10.1371/journal.pone.0169594 · Cited by 10
Physiological RNA dynamics in RNA-Seq analysis
Xu, Z., & Asakawa, S. (2018) · Briefings in Bioinformatics · doi:10.1093/bib/bby045 · Cited by 11
Birk, M. S., Ahmed-Begrich, R., Tran, S., Elsholz, A. K. W., Frese, C. K., & Charpentier, E. (2021) · mSystems · doi:10.1128/msystems.00215-21 · Cited by 11
“We corrected for compositional bias in the data set using upper quartile (UQ) normalization (68) (edgeR package, https://bioconductor .”
MethodBeach, N. K., Myers, K. S., Owen, B. R., Seib, M. D., Donohue, T. J., & Noguera, D. R. (2021) · mSystems · doi:10.1128/msystems.00906-21 · Cited by 10
“Gene counts were normalized with reads per kilobase per million (RPKM) (102).”
Multifactorial Inheritance and Complex Diseases
Fialkowski, A., Beasley, T. M., & Tiwari, H. K. (2019) · Elsevier eBooks · doi:10.1016/b978-0-12-812537-3.00011-1 · Cited by 10
Young, M. D., McCarthy, D. J., Wakefield, M. J., Smyth, G. K., Oshlack, A., & Robinson, M. D. (2011) · Springer eBooks · doi:10.1007/978-1-4614-0782-9_10 · Cited by 12
Nguyen, Y., Nettleton, D. S., Liu, H., & Tuggle, C. K. (2015) · Journal of Agricultural Biological and Environmental Statistics · doi:10.1007/s13253-015-0226-1 · Cited by 10
“A variety of normalization offsets have been proposed in the literature (see, e.g., Marioni et al. 2008; Mortazavi et al. 2008; Robinson and Oshlack 2010; Anders and Huber 2010; Bullard et al. 2010; Risso et al. 2014a,b, and references therein).”
BackgroundMethodInfluentialStatistical Methods for Overdispersion in mRNA-Seq Count Data
Zhang, H., Pounds, S. B., & Li, T. (2013) · The Open Bioinformatics Journal · doi:10.2174/1875036201307010034 · Cited by 10
Millett, B. P., Gao, L., Iorizzo, M., Carputo, D., & Bradeen, J. M. (2015) · Phytopathology · doi:10.1094/phyto-10-14-0291-r · Cited by 10
“In these analyses, RB transcript levels from 2006 and 2008 were scaled using the upper 1132 PHYTOPATHOLOGY quartile values (Bullard et al. 2010).”
MethodA hidden Markov-model for gene mapping based on whole-genome next generation sequencing data
Claesen, J., & Burzykowski, T. (2014) · Statistical Applications in Genetics and Molecular Biology · doi:10.1515/sagmb-2014-0007 · Cited by 10
LPEseq: Local-Pooled-Error Test for RNA Sequencing Experiments with a Small Number of Replicates
Gim, J., Won, S., & Park, T. (2016) · PLoS ONE · doi:10.1371/journal.pone.0159182 · Cited by 11
“[16] considered two types of biological samples: Ambion’s human brain reference RNA and Stratagene’s human universal reference RNA, referred to as Brain and UHR, respectively.”
BackgroundTag-Count Analysis of Large-Scale Proteomic Data
Branson, O. E., & Freitas, M. A. (2016) · Journal of Proteome Research · doi:10.1021/acs.jproteome.6b00554 · Cited by 11
“As 26–28 Once TMM normalization is completed, a “common” dispersion parameter is estimated using a quantile-adjusted conditional maximum likelihood approach.”
MethodDBNorm: normalizing high-density oligonucleotide microarray data based on distributions
Meng, Q., Catchpoole, D. R., Skillicorn, D. B., & Kennedy, P. J. (2017) · BMC Bioinformatics · doi:10.1186/s12859-017-1912-5 · Cited by 10
“A number of normalization methods have been proposed such as Average Difference (AvgDiff) [c], Total Count (TC) [2], and Trimmed Mean of M values (TMM) [15].”
MethodO’Conner, S., Neudorf, A., Zheng, W., Qi, M., Zhao, X., Du, C., Nettleton, D. S., & Li, L. (2018) · Springer eBooks · doi:10.1007/978-3-319-92958-3_6 · Cited by 10
Statistical Assessment of Depth Normalization for Small RNA Sequencing
Qin, L., Zou, J., Shi, J., Lee, A., Mihailovic, A., Farazi, T. A., Tuschl, T., & Singer, S. (2020) · JCO Clinical Cancer Informatics · doi:10.1200/cci.19.00118 · Cited by 10
“Many of these methods were developed in the context of differential expression analysis, and their performance has been assessed mostly using parametrically simulated data and/or cell-line–mixture data that may not realistically reflect the distributional characteristics of sequencing data.(1,2,4) We set out to develo…”
MethodStatistical strategies for microRNAseq batch effect reduction.
Guo, Y. P., Zhao, S., Su, P.-F., Li, C.-I., Ye, F., Flynn, C. R., & Shyr, Y. (2014) · PubMed · doi:10.3978/j.issn.2218-676x.2014.06.05 · Cited by 10
Systematic benchmarking of statistical methods to assess differential expression of circular RNAs
Buratin, A., Bortoluzzi, S., & Gaffo, E. (2023) · Briefings in Bioinformatics · doi:10.1093/bib/bbac612 · Cited by 12
“Nevertheless, a thorough comparison of normalization procedures as in previous works [61] was not our aim and warrants a dedicated study.”
Resultvan Lingen, H. J., Diez, M. S., & Saccenti, E. (2024) · Biochimica et Biophysica Acta (BBA) - Gene Regulatory Mechanisms · doi:10.1016/j.bbagrm.2024.195058 · Cited by 14
Baile, M. G., Jones, J. G., Sahr, N. A., & Shankar, G. (2025) · The AAPS Journal · doi:10.1208/s12248-025-01054-5 · Cited by 9
“Normalization was performed using RUVseq by performing upper quartile normalization (18) and then normalization via RUVg (19).”
POPE: Pipeline of Parentally-Biased Expression
Missirian, V., Henry, I. M., Comai, L., & Filkov, V. (2012) · Lecture notes in computer science · doi:10.1007/978-3-642-30191-9_17 · Cited by 9
Broumand, A., & Hu, T. (2015) · IEEE Global Conference on Signal and Information Processing · doi:10.1109/globalsip.2015.7418377 · Cited by 8
“Since the number of reads obtained from a gene increases with its transcript length, longer transcripts are more likely to be identified as significantly DE genes [13], [14].”
Background
Metadata
- Authors
- Bullard, J. H., Purdom, E., Hansen, K. D., & Dudoit, S.
- Affiliations
- University of California, Berkeley (US)
- Corresponding author
- Bullard, James H
- Venue
- BMC Bioinformatics
- Published
- 2010-02-18
- Volume
- 11
- Issue
- 1
- Pages
- 94-94
- ISSN
- 1471-2105 (ISSN-L)
- PMC
- PMC2838869
- OpenAlex
- W2156631105
- Cited by
- 1,680
- References
- 23
- Citations by year
- 2026: 29 · 2025: 51 · 2024: 69 · 2023: 68 · 2022: 92 · 2021: 132 · 2020: 127 · 2019: 123 · 2018: 123 · 2017: 133 · 2016: 121 · 2015: 129 · 2014: 161 · 2013: 128 · 2012: 98
- FWCI
- 41.79
- Type
- journal article
- Language
- en
- Open access
- gold
- doi.org
- Licence
- Locations
- BMC Bioinformatics (publishedVersion, cc-by)
- PubMed Central (publishedVersion, cc-by)
- PubMed (publishedVersion)
- Collection of Biostatistics Research Archive (submittedVersion)
- DOAJ (DOAJ: Directory of Open Access Journals) (submittedVersion, cc-by-sa)
- eScholarship (California Digital Library) (submittedVersion)
- Funders
- National Science Foundation
- National Institutes of Health
- National Human Genome Research Institute (U01HG004271)
- Topics
- Life Sciences › Biochemistry, Genetics and Molecular Biology › Molecular Biology › Gene expression and cancer classification
- Life Sciences › Biochemistry, Genetics and Molecular Biology › Molecular Biology › Genomics and Phylogenetic Studies
- Life Sciences › Biochemistry, Genetics and Molecular Biology › Molecular Biology › Single-cell and spatial transcriptomics
- Keywords
- mRNA-seq, read count normalization, differential gene expression, method comparison
- MeSH terms
- RNA, Messenger, Sequence Analysis, RNA, Computational Biology, Databases, Genetic
About these checks
Registry, retraction, Cites and statistics results are computed, not judged, with one exception: a printed reference that no index lists is read once by a model before it counts as a citation error. Claims are extracted by a model and kept only when their quote appears verbatim in the text; each cited source is then checked, with a model’s help, for whether it says what the claim relies on. Those verdicts can be wrong — read the claim’s quote and the cited source before relying on one.
Statistics and arithmetic are recomputed, not judged.
Confidence bands are shown only for fields calibrated on our annotated test set. None is calibrated yet, so no band is shown.
What counts as a claim ›How we measure confidence ›How we check this ›
Are you an author, or do you see a problem with this page? Request a review
