

The DOI matches its Crossref record; 22 of the 23 references it cites were found in a registry or an index.
Evaluation of statistical methods for normalization and differential expression in mRNA-Seq experiments
Open accessAbstract
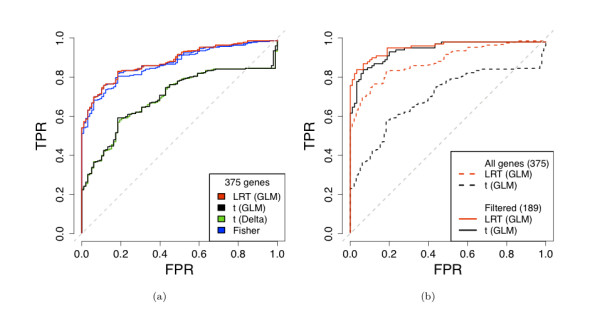
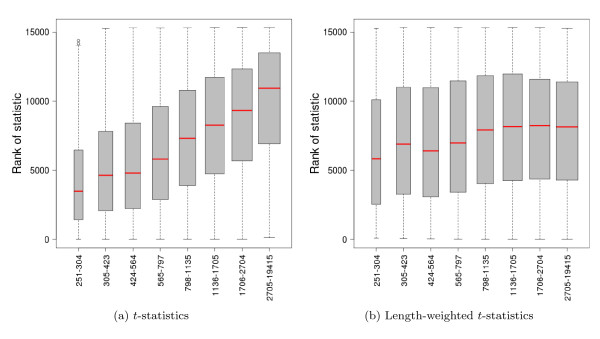
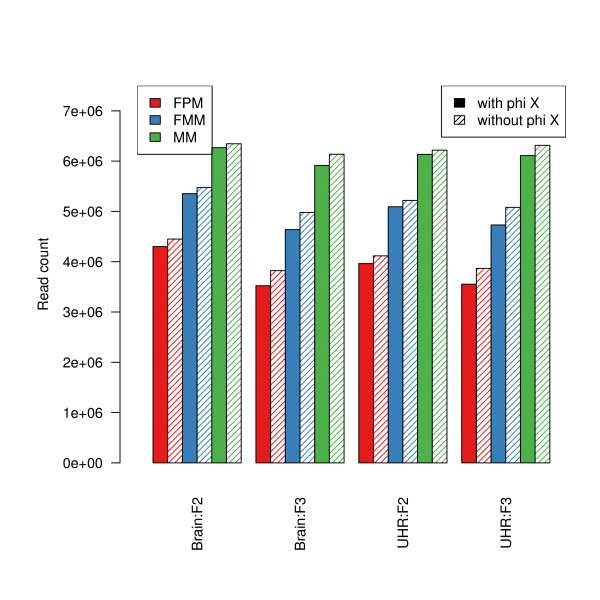
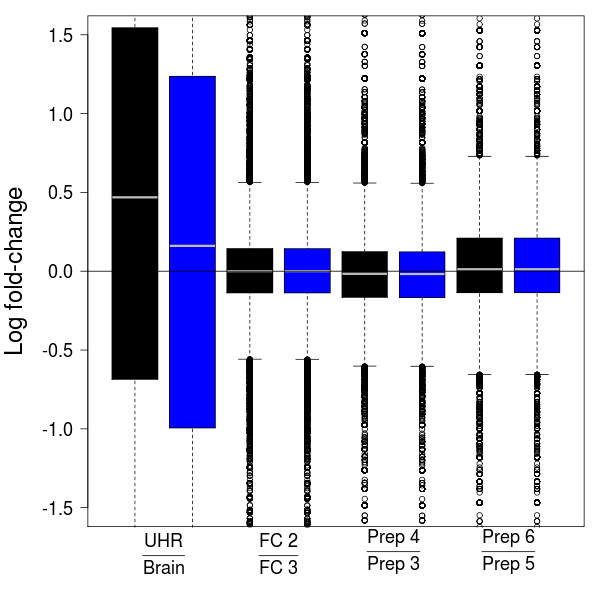
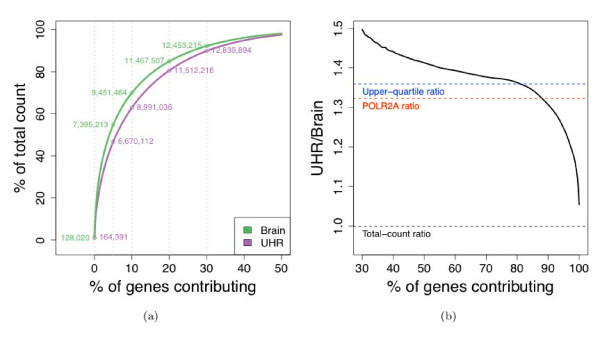
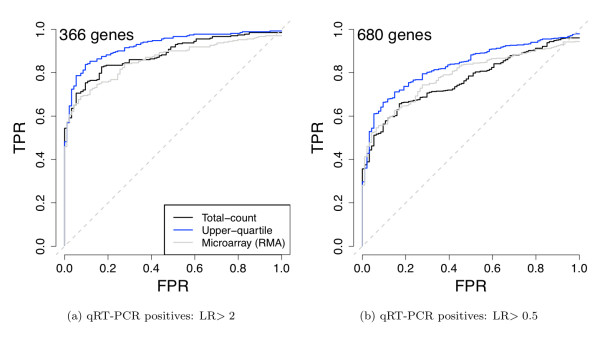
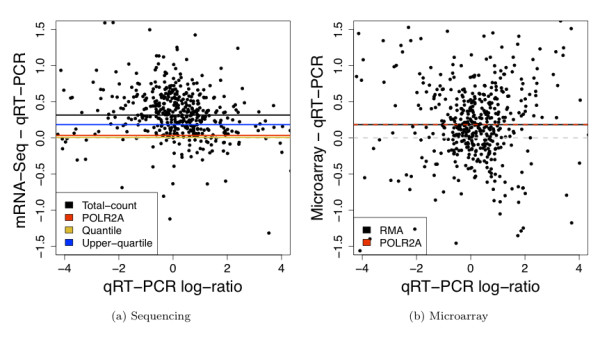
BACKGROUND: High-throughput sequencing technologies, such as the Illumina Genome Analyzer, are powerful new tools for investigating a wide range of biological and medical questions. Statistical and computational methods are key for drawing meaningful and accurate conclusions from the massive and complex datasets generated by the sequencers. We provide a detailed evaluation of statistical methods for normalization and differential expression (DE) analysis of Illumina transcriptome sequencing (mRNA-Seq) data. RESULTS: We compare statistical methods for detecting genes that are significantly DE between two types of biological samples and find that there are substantial differences in how the test statistics handle low-count genes. We evaluate how DE results are affected by features of the sequencing platform, such as, varying gene lengths, base-calling calibration method (with and without phi X control lane), and flow-cell/library preparation effects. We investigate the impact of the read count normalization method on DE results and show that the standard approach of scaling by total lane counts (e.g., RPKM) can bias estimates of DE. We propose more general quantile-based normalization procedures and demonstrate an improvement in DE detection. CONCLUSIONS: Our results have significant practical and methodological implications for the design and analysis of mRNA-Seq experiments. They highlight the importance of appropriate statistical methods for normalization and DE inference, to account for features of the sequencing platform that could impact the accuracy of results. They also reveal the need for further research in the development of statistical and computational methods for mRNA-Seq.
Overview
The claims and statistics of this paper haven’t been checked yet.
Run the check — free, no account needed. It reads the open-access text and checks the sources it cites.
Integrity signals
Registry
Cites
Statistics
Figures
![Figure 8 Comparison of normalization procedures: Goodness-of-fit of Poisson model. The multiplicative Poisson model (GLM 1 in [Additional file 2: Supplemental Table S4]) is fit to the seven Brain lanes in the MAQC-2 experiment after (a) total-count, (b) POLR2A, (c) upper-quartile, and (d) quantile normalization. Goodness-of-fit statistics are computed and displayed in χ2 quantile-quantile plots. Genes with goodness-of-fit statistics in the top quantiles of the χ2-distribution are displayed using colored plotting symbols: red (1, 5]%, purple (.1, 1]%, gold [0, .1]%. Similar plots for UHR show the same patterns.](/paper-figures/d99eb5ce90ee4a9ebac8c9f438b4c283/evaluation-of-statistical-methods-for-normalization-and-differential-expression-figure-8.jpg)
Verification
Claims the paper makes
The claims and statistics of this paper haven’t been checked yet.
Run the check — free, no account needed. It reads the open-access text and checks the sources it cites.
Claims other papers make about this one
Each is checked against this paper’s own text: does it say what the citing paper says it does?
In the citing paper
“These approaches rely on normalizing methods that are based on total or effective counts, and tend to perform poorly when samples have heterogeneous transcript distributions, that is, when highly and differentially expressed features can skew the count distribution [45, 46].”
From A survey of best practices for RNA-seq data analysis (2016) · cites this paper as [45]
In the citing paper
“While reproducibility in RNA-seq is usually high at the level of sequencing [1, 45], other steps such as RNA extraction and library preparation are noisier and may introduce biases in the data that can be minimized by adopting good experimental procedures (Box 2).”
From A survey of best practices for RNA-seq data analysis (2016) · cites this paper as [45]
Self-check
Percentages, sums and reported differences re-computed from the paper’s own numbers.
The self-check needs the paper’s full text.
Citations
Cites
Ultrafast and memory-efficient alignment of short DNA sequences to the human genome.
Langmead, B., Trapnell, C., Pop, M., & Salzberg, S. L. (2009) · Genome Biology · doi:10.1186/gb-2009-10-3-r25 · Cited by 21,849 · cited 1×
“We used Bowtie to map reads to the genome (GRCh37 assembly) [ 16 ].”
Method(2005) · Springer eBooks · doi:10.1007/0-387-27255-0_9 · Cited by 20,333
Mapping and quantifying mammalian transcriptomes by RNA-Seq
Mortazavi, A., Williams, B. A., McCue, K., Schaeffer, L., & Wold, B. (2008) · Nature Methods · doi:10.1038/nmeth.1226 · Cited by 13,696 · cited 6×
“These high-throughput sequencing technologies have already been applied to monitor genome-wide transcription levels (mRNA-Seq), DNA-protein interactions (ChIP-Seq), chromatin structure, and DNA methylation [1-9].”
BackgroundMethodInfluentialSmyth, G. K. (2004) · Statistical Applications in Genetics and Molecular Biology · doi:10.2202/1544-6115.1027 · Cited by 11,829
Exploration, normalization, and summaries of high density oligonucleotide array probe level data
Irizarry, R. A. (2003) · Biostatistics · doi:10.1093/biostatistics/4.2.249 · Cited by 10,603
Base-Calling of Automated Sequencer Traces Using Phred. I. Accuracy AssessmentPreprint
Ewing, B., Hillier, L., Wendl, M. C., & Green, P. (1998) · Genome Research · doi:10.1101/gr.8.3.175 · Cited by 6,993
Base-Calling of Automated Sequencer Traces Using Phred. II. Error Probabilities
Ewing, B., & Green, P. (1998) · Genome Research · doi:10.1101/gr.8.3.186 · Cited by 5,439 · cited 1×
“quality scores for the other seven lanes [[15], Supplementary Information, p. 7]. Bustard can also be run using the auto-calibration method, which scores basecalls in a manner similar to the phred base-caller [ 17 ] and does not require a control lane per flow-cell.”
MethodAlternative isoform regulation in human tissue transcriptomes
Wang, E. T., Sandberg, R., Luo, S., Khrebtukova, I., Zhang, L., Mayr, C., Kingsmore, S. F., Schroth, G. P., & Burge, C. B. (2008) · Nature · doi:10.1038/nature07509 · Cited by 5,181
Accurate whole human genome sequencing using reversible terminator chemistry
Bentley, D. R., Balasubramanian, S., Swerdlow, H. P., Smith, G. P., Milton, J., Brown, C. G., Hall, K. P., Evers, D. J., Barnes, C. L., Bignell, H. R., et al. (2008) · Nature · doi:10.1038/nature07517 · Cited by 3,684 · cited 1×
“quality scores for the other seven lanes [[15], Supplementary Information, p.”
BackgroundRNA-seq: An assessment of technical reproducibility and comparison with gene expression arrays
Marioni, J. C., Mason, C. E., Mane, S. M., Stephens, M., & Gilad, Y. (2008) · Genome Research · doi:10.1101/gr.079558.108 · Cited by 2,771 · cited 7×
“These high-throughput sequencing technologies have already been applied to monitor genome-wide transcription levels (mRNA-Seq), DNA-protein interactions (ChIP-Seq), chromatin structure, and DNA methylation [1-9].”
BackgroundMethodResultInfluential
Research works printed but not linked: 4
- Illumina:Sequencing Analysis Software User Guide For Pipeline Version 1.3 and CASAVA Version 1.0 T. Illumina, Inc.; 2008. [Part # 1005359 Rev. A] [ http://icom.illumina.com/icom/software.ilmn?id=277 ] [Part # 1005359 Rev. A]
- Illumina:Preparing Samples for Sequencing mRNA. Ilumina, Inc.; 2009. [Part # 1004898 Rev. A] [ http://icom.illumina.com/icom/software.ilmn?id=277 ] [Part # 1004898 Rev. A]
- Taub MA: Analysis of high-throughput biological data: some statistical problems in RNA-seq and mouse genotyping. PhD thesis. Department of Statistics, UC Berkeley; 2009.
- Irizarry RA, Hobbs B, Collin F, Beazer-Barclay YD, Antonellis KJ, Scherf U, Speed TP: Exploration, normalization, and summaries of high density oligonucleotide array probe level data. Biostatistics 2003, 4(1465–4644 (Print)):249–64. 10.1093/biostatistics/4.2.249 · DOI · Paper page
Cited by
Sorted by citations
Items 801–900 of 999
Rediti, M., Fernández-Martínez, A., Venet, D., Rothé, F., Hoadley, K. A., Parker, J. S., Singh, B., Campbell, J. D., Ballman, K. V., Hillman, D. W., et al. (2023) · Nature Communications · doi:10.1038/s41467-023-42635-2 · Cited by 18
“Raw read counts for all the RNA sequencing samples were normalized to a fi xed upper quartile 77 .”
Classification of RNA-seq Data
Tan, K. M., Petersen, A. J., & Witten, D. (2014) · Springer eBooks · doi:10.1007/978-3-319-07212-8_11 · Cited by 18
Monger, C., Kelly, P. S., Gallagher, C., CLYNES, M. M., Barron, N., & Clarke, C. (2015) · Biotechnology Journal · doi:10.1002/biot.201500107 · Cited by 20
“A variety of normalization methods can be applied to RNA-Seq data to adjust for these biases [96].”
BackgroundMethodThe Role of Spike-In Standards in the Normalization of RNA-seq
Risso, D., Ngai, J., Speed, T. P., & Dudoit, S. (2014) · Springer eBooks · doi:10.1007/978-3-319-07212-8_9 · Cited by 18
Self-citationJi, H., Zhang, X., Oh, S., Mayhew, C. N., Ulm, A., Somineni, R. P., Ericksen, M. B., Wells, J. M., & Hershey, G. K. K. (2014) · Journal of Allergy and Clinical Immunology · doi:10.1016/j.jaci.2014.08.038 · Cited by 18
Characterization of the kidney transcriptome of the South American olive mouse Abrothrix olivacea
Giorello, F., Feijoo, M., D’Elía, G., Valdez, L., Opazo, J. C., Varas, V., Naya, D. E., & Lessa, E. P. (2014) · BMC Genomics · doi:10.1186/1471-2164-15-446 · Cited by 18
Kridsada, K., Niu, J., Haldipur, P., Wang, Z., Ding, L., Li, J. J., Lindgren, A., Herrera, E., Thomas, G. M., Chizhikov, V. V., et al. (2018) · Cell Reports · doi:10.1016/j.celrep.2018.05.025 · Cited by 19
Falcón, T., de Freitas, M. V., Mello, A. C. D. M., Coutinho, L., Álvares‐da‐Silva, M. R., & Matte, Ú. D. S. (2018) · BioMed Research International · doi:10.1155/2018/2864120 · Cited by 18
“Then, we followed a normalization step using both GC content and gene length (TCGAanalyze Normalization) and gene filtering by quantile (TCGAanalyze Filtering) as recommended in [23].”
MethodShi, Y., Zhang, S., Peng, D., Shan, C., Zhao, L., Wang, B., & Wu, J. (2020) · PeerJ · doi:10.7717/peerj.10157 · Cited by 18
“001) are used as criteria to narrow down the list of differentially expressed genes between flowers and other tissues (Bullard et al., 2010; Lee et al., 2008; Li et al., 2013).”
MethodGenetic mutations associated with metastatic clear cell renal cell carcinoma
Li, Z., Hao, P., Wu, Q., Li, F., Zhao, J., Wu, K., Qu, C., Chen, Y., Li, M., Chen, X., et al. (2016) · Oncotarget · doi:10.18632/oncotarget.7473 · Cited by 18
“[18] Read counts per gene in all samples were normalized using Upper Quartile normalization [19] and analyzed for differential expression using Partek’s Gene Specific Analysis method (genes with less than 10 reads in any sample were excluded).”
MethodSchiffman, C., Lin, C., Shi, F., Chen, L., Sohn, L. L., & Huang, H. (2017) · Statistics in Biosciences · doi:10.1007/s12561-017-9194-z · Cited by 18
de Reyniès, A., Javelaud, D., Elarouci, N., Marsaud, V., Gilbert, C., & Mauviel, A. (2020) · Scientific Reports · doi:10.1038/s41598-020-71559-w · Cited by 18
Bioinformatics for RNA‐Seq Data Analysis
Zhao, S., Zhang, B., Zhang, Y., Gordon, W., Du, S., Paradis, T., Vincent, M. S., & von Schack, D. (2016) · InTech eBooks · doi:10.5772/63267 · Cited by 20
“The increasing number of normalization methods makes it difficult for scientists to decide which method should be used for which particular data set [58–66].”
BackgroundMethodlncDIFF: a novel quasi-likelihood method for differential expression analysis of non-coding RNA
Li, Q., Yu, X., Chaudhary, R., Slebos, R. J. C., Chung, C. H., & Wang, X. (2019) · BMC Genomics · doi:10.1186/s12864-019-5926-4 · Cited by 16
“We further assessed the dispersion patterns of mRNA low counts normalized by TMM and UQ methods [30, 31] (Additional File 1: Figure S3 ) .”
MethodBhardwaj, V., Semplicio, G., Erdogdu, N. U., Manke, T., & Akhtar, A. (2019) · Nature Communications · doi:10.1038/s41467-019-11115-x · Cited by 17
Oleanolic acid derivative HA-20 inhibits adipogenesis in a manner involving PPARγ-FABP4/aP2 pathway
Wang, J., Zhang, Y., Shen, Q., Wu, J., & Li, J. (2021) · Journal of Molecular Endocrinology · doi:10.1530/jme-20-0075 · Cited by 17
Normalization of RNA-Seq data using adaptive trimmed mean with multi-reference
Singh, V., Kirtipal, N., Song, B., & Lee, S. (2024) · Briefings in Bioinformatics · doi:10.1093/bib/bbae241 · Cited by 19
“The authors [9, 10] have described how normalization affects the differential gene expression analyses in microarray data.”
BackgroundMethodAll the sites we cannot see: Sources and mitigation of false negatives in RNA modification studies
Oberdoerffer, S., & Gilbert, W. V. (2024) · Nature Reviews Molecular Cell Biology · doi:10.1038/s41580-024-00784-2 · Cited by 17
“This issue arises because FPKM values are derived from the 75th percentile of the read count distribution, instead of from the total number of mapped reads, and highly expressed genes thus exert an outsized influence on relative transcript expression 10,11 .”
The meiotic transcriptome architecture of plants
Dukowic‐Schulze, S., & Chen, C. (2014) · Frontiers in Plant Science · doi:10.3389/fpls.2014.00220 · Cited by 17
Soft truncation thresholding for gene set analysis of RNA-seq data: Application to a vaccine study
Fridley, B. L., Jenkins, G. D., Grill, D. E., Kennedy, R. B., Poland, G. A., & Oberg, A. L. (2013) · Scientific Reports · doi:10.1038/srep02898 · Cited by 17
Jiang, L., Mao, K., & Wu, R. (2014) · BMC Genomics · doi:10.1186/1471-2164-15-772 · Cited by 17
Ager-Wick, E., Dirks, R. P., Burgerhout, E., Nourizadeh-Lillabadi, R., de Wijze, D. L., Spaink, H. P., van den Thillart, G. E. E. J. M., Tsukamoto, K., Dufour, S., Weltzien, F., et al. (2013) · PLoS ONE · doi:10.1371/journal.pone.0077396 · Cited by 17
ROC Curve Analysis in the Presence of Imperfect Reference Standards
Liao, P., Wu, H., & Yu, T. (2016) · Statistics in Biosciences · doi:10.1007/s12561-016-9159-7 · Cited by 17
“2 is deemed non-DE, and others are no-call [4, 19].”
BackgroundMethodDeep Sequencing of Cardiac MicroRNA-mRNA Interactomes in Clinical and Experimental Cardiomyopathy
Matkovich, S. J., & Dorn, G. W. (2015) · Methods in molecular biology · doi:10.1007/978-1-4939-2572-8_3 · Cited by 17
Kang, T., Yau, C. S. F., Wong, C. K., Sanborn, Z., Newton, Y., Vaske, C. J., Benz, S. C., Krings, G., Camarda, R., Henry, J. E., et al. (2020) · Breast Cancer Research · doi:10.1186/s13058-020-01322-6 · Cited by 19
Tollis, S., Singh, J., Thattikota, Y., Palou, R., Ghazal, G., Coulombe‐Huntington, J., Tang, X., Moore, S., Blake, D., Bonneil, É., et al. (2022) · PLoS Biology · doi:10.1371/journal.pbio.3001548 · Cited by 17
“Gene expression levels for each sample, expressed as log2 read counts, were normalized to the upper quartile gene expression level for the same sample, as recommended in Bullard and colleagues [96], and represented as heatmaps Fig 6C.”
Zipper, L., Batchu, S., Kaya, N. H., Antonello, Z. A., & Reiff, T. (2022) · Metabolites · doi:10.3390/metabo12040315 · Cited by 17
“Upper-quartile [87] and trimmed mean of M-values [88] were implemented using calcNormFactors function from the edgeR package [88].”
MethodWan, L., & Sun, F. (2012) · IEEE Transactions on Computational Biology and Bioinformatics · doi:10.1109/tcbb.2012.83 · Cited by 17
The challenges of delivering bioinformatics training in the analysis of high-throughput data
Carvalho, B. S., & Rustici, G. (2013) · Briefings in Bioinformatics · doi:10.1093/bib/bbt018 · Cited by 19
A multi-omics dataset of heat-shock response in the yeast RNA binding protein Mip6
Nuño‐Cabanes, C., Ugidos, M., Tarazona, S., Martín‐Expósito, M., Ferrer, A., Rodríguez‐Navarro, S., & Conesa, A. (2020) · Scientific Data · doi:10.1038/s41597-020-0412-z · Cited by 17
Single‐Cell Transcriptomic Analysis
Zheng, Z., Chen, E., Lü, W., Mouradian, G. C., Hodges, M. R., Liang, M., Liu, P., & Lü, Y. (2020) · Comprehensive physiology · doi:10.1002/cphy.c190037 · Cited by 28
Compositional Data Analysis is necessary for simulating and analyzing RNA-Seq dataPreprint
McGee, W. A., Pimentel, H., Pachter, L. S., & Wu, J. Y. (2019) · bioRxiv (Cold Spring Harbor Laboratory) · doi:10.1101/564955 · Cited by 18
Conserved regulatory switches for the transition from natal down to juvenile feather in birds
Chen, C.-K., Chang, Y., Jiang, T., Yue, Z., Liu, T., Lu, J., Zhou, Y., Lin, J.-J., Vu, T.-D., Huang, T.-Y., et al. (2024) · Nature Communications · doi:10.1038/s41467-024-48303-3 · Cited by 16
“To compare expression pro fi les of the selected genes across the conditions, we applied the upper quartile normalization procedure 88 .”
Li, J., Varghese, R. S., & Ressom, H. W. (2024) · Methods in molecular biology · doi:10.1007/978-1-0716-3918-4_18 · Cited by 18
A graph-based algorithm for RNA-seq data normalization
Tran, D.-T. T., Bhaskara, A., Might, M., & Kuberan, B. (2020) · PLoS ONE · doi:10.1371/journal.pone.0227760 · Cited by 16
“In the upper quartile (UQ) method [2], each samples are scaled by the total counts of genes in the upper quartile after removing zero counts.”
BackgroundMethodLi, D., Gong, B., Xu, J., Ning, B., & Tong, W. (2020) · Chemical Research in Toxicology · doi:10.1021/acs.chemrestox.0c00368 · Cited by 16
Jabre, I., Chaudhary, S., Wilson, C. M., Staiger, D., & Syed, N. H. (2022) · Plants · doi:10.3390/plants11091105 · Cited by 15
Gunter, H. M., Youlten, S. E., Madala, B. S., Reis, A. L. M., Stevanovski, I., Wong, T., Kummerfield, S., Deveson, I. W., Santini, N. S., Marcellin, E., et al. (2022) · Nature Communications · doi:10.1038/s41467-022-34028-8 · Cited by 15
“An advantage of using CAPTORs as scaling factors with RUVg normalisation is the ability to relax the common normalisation assumption that most microbes are not differentially abundant between samples 28 .”
MethodJackson, D. J., Cerveau, N., & Posnien, N. (2024) · Frontiers in Zoology · doi:10.1186/s12983-024-00538-y · Cited by 19
“…procedures which account for library size and transcript/gene length such as RPKM (reads per kilobase of exon per million reads mapped) and its derivates FPKM (fragments per kilobase of exon per million fragments mapped) and TPM (transcripts per kilobase million) should be employed [163–165].”
MethodAmin, N. M., Tandon, P., Nishimura, E. O., & Conlon, F. L. (2013) · Methods · doi:10.1016/j.ymeth.2013.06.009 · Cited by 16
Luo, Y., Ma, B., Zeng, Q., Xiang, Z., & He, N. (2016) · Meta Gene · doi:10.1016/j.mgene.2014.04.004 · Cited by 16
“Only two genes, MnLBD10 and MnLBD13 are intervened by two introns.”
BackgroundSchaefer, C., Mallela, N., Seggewiß, J., Lechtape, B., Omran, H., Dirksen, U., Korsching, E., & Potratz, J. C. (2018) · PLoS ONE · doi:10.1371/journal.pone.0191570 · Cited by 16
Altered microRNA Transcriptome in Cultured Human Liver Cells upon Infection with Ebola Virus
Diallo, I., Ho, J., Laffont, B., Laugier, J., Benmoussa, A., Lambert, M., Husseini, Z., Soule, G., Kozak, R. A., Kobinger, G., et al. (2021) · International Journal of Molecular Sciences · doi:10.3390/ijms22073792 · Cited by 16
“miRNA expression levels were measured and normalized as transcripts per million (TPM) of total aligned miRNA reads [126].”
MethodPreventive Effects of Green Tea Extract against Obesity Development in Zebrafish
Zang, L., Shimada, Y., Nakayama, H., Katsuzaki, H., Kim, Y.-I., Chu, D., Juneja, L. R., Kuroyanagi, J., & Nishimura, N. (2021) · Molecules · doi:10.3390/molecules26092627 · Cited by 16
“The expression of each transcript was detected and normalized using the trimmed mean of M values (TMM) method, followed by a per-sample 75% upper quartile (UQ) [55].”
MethodScavuzzo-Duggan, T. R., Varoquaux, N., Madera, M. A., Vogel, J. P., Dahlberg, J. A., Hutmacher, R. B., Belcher, M. S., Ortega, J., Coleman‐Derr, D., Lemaux, P. G., et al. (2021) · Frontiers in Plant Science · doi:10.3389/fpls.2021.747225 · Cited by 17
Self-citationZhao, H., Chen, C., Xiong, Y., Xu, X., Lan, R., Wang, H., Yao, X., Bai, X., Liu, X., Meng, Q., et al. (2013) · PLoS ONE · doi:10.1371/journal.pone.0065466 · Cited by 16
hmmSeq: A hidden Markov model for detecting differentially expressed genes from RNA-seq data
Cui, S., Guha, S., Ferreira, M. A. R., & Tegge, A. N. (2015) · The Annals of Applied Statistics · doi:10.1214/15-aoas815 · Cited by 16
“For each of these three data sets, the treatment-specific replicate effects ρjk are obtained by the upper-quartile normalizing technique of Bullard et al. (2010). In addition, we compare the results of the hmmSeq analysis with results of”
BackgroundMethodResultInfluentialTranscriptomics Using Next Generation Sequencing Technologies
Lee‐Liu, D., Almonacid, L. I., Faunes, F., Melo, F., & Larraı́n, J. (2012) · Methods in molecular biology · doi:10.1007/978-1-61779-992-1_18 · Cited by 16
On the study of microbial transcriptomes using second- and third-generation sequencing technologies
Choi, S. C. (2016) · The Journal of Microbiology · doi:10.1007/s12275-016-6233-2 · Cited by 16
“Recommendation for normalizing gene counts (Dillies et al., 2013) include quantile-based normalization (Bullard et al., 2010), and DESeq or edgeR Bioconductor package's scaling factor (Anders and Huber, 2010; Robinson and Oshlack, 2010).”
MethodZaim, S. R., Kenost, C., Berghout, J., Vitali, F., Zhang, H. H., & Lussier, Y. A. (2019) · BMC Medical Genomics · doi:10.1186/s12920-019-0513-8 · Cited by 17
Linnstaedt, S. D., Zannas, A. S., McLean, S. A., Koenen, K. C., & Ressler, K. J. (2019) · Molecular Psychiatry · doi:10.1038/s41380-019-0636-5 · Cited by 17
Ambiguous fragment assignment for high-throughput sequencing experiments
Roberts, A. (2013) · eScholarship (California Digital Library) · Cited by 16
Silva, K. D., Demmer, R. T., Jönsson, D., Mousa, A., Forbes, A. B., & Enticott, J. (2022) · Heliyon · doi:10.1016/j.heliyon.2022.e08886 · Cited by 15
“…in all libraries, the scaling factor is determined by the 75 th percentile of reads [20], as follows. where, Scaling entails the division of raw reads by the upper quartile of counts in each sample and multiplication by the mean upper quartile across all samples, as proposed by Bullard et al [31].”
MethodScalable transcriptomics analysis with Dask: applications in data science and machine learning
Moreno, M., Vilaca, R. M. P., & Ferreira, P. G. (2022) · BMC Bioinformatics · doi:10.1186/s12859-022-05065-3 · Cited by 17
Zhang, Q., Bi, Z., Song, X., Zhang, Y., Wang, S., Xie, L., & Song, X. (2023) · Future Oncology · doi:10.2217/fon-2023-0129 · Cited by 15
Köster, T., Venhuizen, P., Lewinski, M., Petrillo, E., Márquez, Y., Fuchs, A., Ray, D., Nimeth, B. A., Riegler, S., Franzmeier, S., et al. (2025) · New Phytologist · doi:10.1111/nph.70221 · Cited by 15
“The TMM method was used to normalize gene and transcript read counts to log 2 -CPM (Bullard et al ., 2010).”
Craig, T. A., Zhang, Y., Magis, A. T., Funk, C. C., Price, N. D., Ekker, S. C., & Kumar, R. (2014) · Zebrafish · doi:10.1089/zeb.2013.0899 · Cited by 15
Qi, Y., & Yang, X. (2012) · Genomics · doi:10.1016/j.ygeno.2012.09.004 · Cited by 15
RNA-Seq Data Analysis, Applications and Challenges
Esteve‐Codina, A. (2018) · Comprehensive analytical chemistry · doi:10.1016/bs.coac.2018.06.001 · Cited by 15
Whole-Genome Duplication Facilitated the Evolution of C4 Photosynthesis in Gynandropsis gynandra
Huang, C.-F., Liu, W.-Y., Lu, M. J., Chen, Y.-H., Ku, M. S. B., & Li, W. (2021) · Molecular Biology and Evolution · doi:10.1093/molbev/msab200 · Cited by 15
“To have meaningful comparisons of gene expression levels for the six developmental stages between two species, the RPKM values were normalized using the upper quartile normalization procedure (Bullard et al. 2010), using the S0 stage in G.”
MethodPerformance evaluation of transcriptomics data normalization for survival risk prediction
Ni, A., & Qin, L. (2021) · Briefings in Bioinformatics · doi:10.1093/bib/bbab257 · Cited by 15
“While the performance of these normalization methods has been extensively studied in group comparison, little research has been done to re-evaluate their performance in the setting of survival analysis, when signals are associated with a censored outcome, partly due to lack of awareness and dearth of benchmarking tool…”
Zan, A., Xie, Z., Hsu, Y.-C., Chen, Y., Lin, T.-H., Chang, Y.-S., & Chang, K. Y. (2021) · Computer Methods and Programs in Biomedicine · doi:10.1016/j.cmpb.2021.106495 · Cited by 16
Li, Y., Shi, X., Zuo, Y., Tian, L., Liu, L., Shen, Z., Shen, J., Zhang, R., & Wang, S. (2022) · Microbiology Spectrum · doi:10.1128/spectrum.02297-22 · Cited by 17
Zuo, T., Zhang, P., Lithio, A., Dash, S., Weber, D. F., Wise, R. P., Nettleton, D. S., & Peterson, T. (2016) · Genetics · doi:10.1534/genetics.116.188235 · Cited by 16
“In each model, the log of the mean read count was assumed to be a linear function of genespecific parameters plus a sample-specific normalization factor, determined for each sample by the log of the 0.75 quantile of sample-specific read counts (Bullard et al. 2010).”
MethodInfluentialComputational and Statistical Considerations in the Analysis of Metagenomic Data
Boulund, F., Pereira, M. B., Jönsson, V., & Kristiansson, E. (2017) · Elsevier eBooks · doi:10.1016/b978-0-08-102268-9.00004-5 · Cited by 15
Transcriptome analysis of silver, palladium, and selenium stresses in Pantoea sp. IMH
Liu, W., Wang, Y., & Jing, C. (2018) · Chemosphere · doi:10.1016/j.chemosphere.2018.05.169 · Cited by 15
Assessment of Single Cell RNA-Seq Normalization Methods
Ding, B., Zheng, L., & Wang, W. (2017) · G3 Genes Genomes Genetics · doi:10.1534/g3.117.040683 · Cited by 14
“Various methods have been developed for normalization of scRNA-seq data including fragments per kilobase of transcript per million mapped reads (FPKM)(8), upper quartile (UQ)(9), Trimmed mean of M-values (TMM)(10), DESeq(11), removed unwanted variation (RUV)(12), and gamma regression model (GRM)(13).”
MethodPan-cancer analysis of systematic batch effects on somatic sequence variations
Choi, J.-H., Hong, S.-E., & Woo, H. G. (2017) · BMC Bioinformatics · doi:10.1186/s12859-017-1627-7 · Cited by 14
A multiomics comparison between endometrial cancer and serous ovarian cancer
Zhong, H., Chen, H., Qiu, H., Huang, C. L., & Wu, Z. (2019) · PeerJ · doi:10.7717/peerj.8347 · Cited by 14
Pires, J. G., da Silva, G. F., Weyssow, T., Conforte, A. J., Pagnoncelli, D., da Silva, F. A. B., & Carels, N. (2021) · Frontiers in Genetics · doi:10.3389/fgene.2021.624259 · Cited by 13
Kopp, N., Climer, S., & Dougherty, J. D. (2015) · Frontiers in Genetics · doi:10.3389/fgene.2015.00301 · Cited by 15
“Power to detect differential expression in RNAseq is influenced by total count number for a particular gene, and thus longer or higher expressed transcripts in a tissue are more likely to be found as significantly different (Bullard et al., 2010; Young et al., 2010).”
BackgroundNext generation quantitative genetics in plants
Jiménez‐Gómez, J. M. (2011) · Frontiers in Plant Science · doi:10.3389/fpls.2011.00077 · Cited by 16
Sen, S. K., Barb, J. J., Cherukuri, P. F., Accame, D. S., Elkahloun, A. G., Singh, L. N., Lee-Lin, S.-Q., Program, N. C. S., Kolodgie, F. D., Cheng, Q., et al. (2014) · BMC Genomics · doi:10.1186/1471-2164-15-198 · Cited by 12
Luo, H., Li, J., Chia, B. K. H., Robson, P., & Nagarajan, N. (2014) · Genome biology · doi:10.1186/s13059-014-0527-7 · Cited by 14
Gu, X. (2015) · Briefings in Bioinformatics · doi:10.1093/bib/bbv035 · Cited by 14
“RNA-seq counts typically range from zero to many thousands, with frequent presence of low integers [7].”
BackgroundLozoya, O. A., Santos, J. H., & Woychik, R. P. (2018) · Frontiers in Genetics · doi:10.3389/fgene.2018.00176 · Cited by 14
“…of such sequencing biases during library assembly have been posited early on during the development of RNAseq technologies (Auer and Doerge, 2010; Bullard et al., 2010); at the same time, development of various programmatic strategies to adjust against those biases during statistical analyses…”
BackgroundIdentifying Breast Cancer-induced Gene Perturbations and its Application in Guiding Drug Repurposing
Zhuang, J., Dai, S., Zhang, L., Gao, P., Han, Y., Tian, G., Yan, N., Tang, M., & Kui, L. (2020) · Current Bioinformatics · doi:10.2174/1574893615666200203104214 · Cited by 14
Gakii, C., Mireji, P. O., & Rimiru, R. M. (2022) · Algorithms · doi:10.3390/a15010021 · Cited by 14
“This was achieved via normalization using the upper quartile method implemented in edgeR package [55].”
MethodSugahara, G., Ishida, Y., Lee, J. J., Li, M., Tanaka, Y., Eoh, H., Higuchi, Y., & Saito, T. (2023) · The FASEB Journal · doi:10.1096/fj.202201292rr · Cited by 13
Becoming data-savvy in a big-data world
Xu, M., & Rhee, S. Y. (2014) · Trends in Plant Science · doi:10.1016/j.tplants.2014.08.003 · Cited by 14
A statistical approach to selecting and confirming validation targets in -omics experiments
Leek, J. T., Taub, M. A., & Rasgon, J. L. (2012) · BMC Bioinformatics · doi:10.1186/1471-2105-13-150 · Cited by 14
Qiu, X., Hu, R., & Wu, Z. (2014) · PLoS ONE · doi:10.1371/journal.pone.0099380 · Cited by 14
Neisseria Prophage Repressor Implicated in Gonococcal Pathogenesis
Daou, N., Yu, C., McClure, R., Gudino, C. V., Reed, G. W., & Genco, C. A. (2013) · Infection and Immunity · doi:10.1128/iai.00298-13 · Cited by 14
Yao, L., Tan, K. W. M., Tan, T. W., & Lee, Y. K. (2017) · BMC Bioinformatics · doi:10.1186/s12859-017-1551-x · Cited by 14
“Construction of transcriptome coverage can vary due to expression differences and input data depth [42].”
BackgroundLocal sequence and sequencing depth dependent accuracy of RNA-seq reads
Cai, G., Liang, S., Zheng, X., & Xiao, F. (2017) · BMC Bioinformatics · doi:10.1186/s12859-017-1780-z · Cited by 13
“RNA-seq datasets related to the MAQC project with real-time PCR measurements were used in this comparison [25].”
MethodMittal, V. K., & McDonald, J. F. (2017) · BMC Medical Genomics · doi:10.1186/s12920-017-0289-7 · Cited by 16
“RNA-Seq reads were mapped to the assembled contigs representing each of these four fusions and read counts were estimated using RSEM (RNA-Seq by Expectation Maximization; [78]) and normalized using upper-quartile normalization [41] (see Methods).”
MethodLi, Q., Cassese, A., Guindani, M., & Vannucci, M. (2018) · Biometrics · doi:10.1111/biom.12962 · Cited by 14
“Initial modeling efforts were focused on data normalization (Bullard et al., 2010; Hansen et al., 2012) and on the detection of differentially expressed genes based on univariate testing methods that use mixture models and hierarchical frameworks for robust inference on gene expression changes (Lee…”
MethodSoares, M. P. M., Pinheiro, D. G., Freitas, F. C. D. P., Simões, Z. L. P., & Bitondi, M. M. G. (2021) · BMC Genomics · doi:10.1186/s12864-021-08040-z · Cited by 15
“Transcript abundance was given in FPKM (Fragments Per Kilobase of transcript per Million mapped reads) using Upper-quartile [130] as the normalization method.”
MethodClustering high-throughput sequencing data with Poisson mixture models
Rau, A., Celeux, G., Martin‐Magniette, M., & Maugis-Rabusseau, C. (2011) · HAL · Cited by 14
An eight-mRNA signature predicts the prognosis of patients with bladder urothelial carcinoma
Zhu, R., Yang, X., Guo, W., Xu, X., & Zhu, L. (2019) · PeerJ · doi:10.7717/peerj.7836 · Cited by 13
“, 2011; Leek, 2014), and FPKM-UQ values (Bullard et al., 2010; Shahriyari, 2019) that is a modified version of the FPKM formula were used.”
MethodApplications of Community Detection Algorithms to Large Biological Datasets
Kanter, I., Yaari, G., & Tomer Kalisky, C. (2020) · Methods in molecular biology · doi:10.1007/978-1-0716-1103-6_3 · Cited by 15
CpG Methylation Levels in HPA Axis Genes Predict Chronic Pain Outcomes Following Trauma Exposure
Branham, E. M., McLean, S. A., Deliwala, I., Mauck, M. C., Zhao, Y., McKibben, L. A., Lee, A., Spencer, A. B., Zannas, A. S., Lechner, M., et al. (2023) · Journal of Pain · doi:10.1016/j.jpain.2023.03.001 · Cited by 13
Nanni, A. V., Martinez, N., Graze, R. M., Morse, A. M., Newman, J. R. B., Jain, V., Vlaho, S., Signor, S. A., Nuzhdin, S. V., Renne, R., et al. (2023) · Molecular Biology and Evolution · doi:10.1093/molbev/msad078 · Cited by 13
“… (cid:0) , where d is the depth of reads at nucleotide j of feature i , N is the length of the feature, U s is the upper quartile of ( d ijs ) / N i (cid:0) values in sample s , and Q is the median of all U s values within the given species (Bullard, et al. 2010; Dillies, et al. 2013).”
BackgroundDivergent responses in desiccation experiments in two ecophysiologically different Zygnematophyceae
Rieseberg, T. P., Dadras, A., Bergschmidt, L. I. N., Bierenbroodspot, M. J., Fürst‐Jansen, J. M. R., Irisarri, I., de Vries, S., Darienko, T., & de Vries, J. (2023) · Physiologia Plantarum · doi:10.1111/ppl.14056 · Cited by 15
Sarker, B., Rahaman, M. M., Alamin, M. H., Islam, M. A., & Mollah, M. N. H. (2024) · Genomics · doi:10.1016/j.ygeno.2024.110834 · Cited by 13
Wang, B., & Luan, Y. (2024) · Frontiers in Genetics · doi:10.3389/fgene.2024.1369628 · Cited by 13
A global transcriptional atlas of the effect of acute sleep deprivation in the mouse frontal cortex
Ford, K., Zuin, E., Righelli, D., Medina, E., Schoch, H., Singletary, K. G., Muheim, C., Frank, M. G., Hicks, S. C., Risso, D., et al. (2024) · iScience · doi:10.1016/j.isci.2024.110752 · Cited by 16
Niu, Z., Kozminsky, M., Day, K. C., Broses, L. J., Henderson, M. L., Patsalis, C., Tagett, R., Qin, Z., Blumberg, S., Reichert, Z. R., et al. (2024) · Neoplasia · doi:10.1016/j.neo.2024.101036 · Cited by 16
“Normalization was performed using the upper-quartile method in the EDASeq package followed by PCA [52,53].”
MethodrnaSeqMap: a Bioconductor package for RNA sequencing data exploration
Leśniewska, A., & Okoniewski, M. J. (2011) · BMC Bioinformatics · doi:10.1186/1471-2105-12-200 · Cited by 13
Tripathi, R., Soni, A., & Varadwaj, P. K. (2016) · Non-coding RNA Research · doi:10.1016/j.ncrna.2016.09.002 · Cited by 13
“Functionally, the annotation of the transcriptional activity including enumerable coding and non-coding genes pro fi ling at once is important to construct an overall image of the cell activity [15].”
Background
Metadata
- Authors
- Bullard, J. H., Purdom, E., Hansen, K. D., & Dudoit, S.
- Affiliations
- University of California, Berkeley (US)
- Corresponding author
- Bullard, James H
- Venue
- BMC Bioinformatics
- Published
- 2010-02-18
- Volume
- 11
- Issue
- 1
- Pages
- 94-94
- ISSN
- 1471-2105 (ISSN-L)
- PMC
- PMC2838869
- OpenAlex
- W2156631105
- Cited by
- 1,680
- References
- 23
- Citations by year
- 2026: 29 · 2025: 51 · 2024: 69 · 2023: 68 · 2022: 92 · 2021: 132 · 2020: 127 · 2019: 123 · 2018: 123 · 2017: 133 · 2016: 121 · 2015: 129 · 2014: 161 · 2013: 128 · 2012: 98
- FWCI
- 41.79
- Type
- journal article
- Language
- en
- Open access
- gold
- doi.org
- Licence
- Locations
- BMC Bioinformatics (publishedVersion, cc-by)
- PubMed Central (publishedVersion, cc-by)
- PubMed (publishedVersion)
- Collection of Biostatistics Research Archive (submittedVersion)
- DOAJ (DOAJ: Directory of Open Access Journals) (submittedVersion, cc-by-sa)
- eScholarship (California Digital Library) (submittedVersion)
- Funders
- National Science Foundation
- National Institutes of Health
- National Human Genome Research Institute (U01HG004271)
- Topics
- Life Sciences › Biochemistry, Genetics and Molecular Biology › Molecular Biology › Gene expression and cancer classification
- Life Sciences › Biochemistry, Genetics and Molecular Biology › Molecular Biology › Genomics and Phylogenetic Studies
- Life Sciences › Biochemistry, Genetics and Molecular Biology › Molecular Biology › Single-cell and spatial transcriptomics
- Keywords
- mRNA-seq, read count normalization, differential gene expression, method comparison
- MeSH terms
- RNA, Messenger, Sequence Analysis, RNA, Computational Biology, Databases, Genetic
About these checks
Registry, retraction, Cites and statistics results are computed, not judged, with one exception: a printed reference that no index lists is read once by a model before it counts as a citation error. Claims are extracted by a model and kept only when their quote appears verbatim in the text; each cited source is then checked, with a model’s help, for whether it says what the claim relies on. Those verdicts can be wrong — read the claim’s quote and the cited source before relying on one.
Statistics and arithmetic are recomputed, not judged.
Confidence bands are shown only for fields calibrated on our annotated test set. None is calibrated yet, so no band is shown.
What counts as a claim ›How we measure confidence ›How we check this ›
Are you an author, or do you see a problem with this page? Request a review
