

The DOI matches its Crossref record; 22 of the 23 references it cites were found in a registry or an index.
Evaluation of statistical methods for normalization and differential expression in mRNA-Seq experiments
Open accessAbstract
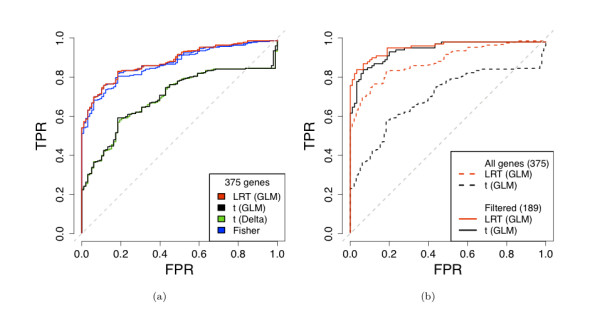
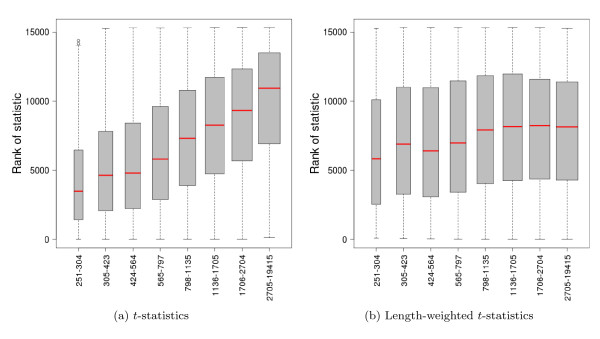
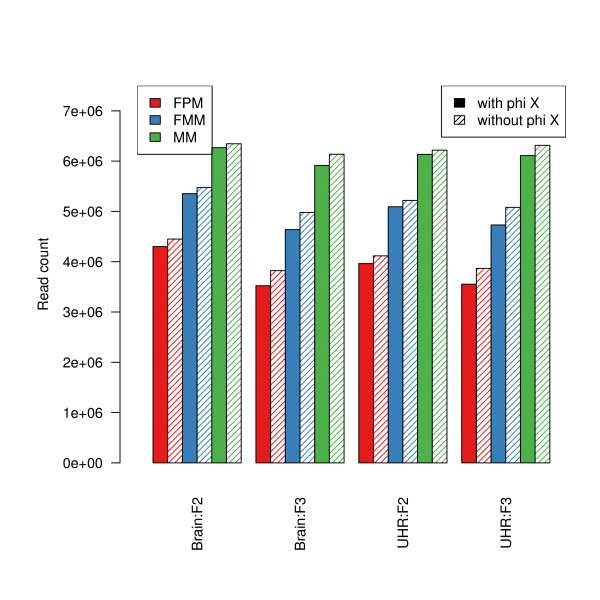
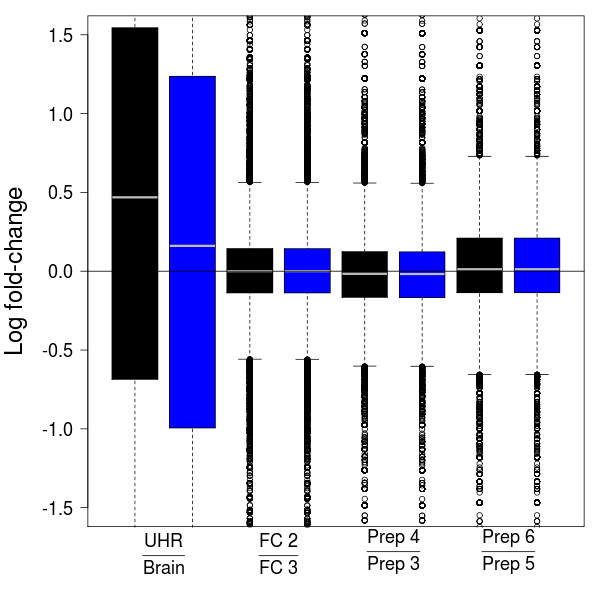
BACKGROUND: High-throughput sequencing technologies, such as the Illumina Genome Analyzer, are powerful new tools for investigating a wide range of biological and medical questions. Statistical and computational methods are key for drawing meaningful and accurate conclusions from the massive and complex datasets generated by the sequencers. We provide a detailed evaluation of statistical methods for normalization and differential expression (DE) analysis of Illumina transcriptome sequencing (mRNA-Seq) data. RESULTS: We compare statistical methods for detecting genes that are significantly DE between two types of biological samples and find that there are substantial differences in how the test statistics handle low-count genes. We evaluate how DE results are affected by features of the sequencing platform, such as, varying gene lengths, base-calling calibration method (with and without phi X control lane), and flow-cell/library preparation effects. We investigate the impact of the read count normalization method on DE results and show that the standard approach of scaling by total lane counts (e.g., RPKM) can bias estimates of DE. We propose more general quantile-based normalization procedures and demonstrate an improvement in DE detection. CONCLUSIONS: Our results have significant practical and methodological implications for the design and analysis of mRNA-Seq experiments. They highlight the importance of appropriate statistical methods for normalization and DE inference, to account for features of the sequencing platform that could impact the accuracy of results. They also reveal the need for further research in the development of statistical and computational methods for mRNA-Seq.
Overview
The claims and statistics of this paper haven’t been checked yet.
Run the check — free, no account needed. It reads the open-access text and checks the sources it cites.
Integrity signals
Registry
Cites
Statistics
Figures
![Figure 8 Comparison of normalization procedures: Goodness-of-fit of Poisson model. The multiplicative Poisson model (GLM 1 in [Additional file 2: Supplemental Table S4]) is fit to the seven Brain lanes in the MAQC-2 experiment after (a) total-count, (b) POLR2A, (c) upper-quartile, and (d) quantile normalization. Goodness-of-fit statistics are computed and displayed in χ2 quantile-quantile plots. Genes with goodness-of-fit statistics in the top quantiles of the χ2-distribution are displayed using colored plotting symbols: red (1, 5]%, purple (.1, 1]%, gold [0, .1]%. Similar plots for UHR show the same patterns.](/paper-figures/d99eb5ce90ee4a9ebac8c9f438b4c283/evaluation-of-statistical-methods-for-normalization-and-differential-expression-figure-8.jpg)
Verification
Claims the paper makes
The claims and statistics of this paper haven’t been checked yet.
Run the check — free, no account needed. It reads the open-access text and checks the sources it cites.
Claims other papers make about this one
Each is checked against this paper’s own text: does it say what the citing paper says it does?
In the citing paper
“These approaches rely on normalizing methods that are based on total or effective counts, and tend to perform poorly when samples have heterogeneous transcript distributions, that is, when highly and differentially expressed features can skew the count distribution [45, 46].”
From A survey of best practices for RNA-seq data analysis (2016) · cites this paper as [45]
In the citing paper
“While reproducibility in RNA-seq is usually high at the level of sequencing [1, 45], other steps such as RNA extraction and library preparation are noisier and may introduce biases in the data that can be minimized by adopting good experimental procedures (Box 2).”
From A survey of best practices for RNA-seq data analysis (2016) · cites this paper as [45]
Self-check
Percentages, sums and reported differences re-computed from the paper’s own numbers.
The self-check needs the paper’s full text.
Citations
Cites
Ultrafast and memory-efficient alignment of short DNA sequences to the human genome.
Langmead, B., Trapnell, C., Pop, M., & Salzberg, S. L. (2009) · Genome Biology · doi:10.1186/gb-2009-10-3-r25 · Cited by 21,849 · cited 1×
“We used Bowtie to map reads to the genome (GRCh37 assembly) [ 16 ].”
Method(2005) · Springer eBooks · doi:10.1007/0-387-27255-0_9 · Cited by 20,333
Mapping and quantifying mammalian transcriptomes by RNA-Seq
Mortazavi, A., Williams, B. A., McCue, K., Schaeffer, L., & Wold, B. (2008) · Nature Methods · doi:10.1038/nmeth.1226 · Cited by 13,696 · cited 6×
“These high-throughput sequencing technologies have already been applied to monitor genome-wide transcription levels (mRNA-Seq), DNA-protein interactions (ChIP-Seq), chromatin structure, and DNA methylation [1-9].”
BackgroundMethodInfluentialSmyth, G. K. (2004) · Statistical Applications in Genetics and Molecular Biology · doi:10.2202/1544-6115.1027 · Cited by 11,829
Exploration, normalization, and summaries of high density oligonucleotide array probe level data
Irizarry, R. A. (2003) · Biostatistics · doi:10.1093/biostatistics/4.2.249 · Cited by 10,603
Base-Calling of Automated Sequencer Traces Using Phred. I. Accuracy AssessmentPreprint
Ewing, B., Hillier, L., Wendl, M. C., & Green, P. (1998) · Genome Research · doi:10.1101/gr.8.3.175 · Cited by 6,993
Base-Calling of Automated Sequencer Traces Using Phred. II. Error Probabilities
Ewing, B., & Green, P. (1998) · Genome Research · doi:10.1101/gr.8.3.186 · Cited by 5,439 · cited 1×
“quality scores for the other seven lanes [[15], Supplementary Information, p. 7]. Bustard can also be run using the auto-calibration method, which scores basecalls in a manner similar to the phred base-caller [ 17 ] and does not require a control lane per flow-cell.”
MethodAlternative isoform regulation in human tissue transcriptomes
Wang, E. T., Sandberg, R., Luo, S., Khrebtukova, I., Zhang, L., Mayr, C., Kingsmore, S. F., Schroth, G. P., & Burge, C. B. (2008) · Nature · doi:10.1038/nature07509 · Cited by 5,181
Accurate whole human genome sequencing using reversible terminator chemistry
Bentley, D. R., Balasubramanian, S., Swerdlow, H. P., Smith, G. P., Milton, J., Brown, C. G., Hall, K. P., Evers, D. J., Barnes, C. L., Bignell, H. R., et al. (2008) · Nature · doi:10.1038/nature07517 · Cited by 3,684 · cited 1×
“quality scores for the other seven lanes [[15], Supplementary Information, p.”
BackgroundRNA-seq: An assessment of technical reproducibility and comparison with gene expression arrays
Marioni, J. C., Mason, C. E., Mane, S. M., Stephens, M., & Gilad, Y. (2008) · Genome Research · doi:10.1101/gr.079558.108 · Cited by 2,771 · cited 7×
“These high-throughput sequencing technologies have already been applied to monitor genome-wide transcription levels (mRNA-Seq), DNA-protein interactions (ChIP-Seq), chromatin structure, and DNA methylation [1-9].”
BackgroundMethodResultInfluential
Research works printed but not linked: 4
- Illumina:Sequencing Analysis Software User Guide For Pipeline Version 1.3 and CASAVA Version 1.0 T. Illumina, Inc.; 2008. [Part # 1005359 Rev. A] [ http://icom.illumina.com/icom/software.ilmn?id=277 ] [Part # 1005359 Rev. A]
- Illumina:Preparing Samples for Sequencing mRNA. Ilumina, Inc.; 2009. [Part # 1004898 Rev. A] [ http://icom.illumina.com/icom/software.ilmn?id=277 ] [Part # 1004898 Rev. A]
- Taub MA: Analysis of high-throughput biological data: some statistical problems in RNA-seq and mouse genotyping. PhD thesis. Department of Statistics, UC Berkeley; 2009.
- Irizarry RA, Hobbs B, Collin F, Beazer-Barclay YD, Antonellis KJ, Scherf U, Speed TP: Exploration, normalization, and summaries of high density oligonucleotide array probe level data. Biostatistics 2003, 4(1465–4644 (Print)):249–64. 10.1093/biostatistics/4.2.249 · DOI · Paper page
Cited by
Sorted by citations
Items 101–200 of 999
Kuppusamy, K. T., Jones, D. C., Sperber, H., Madan, A., Fischer, K. A., Rodriguez, M. L., Pabon, L., Zhu, W., Tulloch, N. L., Yang, X., et al. (2015) · Proceedings of the National Academy of Sciences · doi:10.1073/pnas.1424042112 · Cited by 272
“So far, studies to understand the transition of the glycolysisdependent fetal heart to oxidative metabolism in the adult heart have been mostly related to the peroxisome proliferatoractivated receptor (PPAR)/estrogen-related receptor/PPARγ coactivator-1α circuit (7, 8, 12).”
BackgroundMethodSystematic comparison and assessment of RNA-seq procedures for gene expression quantitative analysis
Corchete, L. A., Rojas, E. A., Alonso‐López, D., Rivas, J. D. L., Gutierrez, N. C., & Burguillo, F. J. (2020) · Scientific Reports · doi:10.1038/s41598-020-76881-x · Cited by 266
A new shrinkage estimator for dispersion improves differential expression detection in RNA-seq data
Wu, H., Wang, C., & Wu, Z. J. (2012) · Biostatistics · doi:10.1093/biostatistics/kxs033 · Cited by 248
Lin, M., Pedrosa, E., Shah, A., Hrabovsky, A., Maqbool, S. B., Zheng, D., & Lachman, H. M. (2011) · PLoS ONE · doi:10.1371/journal.pone.0023356 · Cited by 247
Guo, H., Nolan, T. M., Song, G., Liu, S., Xie, Z., Chen, J., Schnable, P. S., Walley, J. W., & Yin, Y. (2018) · Current Biology · doi:10.1016/j.cub.2018.07.078 · Cited by 241
A broken promise: microbiome differential abundance methods do not control the false discovery rate
Hawinkel, S., Mattiello, F., Bijnens, L., & Thas, O. (2019) · Briefings in Bioinformatics · doi:10.1093/bib/bbx104 · Cited by 199
Deconstructing Olfactory Stem Cell Trajectories at Single-Cell Resolution
Fletcher, R. B., Das, D., Gadye, L., Street, K., Baudhuin, A., Wagner, A., Cole, M. B., Flores-Ramirez, Q., Choi, Y. G., Yosef, N., et al. (2017) · Cell stem cell · doi:10.1016/j.stem.2017.04.003 · Cited by 235
“According to SCONE, the best performing normalization was full-quantile normalization (Bolstad et al., 2003; Bullard et al., 2010), followed by regression-based adjustment for QC measures (see above).”
Self-citationMeasuring differential gene expression with RNA-seq: challenges and strategies for data analysis
Finotello, F., & Camillo, B. D. (2014) · Briefings in Functional Genomics · doi:10.1093/bfgp/elu035 · Cited by 253
Circulating microRNAs as Potential Biomarkers of Infectious Disease
Correia, C. N., Nalpas, N., McLoughlin, K. E., Browne, J. A., Gordon, S. V., MacHugh, D. E., & Shaughnessy, R. G. (2017) · Frontiers in Immunology · doi:10.3389/fimmu.2017.00118 · Cited by 245
“Tam and collaborators evaluated a range of available methods and recommended the use of trimmed mean of M-values (TMM) (135) and upper quartile scaling (136) for count normalization in comprehensive miRNA profiling studies (137).”
MethodEvaluating Gene Expression in C57BL/6J and DBA/2J Mouse Striatum Using RNA-Seq and Microarrays
Bottomly, D., Walter, N. A. R., Hunter, J. E., Darakjian, P., Kawane, S., Buck, K. J., Searles, R. P., Mooney, M. A., McWeeney, S. K., & HITZEMANN, R. J. (2011) · PLoS ONE · doi:10.1371/journal.pone.0017820 · Cited by 229
Design and validation issues in RNA-seq experiments
Fang, Z., & Cui, X. (2011) · Briefings in Bioinformatics · doi:10.1093/bib/bbr004 · Cited by 243
The power and promise of RNA ‐seq in ecology and evolution
Todd, E. V., Black, M. A., & Gemmell, N. J. (2016) · Molecular Ecology · doi:10.1111/mec.13526 · Cited by 229
“2010), and flow cell and lane effects during Illumina sequencing (Bullard et al. 2010; McIntyre et al. 2011).”
BackgroundSequencing technology does not eliminate biological variability
Hansen, K. D., Wu, Z., Irizarry, R. A., & Leek, J. T. (2011) · Nature Biotechnology · doi:10.1038/nbt.1910 · Cited by 226
Self-citationDesigning a transcriptome next‐generation sequencing project for a nonmodel plant species1
Strickler, S. R., Bombarely, A., & Mueller, L. A. (2012) · American Journal of Botany · doi:10.3732/ajb.1100292 · Cited by 232
Dynamics and genomic landscape of CD8+ T cells undergoing hepatic priming
Bénéchet, A. P., De Simone, G., Di Lucia, P., Cilenti, F., Barbiera, G., Le Bert, N., Fumagalli, V., Lusito, E., Moalli, F., Bianchessi, V., et al. (2019) · Nature · doi:10.1038/s41586-019-1620-6 · Cited by 222
Principles of transcriptome analysis and gene expression quantification: an RNA ‐seq tutorial
Wolf, J. B. W. (2013) · Molecular Ecology Resources · doi:10.1111/1755-0998.12109 · Cited by 235
Tutorial: guidelines for the experimental design of single-cell RNA sequencing studies
Lafzi, A., Moutinho, C., Picelli, S., & Heyn, H. (2018) · Nature Protocols · doi:10.1038/s41596-018-0073-y · Cited by 218
“…normalization methods originally developed for bulk-RNA sequencing, such as log-expression 86 , trimmed mean M-values 87 or upper-quartiles 88 can also be used in scRNA-Seq, although more specialized normalization methods are being developed that can better handle many aspects of this…”
MethodHolzinger, A., Dehmer, M., & Jurišica, I. (2014) · BMC Bioinformatics · doi:10.1186/1471-2105-15-s6-i1 · Cited by 222
The Evolution of Lineage-Specific Regulatory Activities in the Human Embryonic Limb
Cotney, J. L., Leng, J., Yin, J., Reilly, S. K., DeMare, L. E., Emera, D., Ayoub, A. E., RAKIC, P. T., & Noonan, J. P. (2013) · Cell · doi:10.1016/j.cell.2013.05.056 · Cited by 215
on behalf of the MATCH study group, Smid, M., van den Braak, R. R. J. C., van de Werken, H. J. G., van Riet, J., van Galen, A., de Weerd, V., van der Vlugt‐Daane, M., Bril, S. I., Lalmahomed, Z. S., et al. (2018) · BMC Bioinformatics · doi:10.1186/s12859-018-2246-7 · Cited by 217
“…these 2 methods (Trimmed Mean of M-values, TMM, for edgeR and Relative Log Expression, RLE, for DESeq) show consistent good performance compared to other normalization algorithms (Total count, Upper-Quartile, Median, Quantile, and those employed by Lim-maQN, limmaVoom, CuffDiff and Bayseq) [5 – 8].”
MethodRoosan, M. R., Jackson, L. K., Johnson, W. E., Li, D. Y., Bild, A. H., & Piccolo, S. (2015) · Bioinformatics · doi:10.1093/bioinformatics/btv377 · Cited by 212
“Results: We compared TCGA samples processed using either pipeline and found that the Rsubread pipeline produced fewer zero-expression genes and more consistent expression levels across replicate samples than the TCGA pipeline.”
MethodXia, Y. (2020) · Progress in molecular biology and translational science · doi:10.1016/bs.pmbts.2020.04.003 · Cited by 239
Analysis of Transcriptome Complexity Through RNA Sequencing in Normal and Failing Murine Hearts
Lee, J.-H., Gao, C., Peng, G., Greer, C., Ren, S., Wang, Y., & Xiao, X. (2011) · Circulation Research · doi:10.1161/circresaha.111.249433 · Cited by 209
Quinn, T. P., Richardson, M. F., Lovell, D. R., & Crowley, T. M. (2017) · Scientific Reports · doi:10.1038/s41598-017-16520-0 · Cited by 211
“We provide extensive documentation for these plotting methods in the package vignette, “Understanding RNA-Seq Data through Proportionality Analysis”, hosted with the package on CRAN.”
ResultInfluentialGenomic Analysis of Parent-of-Origin Allelic Expression in Arabidopsis thaliana Seeds
Gehring, M. A., Missirian, V., & Henikoff, S. (2011) · PLoS ONE · doi:10.1371/journal.pone.0023687 · Cited by 206
Pyroptosis by caspase11/4‐gasdermin‐D pathway in alcoholic hepatitis in mice and patients
Khanova, E., Wu, R., Wang, W., Yan, R., Chen, Y., French, S. W., Llorente, C., Pan, S. Q., Yang, Q., Li, Y., et al. (2018) · Hepatology · doi:10.1002/hep.29645 · Cited by 228
“Read counts per gene/transcript in all samples were normalized using Upper Quartile normalization (17) and analyzed for differential expression by Partek Gene Specific Analysis method.”
MethodMicroRNA expression profiles of bovine milk exosomes in response to Staphylococcus aureus infection
Sun, J., Aswath, K., Schroeder, S., Lippolis, J. D., Reinhardt, T. A., & Sonstegard, T. S. (2015) · BMC Genomics · doi:10.1186/s12864-015-2044-9 · Cited by 207
“tween libraries using upper-quartile normalization [78].”
Detecting and correcting systematic variation in large-scale RNA sequencing data
Li, S., Łabaj, P. P., Zumbo, P., Sykacek, P., Shi, W., Shi, L., Phan, J., Wu, P.-Y., Wang, M., Wang, C., et al. (2014) · Nature Biotechnology · doi:10.1038/nbt.3000 · Cited by 175
The characteristic direction: a geometrical approach to identify differentially expressed genes
Clark, N. R., Hu, K. S., Feldmann, A. S., Kou, Y., Chen, E. Y., Duan, Q., & Ma’ayan, A. (2014) · BMC Bioinformatics · doi:10.1186/1471-2105-15-79 · Cited by 204
Middlebrooks, C. D., Banday, A. R., Matsuda, K., Udquim, K.-I., Onabajo, O. O., Paquin, A., Figueroa, J. D., Zhu, B., Koutros, S., Kubo, M., et al. (2016) · Nature Genetics · doi:10.1038/ng.3670 · Cited by 185
Guo, L., Han, L., Yang, L., Zeng, H., Fan, D., Zhu, Y., Feng, Y., Wang, G., Peng, C., Jiang, X., et al. (2014) · PLoS ONE · doi:10.1371/journal.pone.0095543 · Cited by 198
Comparison of normalization methods for the analysis of metagenomic gene abundance data
Pereira, M. B., Wallroth, M., Jönsson, V., & Kristiansson, E. (2018) · BMC Genomics · doi:10.1186/s12864-018-4637-6 · Cited by 197
“Upper quartile [19] Calculates scaling factors based on the upper quartile of the gene abundances edgeR package in Bioconductor”
InfluentialRobles, J. A., Qureshi, S. E., Stephen, S. J., Wilson, S. R., Burden, C. J., & Taylor, J. M. (2012) · BMC Genomics · doi:10.1186/1471-2164-13-484 · Cited by 198
Blum, Y., Meiller, C., Quetel, L., Elarouci, N., Ayadi, M., Tashtanbaeva, D., Armenoult, L., Montagne, F., Tranchant, R., Renier, A., et al. (2019) · Nature Communications · doi:10.1038/s41467-019-09307-6 · Cited by 196
Lapuk, A. V., Wu, C., Wyatt, A. W., McPherson, A., McConeghy, B. J., Brahmbhatt, S., Mo, F., Zoubeidi, A., Anderson, S. A., Bell, R. H., et al. (2012) · The Journal of Pathology · doi:10.1002/path.4047 · Cited by 196
Cultured cambial meristematic cells as a source of plant natural products
Lee, E.-K., Jin, Y.-W., Park, J. H., Yoo, Y. M., Hong, S. M., Amir, R., Yan, Z., Kwon, E., Elfick, A. P. D., Tomlinson, S. R., et al. (2010) · Nature Biotechnology · doi:10.1038/nbt.1693 · Cited by 196
DNA repair in species with extreme lifespan differences
MacRae, S. L., Croken, M. M., Calder, R. B., Aliper, A. M., Milholland, B., White, R. R., Zhavoronkov, A. A., Gladyshev, V. N., Seluanov, A., Gorbunova, V. A., et al. (2015) · Aging · doi:10.18632/aging.100866 · Cited by 198
“To mitigate technical biases we used quantile normalization of our read counts, which also factored in gene length [12].”
MethodClassification and clustering of sequencing data using a Poisson model
Witten, D. (2011) · The Annals of Applied Statistics · doi:10.1214/11-aoas493 · Cited by 186
Absolute Assignment of Breast Cancer Intrinsic Molecular Subtype
Paquet, É. R., & Hallett, M. T. (2014) · JNCI Journal of the National Cancer Institute · doi:10.1093/jnci/dju357 · Cited by 186
Casaretto, J. A., El‐Kereamy, A., Zeng, B., Stiegelmeyer, S. M., Chen, X. X., Bi, Y., & Rothstein, S. J. (2016) · BMC Genomics · doi:10.1186/s12864-016-2659-5 · Cited by 184
“0) that correct for GC content bias within and between samples was used to improve sensitivity without loss of specificity [63].”
BackgroundComprehensive multi-center assessment of small RNA-seq methods for quantitative miRNA profiling
Giraldez, M. D., Spengler, R. M., Etheridge, A., Godoy, P. M., Barczak, A. J., Srinivasan, S., De Hoff, P. L., Tanriverdi, K., Courtright, A., Lu, S., et al. (2018) · Nature Biotechnology · doi:10.1038/nbt.4183 · Cited by 177
Rosati, D., Palmieri, M., Brunelli, G., Morrione, A., Iannelli, F., Frullanti, E., & Giordano, A. (2024) · Computational and Structural Biotechnology Journal · doi:10.1016/j.csbj.2024.02.018 · Cited by 216
“Although RNA-Seq is a powerful technology for analyzing gene expression, it has limitations due to variability introduced during library preparation and sequencing, which can lead to differences in gene expression estimates between replicates [179].”
BackgroundSkelly, D. A., Johansson, M., Madeoy, J., Wakefield, J., & Akey, J. M. (2011) · Genome Research · doi:10.1101/gr.119784.110 · Cited by 203
Harke, M. J., & Gobler, C. J. (2013) · PLoS ONE · doi:10.1371/journal.pone.0069834 · Cited by 180
De Novo Transcriptome Sequence Assembly and Analysis of RNA Silencing Genes of Nicotiana benthamiana
Nakasugi, K., Crowhurst, R. N., Bally, J., Wood, C. C., Hellens, R. P., & Waterhouse, P. M. (2016) · Figshare · doi:10.1371/journal.pone.0059534 · Cited by 177
Performance Assessment and Selection of Normalization Procedures for Single-Cell RNA-Seq
Cole, M. B., Risso, D., Wagner, A., DeTomaso, D., Ngai, J., Purdom, E., Dudoit, S., & Yosef, N. (2019) · Cell Systems · doi:10.1016/j.cels.2019.03.010 · Cited by 173
Self-citationPaschold, A., Jia, Y., Marcon, C., Lund, S., Larson, N. B., Yeh, C.-T., Ossowski, S., Lanz, C., Nettleton, D., Schnable, P. S., et al. (2012) · Genome Research · doi:10.1101/gr.138461.112 · Cited by 170
Lin, Y., Golovnina, K. A., Chen, Z., Lee, H., Negron, Y. L. S., Sultana, H., Oliver, B., & Harbison, S. T. (2016) · BMC Genomics · doi:10.1186/s12864-015-2353-z · Cited by 176
“Differences due to technical variation in read count data have been modeled with a Poisson distribution, which assumes that the variance is equal to the mean [6].”
InfluentialMicrobiome Multi-Omics Network Analysis: Statistical Considerations, Limitations, and Opportunities
Jiang, D., Armour, C. R., Hu, C., Meng, M., Tian, C., Sharpton, T. J., & Jiang, Y. (2019) · Frontiers in Genetics · doi:10.3389/fgene.2019.00995 · Cited by 170
“We refer the readers to the review papers of Burges (2009) and Engel et al. (2011) as two statistical reviews on dimension reduction and to the review paper of Meng et al. (2016) as a review on the application of dimension reduction to the integrative analysis of multi-omics data.”
Next-generation sequencing (NGS) in the microbiological world: How to make the most of your money
Vincent, A. T., Derôme, N., Boyle, B., Culley, A. I., & Charette, S. J. (2016) · Journal of Microbiological Methods · doi:10.1016/j.mimet.2016.02.016 · Cited by 181
Tlemsani, C., Pongor, L. S., Elloumi, F., Girard, L., Huffman, K. E., Roper, N., Varma, S., Luna, A., Rajapakse, V. N., Sebastian, R., et al. (2020) · Cell Reports · doi:10.1016/j.celrep.2020.108296 · Cited by 170
“The paired-end RNA-seq reads from the 70 UTSW SCLC cell lines were aligned to the human reference genome GRCh38 using STAR aligner (version 2.7), FPKM expression values were generated with cufflinks (version 2.2.1) (Bullard et al., 2010) and log-transformation.”
InfluentialFarkas, M. H., Grant, G. R., White, J., Sousa, M. E., Consugar, M. B., & Pierce, E. A. (2013) · BMC Genomics · doi:10.1186/1471-2164-14-486 · Cited by 169
Bias detection and correction in RNA-Sequencing data
Zheng, W., Chung, L. M., & Zhao, H. (2011) · BMC Bioinformatics · doi:10.1186/1471-2105-12-290 · Cited by 169
SERE: Single-parameter quality control and sample comparison for RNA-Seq
Schulze, S. K., Kanwar, R., Gölzenleuchter, M., Therneau, T. M., & Beutler, A. S. (2012) · BMC Genomics · doi:10.1186/1471-2164-13-524 · Cited by 160
ReCount: A multi-experiment resource of analysis-ready RNA-seq gene count datasets
Frazee, A. C., Langmead, B., & Leek, J. T. (2011) · BMC Bioinformatics · doi:10.1186/1471-2105-12-449 · Cited by 157
Kemp, J. P., Medina‐Gómez, C., Estrada, K., Pourcain, B. S., Heppe, D. H. M., Warrington, N. M., Oei, L., Ring, S. M., Kruithof, C. J., Timpson, N. J., et al. (2014) · PLoS Genetics · doi:10.1371/journal.pgen.1004423 · Cited by 159
Model-based clustering for RNA-seq data
Si, Y., Liu, P., Li, P., & Brutnell, T. P. (2013) · Bioinformatics · doi:10.1093/bioinformatics/btt632 · Cited by 161
Next-generation sequencing technologies for gene expression profiling in plants
Jain, M. (2011) · Briefings in Functional Genomics · doi:10.1093/bfgp/elr038 · Cited by 166
Alexandre, P. A., Kogelman, L. J. A., Santana, M. H. D. A., Passarelli, D., Pulz, L. H., Neto, P. F., Silva, P. L., Leme, P. R., Strefezzi, R. D. F., Coutinho, L. L., et al. (2015) · BMC Genomics · doi:10.1186/s12864-015-2292-8 · Cited by 158
“For this analysis, gene expression was estimated as quartile normalized Fragments Per Kilobases per Million reads (FPKM) using Cufflinks2 [67, 68].”
MethodIdentifying plant genes shaping microbiota composition in the barley rhizosphere
Escudero-Martinez, C., Coulter, M., Terrazas, R. A., Foito, A., Kapadia, R., Pietrangelo, L., Maver, M., Sharma, R. K., Aprile, A., Morris, J., et al. (2022) · Nature Communications · doi:10.1038/s41467-022-31022-y · Cited by 169
RNA-seq and microarray complement each other in transcriptome profiling
Kogenaru, S., Yan, Q., Guo, Y., & Wang, N. (2012) · BMC Genomics · doi:10.1186/1471-2164-13-629 · Cited by 157
Systematic identification of genes with a cancer-testis expression pattern in 19 cancer types
Wang, C., Gu, Y., Zhang, K., Xie, K., Zhu, M., Dai, N., Jiang, Y., Guo, X., Liu, M., Dai, J., et al. (2016) · Nature Communications · doi:10.1038/ncomms10499 · Cited by 161
Deficiency of microRNA miR-34a expands cell fate potential in pluripotent stem cells
Choi, Y. J., Lin, C., Risso, D., Chen, S., Kim, T. A., Tan, M. H., Li, J. B., Wu, Y., Chen, C., Xuan, Z., et al. (2017) · Science · doi:10.1126/science.aag1927 · Cited by 158
MiR-195 suppresses non-small cell lung cancer by targeting CHEK1
Liu, B., Qu, J., Xu, F., Guo, Y. H., Wang, Y., Yu, H., & Qian, B. (2015) · Oncotarget · doi:10.18632/oncotarget.3255 · Cited by 157
Cánovas, Á., Reverter, A., DeAtley, K. L., Ashley, R. L., Colgrave, M. L., Fortes, M. R. S., Islas‐Trejo, A., Lehnert, S. A., Porto-Neto, L. R., Rincón, G., et al. (2014) · PLoS ONE · doi:10.1371/journal.pone.0102551 · Cited by 163
Maza, É. (2016) · Frontiers in Genetics · doi:10.3389/fgene.2016.00164 · Cited by 153
“It is now commonly accepted that a normalization preprocessing step can significantly improve the quality of the analysis, in particular, for the differential gene expression analysis (cf. Bullard et al., 2010).”
MethodIdentification of Metabolically Distinct Adipocyte Progenitor Cells in Human Adipose Tissues
Raajendiran, A., Ooi, G., Bayliss, J., O’Brien, P. E., Schittenhelm, R. B., Clark, A. K., Taylor, R. A., Rodeheffer, M. S., Burton, P. R., & Watt, M. J. (2019) · Cell Reports · doi:10.1016/j.celrep.2019.04.010 · Cited by 160
A two-parameter generalized Poisson model to improve the analysis of RNA-seq data
Srivastava, S., & Chen, L. (2010) · Nucleic Acids Research · doi:10.1093/nar/gkq670 · Cited by 161
Nawy, T. (2013) · Nature Methods · doi:10.1038/nmeth.2771 · Cited by 151
Łabaj, P. P., Leparc, G. G., Linggi, B. E., Markillie, L. M., Wiley, H. S., & Kreil, D. P. (2011) · Bioinformatics · doi:10.1093/bioinformatics/btr247 · Cited by 141
Liu, S., Lin, L., Jiang, P., Wang, D., & Xing, Y. (2011) · Nucleic Acids Research · doi:10.1093/nar/gkq817 · Cited by 146
False signals induced by single-cell imputation
Andrews, T. S., & Hemberg, M. (2018) · F1000Research · doi:10.12688/f1000research.16613.1 · Cited by 142
Wang, L., Si, Y., Dedow, L. K., Shao, Y., Liu, P., & Brutnell, T. P. (2011) · PLoS ONE · doi:10.1371/journal.pone.0026426 · Cited by 145
Diaferia, G. R., Balestrieri, C., Prosperini, E., Nicoli, P., Spaggiari, P., Zerbi, A., & Natoli, G. (2016) · The EMBO Journal · doi:10.15252/embj.201592404 · Cited by 149
“…setting the option upper-quartile-norm (which improves sensitivity without loss of specificity The EMBO Journal Transcriptional control of PDAC grade Giuseppe R Diaferia et al for differential expression calls) (Bullard et al , 2010), -u (which allows a better weighting of the multimapping reads).”
The BET Protein BRD2 Cooperates with CTCF to Enforce Transcriptional and Architectural Boundaries
Hsu, S. C., Gilgenast, T. G., Bartman, C., Edwards, C. R., Stonestrom, A. J., Huang, P., Emerson, D. J., Evans, P., Werner, M. T., Keller, C. A., et al. (2017) · Molecular Cell · doi:10.1016/j.molcel.2017.02.027 · Cited by 143
“To enable comparison between samples, ICED corrected HiC libraries were parsed into contact matrices for each chromosome and then quantile normalized (Bolstad et al., 2003; Bullard et al., 2010).”
MethodHicks, S. C., Okrah, K., Paulson, J. N., Quackenbush, J. F., Irizarry, R. A., & Bravo, H. C. (2017) · Biostatistics · doi:10.1093/biostatistics/kxx028 · Cited by 147
Kuperstein, I., Bonnet, É., Nguyen, H.-A., Cohen, D., Viara, E., Grieco, L., Fourquet, S., Calzone, L., Russo, C., Kondratova, M., et al. (2015) · Oncogenesis · doi:10.1038/oncsis.2015.19 · Cited by 149
Chang, Y., Lin, H.-H., Liu, W.-Y., Yu, C.-P., Chen, H.-J., Wartini, P. P., Kao, Y.-Y., Wu, Y., Lin, J.-J., Lu, M. J., et al. (2019) · Proceedings of the National Academy of Sciences · doi:10.1073/pnas.1817621116 · Cited by 144
“To compare the RPKMs of the selected genes across time points in a set of transcriptomes, we applied the upper-quartile normalization procedure (29).”
MethodA stacking ensemble deep learning approach to cancer type classification based on TCGA data
Mohammed, M., Mwambi, H. G., Mboya, I. B., Elbashir, M. K., & Omolo, B. (2021) · Scientific Reports · doi:10.1038/s41598-021-95128-x · Cited by 149
Guo, W., Τzioutziou, N. A., Stephen, G., Milne, I., Calixto, C. P. G., Waugh, R., Brown, J. W. S., & Zhang, R. (2020) · RNA Biology · doi:10.1080/15476286.2020.1858253 · Cited by 140
“Read counts can be normalized using Trimmed Mean of M-values (TMM), Relative Log Expression (RLE) or upper-quartile method [29].”
MethodComparison of normalization methods for differential gene expression analysis in RNA-Seq experiments
Maza, É., Frasse, P., Senin, P., Bouzayen, M., & Zouine, M. (2013) · Communicative & Integrative Biology · doi:10.4161/cib.25849 · Cited by 145
Orvis, T., Hepperla, A. J., Walter, V., Song, S., Simon, J. M., Parker, J. S., Wilkerson, M. D., Desai, N. R., Major, M. B., Hayes, D. N., et al. (2014) · Cancer Research · doi:10.1158/0008-5472.can-14-0061 · Cited by 137
Artieri, C. G., & Fraser, H. B. (2014) · Genome Research · doi:10.1101/gr.175893.114 · Cited by 136
Yu, D., Huber, W. K., & Vitek, O. (2013) · Bioinformatics · doi:10.1093/bioinformatics/btt143 · Cited by 134
Optimization of miRNA-seq data preprocessing
Tam, S., Tsao, M., & McPherson, J. D. (2015) · Briefings in Bioinformatics · doi:10.1093/bib/bbv019 · Cited by 136
Weinroth, M. D., Belk, A. D., Dean, C. J., Noyes, N. R., Dittoe, D. K., Rothrock, M. J., Ricke, S. C., Myer, P. R., Henniger, M. T., Ramírez, G. A., et al. (2022) · Journal of Animal Science · doi:10.1093/jas/skab346 · Cited by 141
Nestler, J., Liu, S., Wen, T., Paschold, A., Marcon, C., Tang, H. M., Li, D., Li, L., Meeley, R. B., Sakai, H., et al. (2014) · The Plant Journal · doi:10.1111/tpj.12578 · Cited by 133
Single-Cell Transcriptomics: Current Methods and Challenges in Data Acquisition and Analysis
Adil, A., Kumar, V., Jan, A. T., & Asger, M. (2021) · Frontiers in Neuroscience · doi:10.3389/fnins.2021.591122 · Cited by 138
QQS orphan gene regulates carbon and nitrogen partitioning across species via NF-YC interactions
Li, L., Zheng, W., Zhu, Y., Ye, H., Tang, B., Arendsee, Z. W., Jones, D., Li, R., Ortiz, D., Zhao, X., et al. (2015) · Proceedings of the National Academy of Sciences · doi:10.1073/pnas.1514670112 · Cited by 131
CCR5 Governs DNA Damage Repair and Breast Cancer Stem Cell Expansion
Jiao, X., Velasco-Velázquez, M. A., Wang, M., Li, Z., Rui, H., Peck, A. R., Korkola, J. E., Chen, X., Xu, S., DuHadaway, J. B., et al. (2018) · Cancer Research · doi:10.1158/0008-5472.can-17-0915 · Cited by 133
“Read counts per gene in all samples were normalized using Upper Quartile normalization (35) and analyzed for differential expression using Partek's Gene Specific Analysis method (genes with less than 10 reads in any samplewere excluded).”
Ayoub, A. E., Oh, S., Xie, Y., Leng, J., Cotney, J., Dominguez, M. H., Noonan, J. P., & Rakic, P. (2011) · Proceedings of the National Academy of Sciences · doi:10.1073/pnas.1112213108 · Cited by 129
Deng, J., Thennavan, A., Dolgalev, I., Chen, T., Li, J., Marzio, A., Poirier, J. T., Peng, D. H., Bulatovic, M., Mukhopadhyay, S., et al. (2021) · Nature Cancer · doi:10.1038/s43018-021-00208-6 · Cited by 140
PROmiRNA: a new miRNA promoter recognition method uncovers the complex regulation of intronic miRNAs
Marsico, A., Huska, M. R., Lasserre, J., Hu, H., Vučićević, D., Musahl, A., Ørom, U. A., & Vingron, M. (2013) · Genome biology · doi:10.1186/gb-2013-14-8-r84 · Cited by 136
Gu, L., & Walters, J. R. (2017) · Genome Biology and Evolution · doi:10.1093/gbe/evx154 · Cited by 129
Cotney, J. L., Leng, J., Oh, S., DeMare, L. E., Reilly, S. K., Gerstein, M., & Noonan, J. P. (2012) · Genome Research · doi:10.1101/gr.129817.111 · Cited by 127
Graphical Models via Generalized Linear Models
Yang, E., Allen, G. I., Liu, Z., & Ravikumar, P. (2012) · Cited by 126
Sequence-dependent but not sequence-specific piRNA adhesion traps mRNAs to the germ plasm
Vourekas, A., Alexiou, P., Vrettos, N., Maragkakis, M., & Mourelatos, Z. (2016) · Nature · doi:10.1038/nature17150 · Cited by 128
Calgaro, M., Romualdi, C., Waldron, L., Risso, D., & Vitulo, N. (2020) · Genome biology · doi:10.1186/s13059-020-02104-1 · Cited by 126
“A similar result was previously observed in bulk RNA-seq data [32].”
ResultAn eight-miRNA signature as a potential biomarker for predicting survival in lung adenocarcinoma
Li, X., Shi, Y., Yin, Z., Xue, X., & Zhou, B. (2014) · Journal of Translational Medicine · doi:10.1186/1479-5876-12-159 · Cited by 123
Identification of a pan-cancer oncogenic microRNA superfamily anchored by a central core seed motif
Hamilton, M. P., Rajapakshe, K., Hartig, S. M., Reva, B. A., McLellan, M. D., Kandoth, C., Li, J., Zack, T. I., Gunaratne, P. H., Wheeler, D. A., et al. (2013) · Nature Communications · doi:10.1038/ncomms3730 · Cited by 123
Metadata
- Authors
- Bullard, J. H., Purdom, E., Hansen, K. D., & Dudoit, S.
- Affiliations
- University of California, Berkeley (US)
- Corresponding author
- Bullard, James H
- Venue
- BMC Bioinformatics
- Published
- 2010-02-18
- Volume
- 11
- Issue
- 1
- Pages
- 94-94
- ISSN
- 1471-2105 (ISSN-L)
- PMC
- PMC2838869
- OpenAlex
- W2156631105
- Cited by
- 1,680
- References
- 23
- Citations by year
- 2026: 29 · 2025: 51 · 2024: 69 · 2023: 68 · 2022: 92 · 2021: 132 · 2020: 127 · 2019: 123 · 2018: 123 · 2017: 133 · 2016: 121 · 2015: 129 · 2014: 161 · 2013: 128 · 2012: 98
- FWCI
- 41.79
- Type
- journal article
- Language
- en
- Open access
- gold
- doi.org
- Licence
- Locations
- BMC Bioinformatics (publishedVersion, cc-by)
- PubMed Central (publishedVersion, cc-by)
- PubMed (publishedVersion)
- Collection of Biostatistics Research Archive (submittedVersion)
- DOAJ (DOAJ: Directory of Open Access Journals) (submittedVersion, cc-by-sa)
- eScholarship (California Digital Library) (submittedVersion)
- Funders
- National Science Foundation
- National Institutes of Health
- National Human Genome Research Institute (U01HG004271)
- Topics
- Life Sciences › Biochemistry, Genetics and Molecular Biology › Molecular Biology › Gene expression and cancer classification
- Life Sciences › Biochemistry, Genetics and Molecular Biology › Molecular Biology › Genomics and Phylogenetic Studies
- Life Sciences › Biochemistry, Genetics and Molecular Biology › Molecular Biology › Single-cell and spatial transcriptomics
- Keywords
- mRNA-seq, read count normalization, differential gene expression, method comparison
- MeSH terms
- RNA, Messenger, Sequence Analysis, RNA, Computational Biology, Databases, Genetic
About these checks
Registry, retraction, Cites and statistics results are computed, not judged, with one exception: a printed reference that no index lists is read once by a model before it counts as a citation error. Claims are extracted by a model and kept only when their quote appears verbatim in the text; each cited source is then checked, with a model’s help, for whether it says what the claim relies on. Those verdicts can be wrong — read the claim’s quote and the cited source before relying on one.
Statistics and arithmetic are recomputed, not judged.
Confidence bands are shown only for fields calibrated on our annotated test set. None is calibrated yet, so no band is shown.
What counts as a claim ›How we measure confidence ›How we check this ›
Are you an author, or do you see a problem with this page? Request a review
