

The DOI matches its Crossref record; 22 of the 23 references it cites were found in a registry or an index.
Evaluation of statistical methods for normalization and differential expression in mRNA-Seq experiments
Open accessAbstract
BACKGROUND: High-throughput sequencing technologies, such as the Illumina Genome Analyzer, are powerful new tools for investigating a wide range of biological and medical questions. Statistical and computational methods are key for drawing meaningful and accurate conclusions from the massive and complex datasets generated by the sequencers. We provide a detailed evaluation of statistical methods for normalization and differential expression (DE) analysis of Illumina transcriptome sequencing (mRNA-Seq) data. RESULTS: We compare statistical methods for detecting genes that are significantly DE between two types of biological samples and find that there are substantial differences in how the test statistics handle low-count genes. We evaluate how DE results are affected by features of the sequencing platform, such as, varying gene lengths, base-calling calibration method (with and without phi X control lane), and flow-cell/library preparation effects. We investigate the impact of the read count normalization method on DE results and show that the standard approach of scaling by total lane counts (e.g., RPKM) can bias estimates of DE. We propose more general quantile-based normalization procedures and demonstrate an improvement in DE detection. CONCLUSIONS: Our results have significant practical and methodological implications for the design and analysis of mRNA-Seq experiments. They highlight the importance of appropriate statistical methods for normalization and DE inference, to account for features of the sequencing platform that could impact the accuracy of results. They also reveal the need for further research in the development of statistical and computational methods for mRNA-Seq.
Overview
The claims and statistics of this paper haven’t been checked yet.
Run the check — free, no account needed. It reads the open-access text and checks the sources it cites.
Integrity signals
Registry
Cites
Statistics
Figures
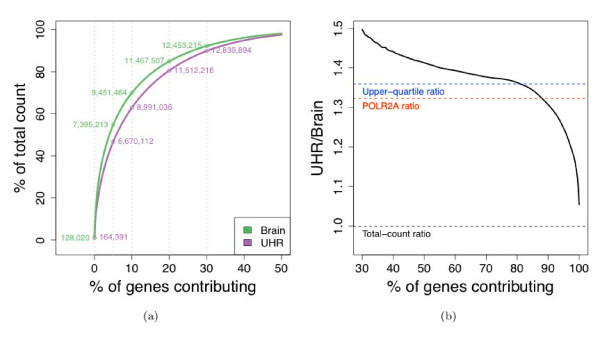
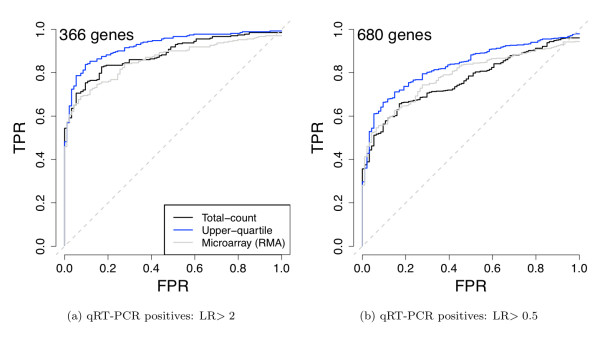
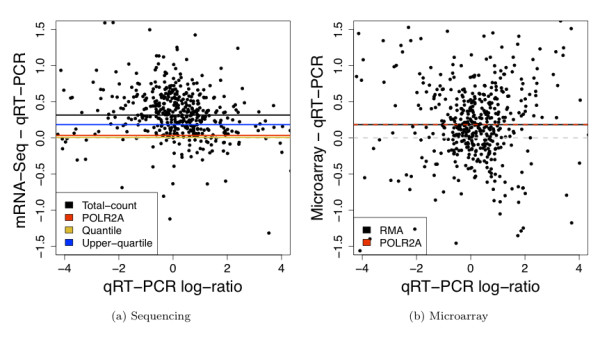
![Figure 8 Comparison of normalization procedures: Goodness-of-fit of Poisson model. The multiplicative Poisson model (GLM 1 in [Additional file 2: Supplemental Table S4]) is fit to the seven Brain lanes in the MAQC-2 experiment after (a) total-count, (b) POLR2A, (c) upper-quartile, and (d) quantile normalization. Goodness-of-fit statistics are computed and displayed in χ2 quantile-quantile plots. Genes with goodness-of-fit statistics in the top quantiles of the χ2-distribution are displayed using colored plotting symbols: red (1, 5]%, purple (.1, 1]%, gold [0, .1]%. Similar plots for UHR show the same patterns.](/paper-figures/d99eb5ce90ee4a9ebac8c9f438b4c283/evaluation-of-statistical-methods-for-normalization-and-differential-expression-figure-8.jpg)
Verification
Claims the paper makes
The claims and statistics of this paper haven’t been checked yet.
Run the check — free, no account needed. It reads the open-access text and checks the sources it cites.
Claims other papers make about this one
Each is checked against this paper’s own text: does it say what the citing paper says it does?
The source backs part of the claim, not all of it — or backs it for a different population, condition or comparison.
In the citing paper
“These approaches rely on normalizing methods that are based on total or effective counts, and tend to perform poorly when samples have heterogeneous transcript distributions, that is, when highly and differentially expressed features can skew the count distribution [45, 46].”
From A survey of best practices for RNA-seq data analysis (2016) · cites this paper as [45]
Experimental — accuracy not yet measuredIn the citing paper
“While reproducibility in RNA-seq is usually high at the level of sequencing [1, 45], other steps such as RNA extraction and library preparation are noisier and may introduce biases in the data that can be minimized by adopting good experimental procedures (Box 2).”
From A survey of best practices for RNA-seq data analysis (2016) · cites this paper as [45]
Self-check
Percentages, sums and reported differences re-computed from the paper’s own numbers.
The self-check needs the paper’s full text.
Citations
Cites
Ultrafast and memory-efficient alignment of short DNA sequences to the human genome.
Langmead, B., Trapnell, C., Pop, M., & Salzberg, S. L. (2009) · Genome Biology · doi:10.1186/gb-2009-10-3-r25 · Cited by 21,849 · cited 1×
“We used Bowtie to map reads to the genome (GRCh37 assembly) [ 16 ].”
Method(2005) · Springer eBooks · doi:10.1007/0-387-27255-0_9 · Cited by 20,333
Mapping and quantifying mammalian transcriptomes by RNA-Seq
Mortazavi, A., Williams, B. A., McCue, K., Schaeffer, L., & Wold, B. (2008) · Nature Methods · doi:10.1038/nmeth.1226 · Cited by 13,696 · cited 6×
“These high-throughput sequencing technologies have already been applied to monitor genome-wide transcription levels (mRNA-Seq), DNA-protein interactions (ChIP-Seq), chromatin structure, and DNA methylation [1-9].”
BackgroundMethodInfluentialSmyth, G. K. (2004) · Statistical Applications in Genetics and Molecular Biology · doi:10.2202/1544-6115.1027 · Cited by 11,829
Exploration, normalization, and summaries of high density oligonucleotide array probe level data
Irizarry, R. A. (2003) · Biostatistics · doi:10.1093/biostatistics/4.2.249 · Cited by 10,603
Base-Calling of Automated Sequencer Traces Using Phred. I. Accuracy AssessmentPreprint
Ewing, B., Hillier, L., Wendl, M. C., & Green, P. (1998) · Genome Research · doi:10.1101/gr.8.3.175 · Cited by 6,993
Base-Calling of Automated Sequencer Traces Using Phred. II. Error Probabilities
Ewing, B., & Green, P. (1998) · Genome Research · doi:10.1101/gr.8.3.186 · Cited by 5,439 · cited 1×
“quality scores for the other seven lanes [[15], Supplementary Information, p. 7]. Bustard can also be run using the auto-calibration method, which scores basecalls in a manner similar to the phred base-caller [ 17 ] and does not require a control lane per flow-cell.”
MethodAlternative isoform regulation in human tissue transcriptomes
Wang, E. T., Sandberg, R., Luo, S., Khrebtukova, I., Zhang, L., Mayr, C., Kingsmore, S. F., Schroth, G. P., & Burge, C. B. (2008) · Nature · doi:10.1038/nature07509 · Cited by 5,181
Accurate whole human genome sequencing using reversible terminator chemistry
Bentley, D. R., Balasubramanian, S., Swerdlow, H. P., Smith, G. P., Milton, J., Brown, C. G., Hall, K. P., Evers, D. J., Barnes, C. L., Bignell, H. R., et al. (2008) · Nature · doi:10.1038/nature07517 · Cited by 3,684 · cited 1×
“quality scores for the other seven lanes [[15], Supplementary Information, p.”
BackgroundRNA-seq: An assessment of technical reproducibility and comparison with gene expression arrays
Marioni, J. C., Mason, C. E., Mane, S. M., Stephens, M., & Gilad, Y. (2008) · Genome Research · doi:10.1101/gr.079558.108 · Cited by 2,771 · cited 7×
“These high-throughput sequencing technologies have already been applied to monitor genome-wide transcription levels (mRNA-Seq), DNA-protein interactions (ChIP-Seq), chromatin structure, and DNA methylation [1-9].”
BackgroundMethodResultInfluential
Research works printed but not linked: 4
- Illumina:Sequencing Analysis Software User Guide For Pipeline Version 1.3 and CASAVA Version 1.0 T. Illumina, Inc.; 2008. [Part # 1005359 Rev. A] [ http://icom.illumina.com/icom/software.ilmn?id=277 ] [Part # 1005359 Rev. A]
- Illumina:Preparing Samples for Sequencing mRNA. Ilumina, Inc.; 2009. [Part # 1004898 Rev. A] [ http://icom.illumina.com/icom/software.ilmn?id=277 ] [Part # 1004898 Rev. A]
- Taub MA: Analysis of high-throughput biological data: some statistical problems in RNA-seq and mouse genotyping. PhD thesis. Department of Statistics, UC Berkeley; 2009.
- Irizarry RA, Hobbs B, Collin F, Beazer-Barclay YD, Antonellis KJ, Scherf U, Speed TP: Exploration, normalization, and summaries of high density oligonucleotide array probe level data. Biostatistics 2003, 4(1465–4644 (Print)):249–64. 10.1093/biostatistics/4.2.249 · DOI · Paper page
Cited by
Sorted by citations
Items 701–800 of 999
Deep Sequencing Identified Dysregulated Circulating MicroRNAs in Late Onset Preeclampsia
Mavreli, D., Lykoudi, A., Lambrou, G. Ι., Papaioannou, G., VRACHNIS, N., Kalantaridou, S., Papantoniou, N., & Kοlialexi, A. (2020) · In Vivo · doi:10.21873/invivo.12044 · Cited by 23
When to use Quantile Normalization?Preprint
Hicks, S. C., & Irizarry, R. A. (2014) · bioRxiv (Cold Spring Harbor Laboratory) · doi:10.1101/012203 · Cited by 25
Role of the fatty pancreatic infiltration in pancreatic oncogenesis
Frendi, S., Martineau, C., Cazier, H., Nicolle, R., Chassac, A., Albuquerque, M., Raffenne, J., Faouder, J. L., Paradis, V., Cros, J. F., et al. (2024) · Scientific Reports · doi:10.1038/s41598-024-57294-6 · Cited by 23
“Raw Gene expression profiles were normalized using the upper-quartile approach and log2 + 1 transformed 31 .”
Grätz, C., Schuster, M., Brandes, F., Meidert, A. S., Kirchner, B., Reithmair, M., Schelling, G., & Pfaffl, M. W. (2024) · Molecular Aspects of Medicine · doi:10.1016/j.mam.2024.101269 · Cited by 26
“While normalization is strictly necessary to correct for differences in sequencing depth, gene lengths or GC content (Bullard et al., 2010), special attention has to be paid to gene expression distributions to avoid skewing of data bases, especially in small RNA data sets.”
Unifying Gene Expression Measures from Multiple Platforms Using Factor Analysis
Wang, X. V., Verhaak, R. G. W., Purdom, E. A., Spellman, P. T., & Speed, T. P. (2011) · PLoS ONE · doi:10.1371/journal.pone.0017691 · Cited by 22
Self-citationWoldesemayat, A. A., Heusden, P. V., Ndimba, B. K., & Christoffels, A. G. (2017) · BMC Genetics · doi:10.1186/s12863-017-0584-5 · Cited by 24
“Non-parametric Fisher’s exact test [77] was used to evaluate the effect of treatments on the gene expression outcome, and a FDR calculation [78] for genes identified at p < 0.”
MethodBişğin, H., Gong, B., Wang, Y., & Tong, W. (2018) · Frontiers in Genetics · doi:10.3389/fgene.2018.00022 · Cited by 23
“In order to see the normalization effect in the number of DEMs, we further added normalization into the equation with three methods [TMM (Robinson and Oshlack, 2010), RLE (Bullard et al., 2010), and upper quartile (Bullard et al., 2010)] in EdgeR while also observing the changes without any normalization (NO).”
MethodFortes, M. R. S., Zacchi, L. F., Nguyen, L. T., Raidan, F. S. S., Weller, M. M. D. C. A., Choo, J. J. Y., Reverter, A., REGO, J. P. A. D., Boe-Hansen, G. B., Neto, L. R. P., et al. (2018) · Animal Genetics · doi:10.1111/age.12721 · Cited by 23
Wang, M., & Allen, G. I. (2019) · PubMed · doi:10.48550/arxiv.1912.05449 · Cited by 23
“One approach is to perform standard clustering procedures on transformed data (Anders and Huber 2010; Bullard et al. 2010; Marioni et al. 2008; Robinson and Oshlack 2010).”
BackgroundRusso, M., Sobh, A., Zhang, P., Loguinov, A. V., Tagmount, A., Vulpe, C. D., & Liu, B. (2020) · Toxicological Sciences · doi:10.1093/toxsci/kfaa071 · Cited by 23
Differential expression analysis using a model-based gene clustering algorithm for RNA-seq data
Osabe, T., Shimizu, K., & Kadota, K. (2021) · BMC Bioinformatics · doi:10.1186/s12859-021-04438-4 · Cited by 25
MOCCASIN: a method for correcting for known and unknown confounders in RNA splicing analysis
Slaff, B., Radens, C. M., Jewell, P. D., Jha, A., Lahens, N. F., Grant, G. R., Thomas‐Tikhonenko, A., Lynch, K. W., & Barash, Y. (2021) · Nature Communications · doi:10.1038/s41467-021-23608-9 · Cited by 24
Kim, W. K., Olson, A. W., Mi, J., Wang, J., Lee, D., Le, V. L., Hiroto, A., Aldahl, J., Nenninger, C. H., Buckley, A. J., et al. (2022) · Nature Communications · doi:10.1038/s41467-022-32119-0 · Cited by 23
Deng, Y., Diepstraten, S. T., Potts, M. A., Giner, G., Trezise, S., Ng, A. P., Healey, G., Kane, S. R., Cooray, A., Behrens, K., et al. (2022) · Nature Communications · doi:10.1038/s41467-022-32485-9 · Cited by 22
Wang, B., Sun, F., & Luan, Y. (2024) · Scientific Reports · doi:10.1038/s41598-024-57670-2 · Cited by 26
“Upper Quartile (UQ) 14,40 : Similar to TSS, it scales each sample by the upper quartile of counts different from 0 in that sample. where q 3 ( ) is the function of estimating upper quartile, and P j = { c ij | c ij > 0, i = 1, · · · , n represents a set of counts different from 0 in sample j .”
BackgroundAltered microRNA expression in bovine skeletal muscle with age
Sun, J., Sonstegard, T. S., Li, C., Huang, Y., Li, Z., Lan, X., Zhang, C., Lei, C., Zhao, X., & Chen, H. (2015) · Animal Genetics · doi:10.1111/age.12272 · Cited by 25
SigFuge: single gene clustering of RNA-seq reveals differential isoform usage among cancer samples
Kimes, P. K., Cabanski, C. R., Wilkerson, M. D., Zhao, N., Johnson, A., Perou, C. M., Makowski, L., Maher, C. A., Liu, Y., Marron, J. S., et al. (2014) · Nucleic Acids Research · doi:10.1093/nar/gku521 · Cited by 23
Domingos, S., Fino, J., Paulo, O. S., Oliveira, C. M., & Goulão, L. F. (2016) · Plant Science · doi:10.1016/j.plantsci.2015.12.009 · Cited by 23
Juárez, A., Villa, J. A., Lanza, V. F., Lázaro, B., de la Cruz, F., Álvarez, H. M., & Moncalián, G. (2017) · Microbial Cell Factories · doi:10.1186/s12934-017-0651-7 · Cited by 23
“We represent gene expression as reads per kilobase (RPK) and the data was normalized by quantiles according to [27].”
MethodLee, B. H., & Stallcup, M. R. (2017) · Journal of Biological Chemistry · doi:10.1074/jbc.m117.782607 · Cited by 23
“Gene expression levels were normalized with the upper quantile method, and low-expressing genes were excluded so that genes with more than one count per million in at least three samples were analyzed (58).”
MethodYoon, S., & Nam, D. (2017) · BMC Genomics · doi:10.1186/s12864-017-3809-0 · Cited by 23
“Therefore, appropriate normalization should be applied to make the gene expression levels comparable or to estimate the model parameters [10 – 12].”
MethodBerghoff, B. A., Karlsson, T., Källman, T., Wagner, E. G. H., & Grabherr, M. G. (2017) · BioData Mining · doi:10.1186/s13040-017-0150-8 · Cited by 23
“Discussion Adequate normalization of RNA-seq data is an essential step required to reliably predict differentially expressed genes [2].”
BackgroundMethodInfluentialCalfee, G., Danger, J. L., Jain, I., Miller, E. W., Sarkar, P., Tjaden, B. C., Kreikemeyer, B., & Sumby, P. (2017) · Infection and Immunity · doi:10.1128/iai.00792-17 · Cited by 23
“Sequencing data from different experiments were normalized using upper-quartile normalization (65).”
MethodYu, S., Chen, C., Pan, Y., Kurz, M. C., Datner, E. M., Hendry, P. L., Velilla, M., Lewandowski, C., Pearson, C., Domeier, R. M., et al. (2018) · American Journal of Medical Genetics Part B Neuropsychiatric Genetics · doi:10.1002/ajmg.b.32706 · Cited by 22
Daverey, A., Levytskyy, R. M., Stanke, K. M., Viana, M. P., Swenson, S. A., Hayward, S. L., Narasimhan, M., Khalimonchuk, O., & Kidambi, S. (2019) · Scientific Reports · doi:10.1038/s41598-019-49327-2 · Cited by 25
Cavé‐Radet, A., Giraud, D., Lima, O., Amrani, A. E., Aïnouche, M. L., & Salmon, A. (2019) · Plant Molecular Biology · doi:10.1007/s11103-019-00931-w · Cited by 22
León, C., Cifuentes, A., & Valdés, A. (2018) · Comprehensive analytical chemistry · doi:10.1016/bs.coac.2018.06.008 · Cited by 23
On Differential Gene expression Using RNA-Seq Data
Lee, J. H., Ji, Y., Liang, S., Cai, G., & Müller, P. (2011) · Cancer Informatics · doi:10.4137/cin.s7473 · Cited by 22
Jiang, X., Xiao, G., & Li, Q. (2022) · Statistics in Medicine · doi:10.1002/sim.9530 · Cited by 22
Mesquita-Ribeiro, R., Fort, R. S., Rathbone, A., Farías, J., Lucci, C., James, V. H., Sotelo-Silveira, J. R., Duhagon, M. A., & Dajas‐Bailador, F. (2021) · RNA Biology · doi:10.1080/15476286.2021.2000792 · Cited by 26
“RPKM, FPKM and TPM), are based on total or effective counts, and perform less well with samples that have heterogeneous distributions with highly and differentially expressed features, which can skew count distribution [77].”
BackgroundMethodAddressing the mean-correlation relationship in co-expression analysis
Wang, Y., Hicks, S. C., & Hansen, K. D. (2022) · PLoS Computational Biology · doi:10.1371/journal.pcbi.1009954 · Cited by 31
“It has been experimentally verified that Y | Z = z* Poisson(z) for bulk RNA-seq data [26, 27].”
BackgroundSelf-citationRNA Sequencing Unveils Very Small RNAs With Potential Regulatory Functions in Bacteria
Diallo, I., Ho, J., Lalaouna, D., Massé, É., & Provost, P. (2022) · Frontiers in Molecular Biosciences · doi:10.3389/fmolb.2022.914991 · Cited by 23
“sRNA read counts were normalized as tag counts per million (Bullard et al., 2010).”
MethodElbashir, M. K., Mohammed, M., Mwambi, H. G., & Omolo, B. (2023) · Applied Sciences · doi:10.3390/app13042403 · Cited by 23
Pascual, T., Fernández-Martínez, A., Agrawal, Y., Pfefferle, A. D., Chic, N., Brasó‐Maristany, F., González‐Farré, B., Paré, L., Villacampa, G. J., Saura, C., et al. (2024) · npj Breast Cancer · doi:10.1038/s41523-024-00625-7 · Cited by 22
“Raw read counts for all RNAseq samples were normalized to a fi xed upper quartile 53 .”
MethodLu, J., & Bushel, P. R. (2013) · Gene · doi:10.1016/j.gene.2013.06.052 · Cited by 21
An integrative method to normalize RNA-Seq data
Filloux, C., Meersseman, C., Philippe, R., Forestier, L., Klopp, C., Rocha, D., Maftah, A. A., & Daniel, P. T. (2014) · BMC Bioinformatics · doi:10.1186/1471-2105-15-188 · Cited by 24
Goodness-of-Fit Tests and Model Diagnostics for Negative Binomial Regression of RNA Sequencing Data
Mi, G., Di, Y., & Schafer, D. W. (2015) · PLoS ONE · doi:10.1371/journal.pone.0119254 · Cited by 22
Taghavi, S., Wu, X. B., Ouyang, L., Zhang, Y. B., Stadler, A. L., McCorkle, S., Zhu, W., Maslov, S., & van der Lelie, D. (2015) · PLoS ONE · doi:10.1371/journal.pone.0115455 · Cited by 23
Transcriptomes of Frankia sp. strain CcI3 in growth transitions
Bickhart, D. M., & Benson, D. R. (2011) · BMC Microbiology · doi:10.1186/1471-2180-11-192 · Cited by 22
Classifying next-generation sequencing data using a zero-inflated Poisson model
Zhou, Y., Wan, X., Zhang, B., & Tong, T. (2017) · Bioinformatics · doi:10.1093/bioinformatics/btx768 · Cited by 22
Signor, S. A., & Nuzhdin, S. V. (2018) · Heredity · doi:10.1038/s41437-018-0136-4 · Cited by 22
PRY-1/Axin signaling regulates lipid metabolism in Caenorhabditis elegans
Ranawade, A., Mallick, A., & Gupta, B. P. (2018) · PLoS ONE · doi:10.1371/journal.pone.0206540 · Cited by 22
“To avoid biases between samples, the gene counts were quantile normalized [48, 51].”
A novel normalization and differential abundance test framework for microbiome data
Ma, Y., Luo, Y., & Jiang, H. (2020) · Bioinformatics · doi:10.1093/bioinformatics/btaa255 · Cited by 22
Batmanov, K., Wang, W. J., Bjørås, M., Delabie, J., & Wang, J. (2017) · Scientific Reports · doi:10.1038/s41598-017-07226-4 · Cited by 22
Yang, S., Cai, Q., Bard, J., Jamison, J. L., Wang, J., Yang, W., & Hu, B. H. (2015) · Hearing Research · doi:10.1016/j.heares.2015.04.010 · Cited by 22
“These analyses feature large dynamic ranges and reduced variations in techniques (Bullard et al., 2010; Marioni et al., 2008; Mortazavi et al., 2008).”
BackgroundMethodGenomic basis for RNA alterations revealed by whole-genome analyses of 27 cancer typesPreprint
PCAWG Transcriptome Core Group, Calabrese, C., Davidson, N. R., Fonseca, N. A., He, Y., Kahles, A., Lehmann, K.-V., Liu, F., Shiraishi, Y., Soulette, C. M., et al. (2017) · bioRxiv (Cold Spring Harbor Laboratory) · doi:10.1101/183889 · Cited by 25
Liu, G., Vijayaraman, S. B., Dong, Y., Li, X., Andongma, B. T., Zhao, L., Tu, J., He, J., & Lin, L. (2020) · BMC Genomics · doi:10.1186/s12864-020-6621-1 · Cited by 19
Chida, T., Ishida, Y., Morioka, S., Sugahara, G., Han, C., Lam, B., Yamasaki, C., Sugahara, R., Li, M., Tanaka, Y., et al. (2023) · JCI Insight · doi:10.1172/jci.insight.162404 · Cited by 18
“Finally, read counts per gene in all samples were normalized using upper quartile normalization (57) and analyzed for differential expression using the Partek gene-specific analysis method.”
MethodJames, A. B., Sharples, C., Laird, J., Armstrong, E. M., Guo, W., Τzioutziou, N. A., Zhang, R., Brown, J. W. S., Nimmo, H. G., & Jones, M. A. (2023) · New Phytologist · doi:10.1111/nph.19339 · Cited by 21
Ramı́rez, L., Oguiza, J. A., Pérez, G., Lavín, J. L., Omarini, A., Santoyo, F., Alfaro, M., Castanera, R., Parenti, A., Muguerza, E., et al. (2011) · PubMed · doi:10.2436/20.1501.01.141 · Cited by 21
LFCseq: a nonparametric approach for differential expression analysis of RNA-seq data
Lin, B., Zhang, L., & Chen, X. (2014) · BMC Genomics · doi:10.1186/1471-2164-15-s10-s7 · Cited by 21
Horizontally transferred genes in the genome of Pacific white shrimp, Litopenaeus vannamei
Yuan, J., Zhang, X., Liu, C.-Z., Wei, J., Li, F., & Xiang, J. (2013) · BMC Evolutionary Biology · doi:10.1186/1471-2148-13-165 · Cited by 21
An empirical Bayes normalization method for connectivity metrics in resting state fMRI
Chen, S., Kang, J., & Wang, G. (2015) · Frontiers in Neuroscience · doi:10.3389/fnins.2015.00316 · Cited by 21
“…in order to mitigate the subjectwise systematic shift/noises and to improve the accuracy of differential expression detection by transforming the expression metrics to a comparable scale across subjects (Bolstad et al., 2003; Bullard et al., 2010; Robinson and Oshlack, 2010; Hansen et al., 2012).”
BackgroundNovel prognostic markers within the CD44‐stromal ligand network in pancreatic cancer
Franklin, O., Billing, O., Öhlund, D., Berglund, A., Herdenberg, C., Wang, W., Hellman, U., & Sund, M. (2018) · The Journal of Pathology Clinical Research · doi:10.1002/cjp2.122 · Cited by 21
“mRNA expression data were generated by first aligning RNA-Seq reads with a reference genome followed by normalisation using the fragments per kilobase of transcript per million mapped reads, the upper quartile method [29,30].”
MethodStability of methods for differential expression analysis of RNA-seq data
Lin, B., & Pang, Z. (2019) · BMC Genomics · doi:10.1186/s12864-018-5390-6 · Cited by 21
“While DE methods have been applied to identify features whose expression levels change between conditions and there have been many efforts to systematically compare these methods [10–12], an important question that has not been fully addressed is: how reliable is the selected set of features?”
MethodSiegrist, K. J., Romo, D., Upham, B. L., Armstrong, M., Quinn, K. D., Vanderlinden, L. A., Osgood, R. S., Velmurugan, K., Elie, M. R., Manke, J., et al. (2019) · Toxicological Sciences · doi:10.1093/toxsci/kfz030 · Cited by 22
MuSA: a graphical user interface for multi-OMICs data integration in radiogenomic studies
Zanfardino, M., Castaldo, R., Pane, K., Affinito, O., Aiello, M., Salvatore, M., & Franzese, M. (2021) · Scientific Reports · doi:10.1038/s41598-021-81200-z · Cited by 24
Ong, C. E. B., Patchett, A. L., Darby, J. M., Chen, J., Liu, G., Lyons, A. B., Woods, G. M., & Flies, A. S. (2021) · Journal of Cancer Research and Clinical Oncology · doi:10.1007/s00432-021-03601-x · Cited by 22
Fala, A. M., de Oliveira, J. F., Adamóski, D., Aricetti, J. A., Dias, M. M., Dias, M. V. B., Sforça, M. L., de Oliveira, P. S. L., Rocco, S. A., Caldana, C., et al. (2015) · Scientific Reports · doi:10.1038/srep12698 · Cited by 22
Zhao, S., Prenger, K., & Smith, L. (2013) · ISRN Bioinformatics · doi:10.1155/2013/481545 · Cited by 21
Monot, M., Orgeur, M., Camiade, É., Brehier, C., & Dupuy, B. (2014) · OMICS A Journal of Integrative Biology · doi:10.1089/omi.2013.0119 · Cited by 21
Manually curated and harmonised transcriptomics datasets of psoriasis and atopic dermatitis patients
Federico, A., Hautanen, V., Christian, N., Kremer, A., Serra, A., & Greco, D. (2020) · Scientific Data · doi:10.1038/s41597-020-00696-8 · Cited by 21
Introduction to Sequencing the Brain Transcriptome
Hitzemann, R., Darakjian, P., Walter, N., Dan Iancu, O., Searles, R., & McWeeney, S. (2014) · International Review of Neurobiology · doi:10.1016/b978-0-12-801105-8.00001-1 · Cited by 20
Voronina, V. A., Harris, F. M., Schmahl, J., Galligan, C., Oristian, D., Zamfirova, R., Gong, G., Bai, Y., Fury, W., Rajamani, S., et al. (2018) · Biology of Reproduction · doi:10.1093/biolre/ioy210 · Cited by 20
DREAMSeq: An Improved Method for Analyzing Differentially Expressed Genes in RNA-seq Data
Gao, Z., Zhao, Z., & Tang, W. (2018) · Frontiers in Genetics · doi:10.3389/fgene.2018.00588 · Cited by 22
“In early RNA-seq studies where only technical replicates were used, the traditional Poisson model was highly capable of fitting read-count data characterized by equidispersion (i.e., the variance is equal to the mean) (Marioni et al., 2008; Bullard et al., 2010).”
MethodOncogenic effects of germline variants in lysosomal storage disease genes
Shin, J., Kim, D., Kim, H., Choi, M., Korbel, J. O., Yoon, S., Koh, Y., & on behalf of the PCAWG Germline Cancer Genome Working Group and the ICGC/TCGA Pan-Cancer Analysis of Whole Genomes Network (2019) · Genetics in Medicine · doi:10.1038/s41436-019-0588-9 · Cited by 21
Exometabolite Dynamics over Stationary Phase Reveal Strain-Specific Responses
Chodkowski, J. L., & Shade, A. L. (2020) · mSystems · doi:10.1128/msystems.00493-20 · Cited by 19
“A cumulative abundance plot was generated for each strain by organizing locus identifications from low transcript counts to high transcript counts and plotting the percentage of total transcripts against the percentage of total read counts (59, 60).”
MethodJosephs, E. B., Etten, M. L. V., Harkess, A., Platts, A. E., & Baucom, R. S. (2021) · Evolution Letters · doi:10.1002/evl3.241 · Cited by 20
“…settings (minimum 10 counts-per-million per gene) to filter the gene set to 25,534 genes (Chen et al. 2016) We calculated normalization factors that scale each sample by raw library size with Edgr’s calcNormFactors function (Anders and Huber 2010; Bullard et al. 2010; Robinson and Oshlack 2010).”
MethodOtero-Blanca, A., Pérez‐Llano, Y., Reboledo, G., Lira‐Ruan, V., Padilla‐Chacón, D., Folch‐Mallol, J. L., Sánchez‐Carbente, M. D. R., de León, I. P., & Batista‐García, R. A. (2021) · Journal of Fungi · doi:10.3390/jof7080677 · Cited by 20
“Expression data were normalized using the upper quartile method [137] for the removal of variation between samples, and differential expression analysis was performed using DESeq2 [138].”
MethodSilveira, G. O., Amaral, M. S., Coelho, H. S., Maciel, L. F., Pereira, A. S. A., Olberg, G. G. D. O., Miyasato, P. A., Nakano, E., & Verjovski‐Almeida, S. (2021) · Scientific Reports · doi:10.1038/s41598-021-96055-7 · Cited by 19
den Berge, K. V., Chou, H.-J., de Bézieux, H. R., Street, K., Risso, D., Ngai, J., & Dudoit, S. (2022) · Cell Reports Methods · doi:10.1016/j.crmeth.2022.100321 · Cited by 19
“FQ normalization (Bullard et al., 2010), another popular normalization method, also”
MethodSelf-citationModeling transcriptional networks regulating secondary growth and wood formation in forest trees
Liu, L., Filkov, V., & Groover, A. T. (2013) · Physiologia Plantarum · doi:10.1111/ppl.12113 · Cited by 20
Solano-Aguilar, G. I., Molokin, A., Botelho, C. A., Fiorino, A., Vinyard, B. T., Li, R., Chen, C. T., Urban, J. F., Dawson, H. D., Andreyeva, I., et al. (2016) · PLoS ONE · doi:10.1371/journal.pone.0147426 · Cited by 21
“It has been suggested that high variability between biological replicates (over-dispersion) necessitates the use of a distribution model that incorporates mean and dispersion parameters to better model the mean-variance relationship such as the negative binomial model [93], that is implemented in DESeq2 and edgeR [22].”
MethodA functional single nucleotide polymorphism of SET8 is prognostic for breast cancer
Liu, B., Zhang, X., Song, F., Liu, Q., Dai, H., Zheng, H., Cui, P., Zhang, L., Zhang, W., & Chen, K. (2016) · Oncotarget · doi:10.18632/oncotarget.9099 · Cited by 20
“Level 3 normalized mRNA expression was normalized with the quantile method using the R/Bioconductor package of preprocessCore [41].”
MethodManna, P. R., Ahmed, A. U., Yang, S., Narasimhan, M., Cohen-Tannoudji, J., Slominski, A. T., & Pruitt, K. (2019) · Cancers · doi:10.3390/cancers11050623 · Cited by 20
“StAR mRNA expressed as upper quartile-normalized fragments per kilobase of transcript per million mapped reads (fpkm+uq+1), generated by TCGA, was plotted using the Box and Whisker plot [38].”
Vandenbon, A. (2022) · PLoS ONE · doi:10.1371/journal.pone.0263344 · Cited by 20
“In addition to correcting the data using ComBat and removeBatchEffect we also considered 2 other options.”
MethodZhang, Y., Schlüter, J., Zhang, L., Cao, X., Jenq, R. R., Feng, H., Haines, J. L., & Zhang, L. (2024) · Computational and Structural Biotechnology Journal · doi:10.1016/j.csbj.2024.11.003 · Cited by 23
Charkiewicz, R., Pilz, L. R., Sulewska, A., Kozłowski, M., Niklinska, W. E., Moniuszko, M., Reszeć, J., Manegold, C., & Nikliński, J. (2015) · International Journal of Cancer · doi:10.1002/ijc.29816 · Cited by 19
“Our choice of hsa-miR-103 as one of two endogenous controls resulted from recent reports indicating that its use as a normalizer for miRNA qRT-PCR data can be superior to the use of 5S rRNA, U6 snRNA or total RNA.28 Indeed, hsa-miR-103 was demonstrated as a high-quality normalizer independent on the type of sample pre…”
ResultInfluentialDiscovering Functions of Unannotated Genes from a Transcriptome Survey of Wild Fungal Isolates
Ellison, C., Kowbel, D., Glass, N., Taylor, J. W., & Brem, R. (2014) · mBio · doi:10.1128/mbio.01046-13 · Cited by 23
An optimized protocol for generation and analysis of Ion Proton sequencing reads for RNA-Seq
Yuan, Y., Xu, H., & Leung, R. K. (2016) · BMC Genomics · doi:10.1186/s12864-016-2745-8 · Cited by 19
“With growing interest in applying RNA-Seq for transcriptome annotation, novel transcript discovery, gene expression and other applications, systemic deviations and reproducibility are the two issues that cannot be ignored [13, 46, 47].”
BackgroundAltered Expression of Transfer-RNA-Derived Small RNAs in Human With Rheumatic Heart Disease
Yang, Z., Li, P., Li, Z., Tang, T., Liu, W., & Wang, Y. (2021) · Frontiers in Cardiovascular Medicine · doi:10.3389/fcvm.2021.716716 · Cited by 19
Count ratio model reveals bias affecting NGS fold changes
Erhard, F., & Zimmer, R. (2015) · Nucleic Acids Research · doi:10.1093/nar/gkv696 · Cited by 19
“We show that fold change estimates are significantly improved by our method using data from the MAQC project (26,27) and that about 20% of genes that are called differentially expressed are affected in a standard RNA-seq setting.”
MethodInfluentialDifferential Expression Analysis for RNA-Seq Data
Gupta, R., Dewan, I., Bharti, R., & Bhattacharya, A. (2012) · ISRN Bioinformatics · doi:10.5402/2012/817508 · Cited by 19
DGEclust: differential expression analysis of clustered count data
Vavoulis, D. V., Francescatto, M., Heutink, P., & Gough, J. (2015) · Genome biology · doi:10.1186/s13059-015-0604-6 · Cited by 18
Comparative studies of differential gene calling using RNA-Seq data
Zheng, X., & Moriyama, E. N. (2013) · BMC Bioinformatics · doi:10.1186/1471-2105-14-s13-s7 · Cited by 19
Knutson, A. K., Rechtsteiner, A., & Strome, S. (2016) · Proceedings of the National Academy of Sciences · doi:10.1073/pnas.1523402113 · Cited by 18
“1C, the RPKM values for this figure were further normalized with Upper Quartile normalization (47).”
MethodLiu, J., Xu, Y., Gao, Y.-L., Zheng, C.-H., Wang, D., & Zhu, Q. (2015) · IEEE Transactions on Computational Biology and Bioinformatics · doi:10.1109/tcbb.2015.2440265 · Cited by 19
“, Maqc [31] and Wang [30].”
Single nucleotide polymorphism discovery in bovine liver using RNA-seq technology
Pareek, C. S., Błaszczyk, P., Dziuba, P., Czarnik, U., Fraser, L., Sobiech, P., Pierzchała, M., Feng, Y., Kadarmideen, H. N., & Kumar, D. (2017) · PLoS ONE · doi:10.1371/journal.pone.0172687 · Cited by 22
Stress response to CO2 deprivation by Arabidopsis thaliana in plant cultures
Banerjee, S., Siemianowski, O., Liu, M., Lind, K. R., Tian, X., Nettleton, D. S., & Cademartiri, L. (2019) · PLoS ONE · doi:10.1371/journal.pone.0212462 · Cited by 19
Höllbacher, B., Balázs, K., Heinig, M., & Uhlenhaut, N. H. (2020) · Computational and Structural Biotechnology Journal · doi:10.1016/j.csbj.2020.05.018 · Cited by 20
“Importantly, the choice of normalization method has a bigger impact on the results than the mapping method or the test statistics used for finding differentially expressed genes [71,72].”
PsiNorm: a scalable normalization for single-cell RNA-seq data
Borella, M., Martello, G., Risso, D., & Romualdi, C. (2021) · Bioinformatics · doi:10.1093/bioinformatics/btab641 · Cited by 19
“More robust scaling procedures have been proposed in the bulk RNA-seq literature, such as TMM (Robinson and Oshlack, 2010), geometric mean scaling (DESeq2; Anders and Huber, 2010), and upper-quartile scaling (Bullard et al., 2010).”
Method(Post-)Genomics approaches in fungal research
Pontes, M. V. A., de Vries, R. P., & Zhou, M. (2014) · Briefings in Functional Genomics · doi:10.1093/bfgp/elu028 · Cited by 17
Distinct transcriptional profiles of ozone stress in soybean ( Glycine max ) flowers and pods
Leisner, C. P., Ming, R., & Ainsworth, E. A. (2014) · BMC Plant Biology · doi:10.1186/preaccept-1747364832135869 · Cited by 20
Universal Count Correction for High-Throughput Sequencing
Hashimoto, T., Edwards, M. D., & Gifford, D. K. (2014) · PLoS Computational Biology · doi:10.1371/journal.pcbi.1003494 · Cited by 19
Improving RNA-Seq expression estimation by modeling isoform- and exon-specific read sequencing rate
Liu, X., Shi, X., Chen, C., & Zhang, L. (2015) · BMC Bioinformatics · doi:10.1186/s12859-015-0750-6 · Cited by 19
“We further use the method in [20] to filter 198 differential expression (DE) genes and 81 non-DE multi-isoform genes (see Additional file 2: Table S2) with high confidence according to qRT-PCR measurements.”
MethodLiu, Y., Carbonetto, P. S., Willwerscheid, J., Oakes, S. A., Macleod, K. F., & Stephens, M. (2025) · Nature Genetics · doi:10.1038/s41588-024-01997-z · Cited by 21
Cardiovascular Transcriptomics and Epigenomics Using Next-Generation Sequencing
Wu, P.-Y., Chandramohan, R., Phan, J. H., Mahle, W. T., Gaynor, J. W., Maher, K., & Wang, M. D. (2014) · Circulation Cardiovascular Genetics · doi:10.1161/circgenetics.113.000129 · Cited by 18
Liu, S., Yang, Z., Li, G., Li, C., Luo, Y., Gong, Q., Xin, W., Li, T., Zhang, Z., Xing, B., et al. (2019) · Genomics Proteomics & Bioinformatics · doi:10.1016/j.gpb.2018.07.008 · Cited by 18
“Raw RSEM expected counts for all samples were normalized to the overall upper quartile [73].”
BackgroundrmRNAseq: differential expression analysis for repeated-measures RNA-seq data
Nguyen, Y., & Nettleton, D. S. (2020) · Bioinformatics · doi:10.1093/bioinformatics/btaa525 · Cited by 18
“Throughout this paper, we set C st to be the 0.75 quantile of RNA-seq sample read counts from subject s at time t according to the recommendation of Bullard et al. (2010).”
MethodInfluentialCoordinated analysis of exon and intron data reveals novel differential gene expression changes
Eghbalnia, H. R., Wilfinger, W. W., Mackey, K., & Chomczyński, P. (2020) · Scientific Reports · doi:10.1038/s41598-020-72482-w · Cited by 19
Metadata
- Authors
- Bullard, J. H., Purdom, E., Hansen, K. D., & Dudoit, S.
- Affiliations
- University of California, Berkeley (US)
- Corresponding author
- Bullard, James H
- Venue
- BMC Bioinformatics
- Published
- 2010-02-18
- Volume
- 11
- Issue
- 1
- Pages
- 94-94
- ISSN
- 1471-2105 (ISSN-L)
- PMC
- PMC2838869
- OpenAlex
- W2156631105
- Cited by
- 1,680
- References
- 23
- Citations by year
- 2026: 29 · 2025: 51 · 2024: 69 · 2023: 68 · 2022: 92 · 2021: 132 · 2020: 127 · 2019: 123 · 2018: 123 · 2017: 133 · 2016: 121 · 2015: 129 · 2014: 161 · 2013: 128 · 2012: 98
- FWCI
- 41.79
- Type
- journal article
- Language
- en
- Open access
- gold
- doi.org
- Licence
- Locations
- BMC Bioinformatics (publishedVersion, cc-by)
- PubMed Central (publishedVersion, cc-by)
- PubMed (publishedVersion)
- Collection of Biostatistics Research Archive (submittedVersion)
- DOAJ (DOAJ: Directory of Open Access Journals) (submittedVersion, cc-by-sa)
- eScholarship (California Digital Library) (submittedVersion)
- Funders
- National Science Foundation
- National Institutes of Health
- National Human Genome Research Institute (U01HG004271)
- Topics
- Life Sciences › Biochemistry, Genetics and Molecular Biology › Molecular Biology › Gene expression and cancer classification
- Life Sciences › Biochemistry, Genetics and Molecular Biology › Molecular Biology › Genomics and Phylogenetic Studies
- Life Sciences › Biochemistry, Genetics and Molecular Biology › Molecular Biology › Single-cell and spatial transcriptomics
- Keywords
- mRNA-seq, read count normalization, differential gene expression, method comparison
- MeSH terms
- RNA, Messenger, Sequence Analysis, RNA, Computational Biology, Databases, Genetic
About these checks
Registry, retraction, Cites and statistics results are computed, not judged, with one exception: a printed reference that no index lists is read once by a model before it counts as a citation error. Claims are extracted by a model and kept only when their quote appears verbatim in the text; each cited source is then checked, with a model’s help, for whether it says what the claim relies on. Those verdicts can be wrong — read the claim’s quote and the cited source before relying on one.
Statistics and arithmetic are recomputed, not judged.
Confidence bands are shown only for fields calibrated on our annotated test set. None is calibrated yet, so no band is shown.
What counts as a claim ›How we measure confidence ›How we check this ›
Are you an author, or do you see a problem with this page? Request a review
