

The DOI matches its Crossref record; 22 of the 23 references it cites were found in a registry or an index.
Evaluation of statistical methods for normalization and differential expression in mRNA-Seq experiments
Open accessAbstract
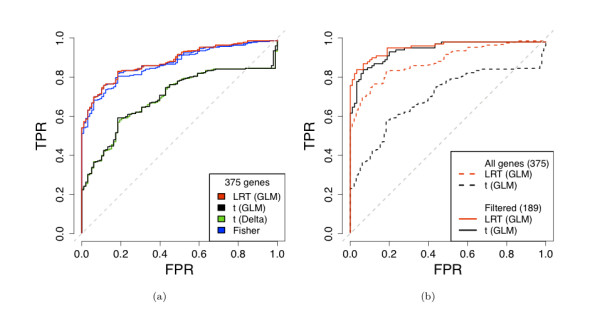
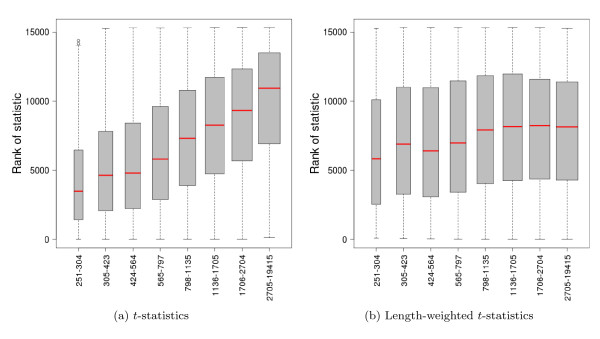
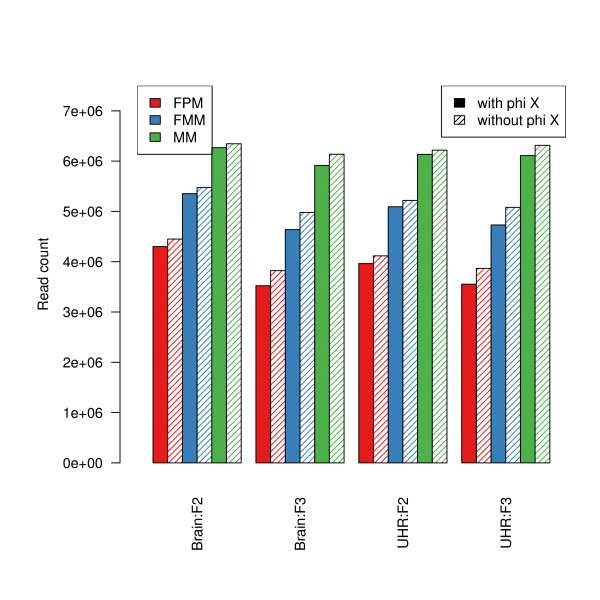
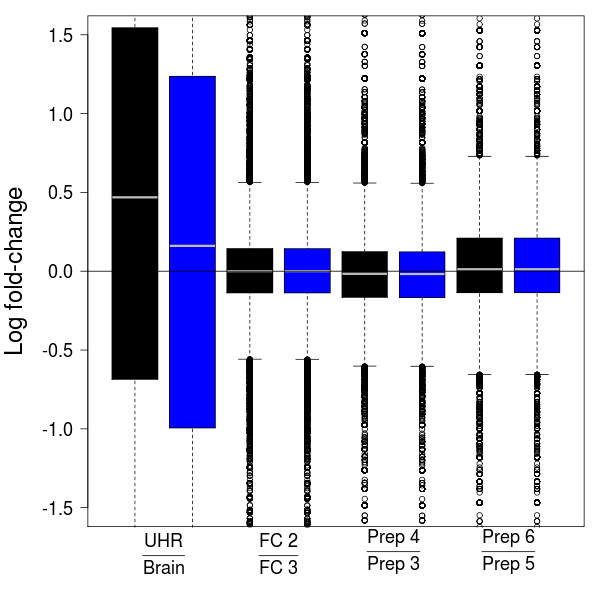
BACKGROUND: High-throughput sequencing technologies, such as the Illumina Genome Analyzer, are powerful new tools for investigating a wide range of biological and medical questions. Statistical and computational methods are key for drawing meaningful and accurate conclusions from the massive and complex datasets generated by the sequencers. We provide a detailed evaluation of statistical methods for normalization and differential expression (DE) analysis of Illumina transcriptome sequencing (mRNA-Seq) data. RESULTS: We compare statistical methods for detecting genes that are significantly DE between two types of biological samples and find that there are substantial differences in how the test statistics handle low-count genes. We evaluate how DE results are affected by features of the sequencing platform, such as, varying gene lengths, base-calling calibration method (with and without phi X control lane), and flow-cell/library preparation effects. We investigate the impact of the read count normalization method on DE results and show that the standard approach of scaling by total lane counts (e.g., RPKM) can bias estimates of DE. We propose more general quantile-based normalization procedures and demonstrate an improvement in DE detection. CONCLUSIONS: Our results have significant practical and methodological implications for the design and analysis of mRNA-Seq experiments. They highlight the importance of appropriate statistical methods for normalization and DE inference, to account for features of the sequencing platform that could impact the accuracy of results. They also reveal the need for further research in the development of statistical and computational methods for mRNA-Seq.
Overview
The claims and statistics of this paper haven’t been checked yet.
Run the check — free, no account needed. It reads the open-access text and checks the sources it cites.
Integrity signals
Registry
Cites
Statistics
Figures
![Figure 8 Comparison of normalization procedures: Goodness-of-fit of Poisson model. The multiplicative Poisson model (GLM 1 in [Additional file 2: Supplemental Table S4]) is fit to the seven Brain lanes in the MAQC-2 experiment after (a) total-count, (b) POLR2A, (c) upper-quartile, and (d) quantile normalization. Goodness-of-fit statistics are computed and displayed in χ2 quantile-quantile plots. Genes with goodness-of-fit statistics in the top quantiles of the χ2-distribution are displayed using colored plotting symbols: red (1, 5]%, purple (.1, 1]%, gold [0, .1]%. Similar plots for UHR show the same patterns.](/paper-figures/d99eb5ce90ee4a9ebac8c9f438b4c283/evaluation-of-statistical-methods-for-normalization-and-differential-expression-figure-8.jpg)
Verification
Claims the paper makes
The claims and statistics of this paper haven’t been checked yet.
Run the check — free, no account needed. It reads the open-access text and checks the sources it cites.
Claims other papers make about this one
Each is checked against this paper’s own text: does it say what the citing paper says it does?
The source backs part of the claim, not all of it — or backs it for a different population, condition or comparison.
In the citing paper
“These approaches rely on normalizing methods that are based on total or effective counts, and tend to perform poorly when samples have heterogeneous transcript distributions, that is, when highly and differentially expressed features can skew the count distribution [45, 46].”
From A survey of best practices for RNA-seq data analysis (2016) · cites this paper as [45]
Experimental — accuracy not yet measuredIn the citing paper
“While reproducibility in RNA-seq is usually high at the level of sequencing [1, 45], other steps such as RNA extraction and library preparation are noisier and may introduce biases in the data that can be minimized by adopting good experimental procedures (Box 2).”
From A survey of best practices for RNA-seq data analysis (2016) · cites this paper as [45]
Self-check
Percentages, sums and reported differences re-computed from the paper’s own numbers.
The self-check needs the paper’s full text.
Citations
Cites
Ultrafast and memory-efficient alignment of short DNA sequences to the human genome.
Langmead, B., Trapnell, C., Pop, M., & Salzberg, S. L. (2009) · Genome Biology · doi:10.1186/gb-2009-10-3-r25 · Cited by 21,849 · cited 1×
“We used Bowtie to map reads to the genome (GRCh37 assembly) [ 16 ].”
Method(2005) · Springer eBooks · doi:10.1007/0-387-27255-0_9 · Cited by 20,333
Mapping and quantifying mammalian transcriptomes by RNA-Seq
Mortazavi, A., Williams, B. A., McCue, K., Schaeffer, L., & Wold, B. (2008) · Nature Methods · doi:10.1038/nmeth.1226 · Cited by 13,696 · cited 6×
“These high-throughput sequencing technologies have already been applied to monitor genome-wide transcription levels (mRNA-Seq), DNA-protein interactions (ChIP-Seq), chromatin structure, and DNA methylation [1-9].”
BackgroundMethodInfluentialSmyth, G. K. (2004) · Statistical Applications in Genetics and Molecular Biology · doi:10.2202/1544-6115.1027 · Cited by 11,829
Exploration, normalization, and summaries of high density oligonucleotide array probe level data
Irizarry, R. A. (2003) · Biostatistics · doi:10.1093/biostatistics/4.2.249 · Cited by 10,603
Base-Calling of Automated Sequencer Traces Using Phred. I. Accuracy AssessmentPreprint
Ewing, B., Hillier, L., Wendl, M. C., & Green, P. (1998) · Genome Research · doi:10.1101/gr.8.3.175 · Cited by 6,993
Base-Calling of Automated Sequencer Traces Using Phred. II. Error Probabilities
Ewing, B., & Green, P. (1998) · Genome Research · doi:10.1101/gr.8.3.186 · Cited by 5,439 · cited 1×
“quality scores for the other seven lanes [[15], Supplementary Information, p. 7]. Bustard can also be run using the auto-calibration method, which scores basecalls in a manner similar to the phred base-caller [ 17 ] and does not require a control lane per flow-cell.”
MethodAlternative isoform regulation in human tissue transcriptomes
Wang, E. T., Sandberg, R., Luo, S., Khrebtukova, I., Zhang, L., Mayr, C., Kingsmore, S. F., Schroth, G. P., & Burge, C. B. (2008) · Nature · doi:10.1038/nature07509 · Cited by 5,181
Accurate whole human genome sequencing using reversible terminator chemistry
Bentley, D. R., Balasubramanian, S., Swerdlow, H. P., Smith, G. P., Milton, J., Brown, C. G., Hall, K. P., Evers, D. J., Barnes, C. L., Bignell, H. R., et al. (2008) · Nature · doi:10.1038/nature07517 · Cited by 3,684 · cited 1×
“quality scores for the other seven lanes [[15], Supplementary Information, p.”
BackgroundRNA-seq: An assessment of technical reproducibility and comparison with gene expression arrays
Marioni, J. C., Mason, C. E., Mane, S. M., Stephens, M., & Gilad, Y. (2008) · Genome Research · doi:10.1101/gr.079558.108 · Cited by 2,771 · cited 7×
“These high-throughput sequencing technologies have already been applied to monitor genome-wide transcription levels (mRNA-Seq), DNA-protein interactions (ChIP-Seq), chromatin structure, and DNA methylation [1-9].”
BackgroundMethodResultInfluential
Research works printed but not linked: 4
- Illumina:Sequencing Analysis Software User Guide For Pipeline Version 1.3 and CASAVA Version 1.0 T. Illumina, Inc.; 2008. [Part # 1005359 Rev. A] [ http://icom.illumina.com/icom/software.ilmn?id=277 ] [Part # 1005359 Rev. A]
- Illumina:Preparing Samples for Sequencing mRNA. Ilumina, Inc.; 2009. [Part # 1004898 Rev. A] [ http://icom.illumina.com/icom/software.ilmn?id=277 ] [Part # 1004898 Rev. A]
- Taub MA: Analysis of high-throughput biological data: some statistical problems in RNA-seq and mouse genotyping. PhD thesis. Department of Statistics, UC Berkeley; 2009.
- Irizarry RA, Hobbs B, Collin F, Beazer-Barclay YD, Antonellis KJ, Scherf U, Speed TP: Exploration, normalization, and summaries of high density oligonucleotide array probe level data. Biostatistics 2003, 4(1465–4644 (Print)):249–64. 10.1093/biostatistics/4.2.249 · DOI · Paper page
Cited by
Sorted by citations
Items 601–700 of 999
A colitogenic memory CD4+ T cell population mediates gastrointestinal graft-versus-host disease
Zhou, V., Agle, K. A., Chen, X., Beres, A. J., KOMOROWSKI, R. A., Belle, L., Taylor, C., Zhu, F., Haribhai, D., Williams, C. B., et al. (2016) · Journal of Clinical Investigation · doi:10.1172/jci80874 · Cited by 31
“Estimated counts were normalized to the upper quartile (61) before”
MethodA joint-L2,1-norm-constraint-based semi-supervised feature extraction for RNA-Seq data analysis
Liu, J., Wang, D., Gao, Y.-L., Zheng, C.-H., Shang, J., Liu, F., & Xu, Y. D. (2016) · Neurocomputing · doi:10.1016/j.neucom.2016.09.083 · Cited by 32
“Three publically available RNA-Seq data sets are used to evaluate our method, i.e., MAQC [37], Wang [38] and BodyMap [35].”
FLINO: a new method for immunofluorescence bioimage normalization
Graf, J. F., Cho, S., McDonough, E. M., Corwin, A. D., Sood, A., Lindner, A. U., Salvucci, M., Stachtea, X., Schaeybroeck, S. V., Dunne, P. D., et al. (2021) · Bioinformatics · doi:10.1093/bioinformatics/btab686 · Cited by 32
“We first assembled a list of normalization methods from the literature (Bullard, 2010; Hicks, 2018; Maza, 2013; Robinson and Oshlack, 2010; Tarazona, 2011, 2015).”
Kakati, T., Bhattacharyya, D. K., Kalita, J. K., & Norden‐Krichmar, T. M. (2022) · BMC Bioinformatics · doi:10.1186/s12859-021-04527-4 · Cited by 33
“Internally, TCGAanalyze_Normalization() utilizes the EDASeq package [41] to perform within-lane normalization and between-lane normalization [42].”
MethodPitfalls in the statistical analysis of microbiome amplicon sequencing data
Boshuizen, H. C., & Beest, D. E. T. (2022) · Molecular Ecology Resources · doi:10.1111/1755-0998.13730 · Cited by 32
“Based on this example we do not believe there is justification for using CCS, or similar methods such as the upper quartile method (Bullard et al., 2010), and suggest not using them as they only make results less interpretable and less comparable between studies.”
MethodRNAlysis: analyze your RNA sequencing data without writing a single line of code
Teichman, G., Cohen, D., Ganon, O., Dunsky, N., Shani, S., Gingold, H., & Rechavi, O. (2023) · BMC Biology · doi:10.1186/s12915-023-01574-6 · Cited by 30
“Moreover, RNAlysis allows users to pre-process their data by normalizing it through one of the various meth-ods (such as median of ratios, relative log ratio, trimmed mean of M-values, and more) [3, 9–12], filtering out lowly-expressed genes, and eliminating rows with missing data from their tables.”
MethodDifferential expression analysis for paired RNA-seq data
Chung, L. M., Ferguson, J. P., Zheng, W., Qian, F., Bruno, V. M., Montgomery, R. R., & Zhao, H. (2013) · BMC Bioinformatics · doi:10.1186/1471-2105-14-110 · Cited by 32
Time Series Expression Analyses Using RNA-seq: A Statistical Approach
Oh, S., Song, S., Grabowski, G. A., Zhao, H., & Noonan, J. P. (2013) · BioMed Research International · doi:10.1155/2013/203681 · Cited by 32
How does normalization impact RNA-seq disease diagnosis?
Han, H., & Men, K. (2018) · Journal of Biomedical Informatics · doi:10.1016/j.jbi.2018.07.016 · Cited by 32
Kaufmann, J., Wentzensen, N., Brinker, T. J., & Grabe, N. (2019) · Oncotarget · doi:10.18632/oncotarget.26808 · Cited by 32
Haralambieva, I. H., Oberg, A. L., Ovsyannikova, I. G., Kennedy, R. B., Grill, D. E., Middha, S., Bot, B. M., Wang, V. W., Smith, D. I., Jacobson, R. M., et al. (2013) · PLoS ONE · doi:10.1371/journal.pone.0062149 · Cited by 30
Systematic comparison of RNA-Seq normalization methods using measurement error models
Sun, Z., & Zhu, Y. (2012) · Bioinformatics · doi:10.1093/bioinformatics/bts497 · Cited by 29
Gene Ontology based housekeeping gene selection for RNA-seq normalization
Chen, C., Lu, Y., Sio, C.-P., Wu, G.-C., Tzou, W., & Pai, T. (2014) · Methods · doi:10.1016/j.ymeth.2014.01.019 · Cited by 31
DEXUS: identifying differential expression in RNA-Seq studies with unknown conditions
Klambauer, G., Unterthiner, T., & Hochreiter, S. (2013) · Nucleic Acids Research · doi:10.1093/nar/gkt834 · Cited by 31
Huang, H.-C. R., Niu, Y., & Qin, L. (2015) · Cancer Informatics · doi:10.4137/cin.s21631 · Cited by 31
The UEA Small RNA Workbench: A Suite of Computational Tools for Small RNA Analysis
Mohorianu, I. I., Stocks, M. B., Applegate, C., Folkes, L., & Moulton, V. (2017) · Methods in molecular biology · doi:10.1007/978-1-4939-6866-4_14 · Cited by 30
Association Analysis of Deep Genomic Features Extracted by Denoising Autoencoders in Breast Cancer
Liu, Q., & Hu, P. (2019) · Cancers · doi:10.3390/cancers11040494 · Cited by 31
Wang, J., Wang, C., Li, Q., Shen, M., Bai, P., Li, J., Lin, Y., Gan, N., Li, T., & Zhao, J. (2019) · Frontiers in Microbiology · doi:10.3389/fmicb.2019.01750 · Cited by 31
A new approach to bias correction in RNA-Seq
Jones, D. C., Ruzzo, W. L., Peng, X., & Katze, M. G. (2012) · Bioinformatics · doi:10.1093/bioinformatics/bts055 · Cited by 32
Identifying small interfering RNA loci from high-throughput sequencing data
Hardcastle, T. J., Kelly, K. A., & Baulcombe, D. C. (2011) · Bioinformatics · doi:10.1093/bioinformatics/btr687 · Cited by 31
Relating quantitative variation within a behavior to variation in transcription
Benowitz, K. M., McKinney, E. C., Cunningham, C. B., & Moore, A. J. (2017) · Evolution · doi:10.1111/evo.13273 · Cited by 30
“Thus, we argue that our results support an infinitesimal model of quantitative inheritance (Fisher 1918; Bulmer 1972), with many genes contributing an individually undetectable effect on phenotypic expression.”
ResultNaval-Sánchez, M., Potier, D., Haagen, L., Sánchez, M., Munck, S., de Sande, B. V., Casares, F., Christiaens, V., & Aerts, S. (2012) · Genome Research · doi:10.1101/gr.140426.112 · Cited by 31
Bi, Y., & Davuluri, R. V. (2013) · BMC Bioinformatics · doi:10.1186/1471-2105-14-262 · Cited by 30
Li, T. H., Xu, H., Teng, S., Suo, M., Bahitwa, R., Xu, M., Qian, Y., Ramstein, G. P., Song, B., Buckler, E. S., et al. (2024) · Proceedings of the National Academy of Sciences · doi:10.1073/pnas.2319811121 · Cited by 33
“TPM is used as it is proportional to the relative RNA molar concentration (47).”
Ghaffari, N., Yousefi, M. R., Johnson, C. D., Ivanov, I. V., & Dougherty, E. R. (2013) · BMC Bioinformatics · doi:10.1186/1471-2105-14-307 · Cited by 30
The analytical landscape of static and temporal dynamics in transcriptome data
Oh, S., Song, S., Dasgupta, N., & Grabowski, G. A. (2014) · Frontiers in Genetics · doi:10.3389/fgene.2014.00035 · Cited by 29
Dormancy within Staphylococcus epidermidis biofilms: a transcriptomic analysis by RNA-seq
Carvalhais, V. M. D., França, Â., Cerca, F., Vitorino, R. M. P., Pier, G. B., Vilanova, M., & Cerca, N. (2014) · Applied Microbiology and Biotechnology · doi:10.1007/s00253-014-5548-3 · Cited by 30
Ye, W., Lian, Q., Ye, C., & Wu, X. (2022) · Genomics Proteomics & Bioinformatics · doi:10.1016/j.gpb.2022.09.005 · Cited by 34
“So far, the most widely used datasets for evaluating pA tools for DNA sequences are the PASS dataset [68,69] of plant species, the ERPIN dataset [23] of human, and the DeepGSR dataset [27] of animal species; datasets for bulk RNA-seq are the MAQC dataset [123] and the HEK293 dataset [124]; and datasets for scRNA-seq a…”
MethodHubbard, K., Gut, I. M., Lyman, M. E., Tuznik, K. M., Mesngon, M. T., & McNutt, P. M. (2012) · BMC Neuroscience · doi:10.1186/1471-2202-13-127 · Cited by 28
Prevalence, Evolution, andcis-Regulation of Diel Transcription inChlamydomonas reinhardtii
Panchy, N. L., Wu, G., Newton, L. A., Tsai, C., Chen, J., Christoph Benning, A., Farré, E. M., & Shiu, S. (2014) · G3 Genes Genomes Genetics · doi:10.1534/g3.114.015032 · Cited by 28
Bang, B., Li, M., Tsai, K.-N., Aoyagi, H., Lee, S.-A., Machida, K., Aizaki, H., Jung, J. U., Ou, J. J., & Saito, T. (2019) · Journal of Virology · doi:10.1128/jvi.02302-18 · Cited by 28
“Finally, read counts per gene in all samples were normalized using upper quartile normalization (59) and analyzed for differential expression using the Partek gene-specific analysis method.”
MethodNormExpression: An R Package to Normalize Gene Expression Data Using Evaluated Methods
Wu, Z., Liu, W., Jin, X., 鱼得水, Wang, H., Glusman, G., Robinson, M., Liu, L., Ruan, J., & Gao, S. (2019) · Frontiers in Genetics · doi:10.3389/fgene.2019.00400 · Cited by 28
“Although the significance of gene expression data normalization has been 66 demonstrated [4], how to successfully select a normalization method is still a controversial 67 problem, particularly for scRNA-seq data.”
MethodPormehr, L. A., Ahmadian, S., Daftarian, N., Mousavi, S. A., & Shafiezadeh, M. (2019) · European Journal of Human Genetics · doi:10.1038/s41431-019-0531-1 · Cited by 29
Kiuru, M. H., Kriner, M., Wong, S. L., Zhu, G., Terrell, J. R., Li, Q., Hoang, M. L., Beechem, J., & McPherson, J. D. (2021) · Journal of Investigative Dermatology · doi:10.1016/j.jid.2021.06.041 · Cited by 29
“Raw counts were normalized to the upper quartile (Bullard et al., 2010) for each ROI to enable comparison across ROIs.”
MethodHypothermia and hemostasis in severe trauma
Alam, H. B., Pusateri, A. E., Kindzelski, A., Egan, D., Hoots, K. W., Andrews, M. T., Rhee, P., Tisherman, S. A., Mann, K. G., Vostal, J. G., et al. (2012) · The Journal of Trauma: Injury, Infection, and Critical Care · doi:10.1097/ta.0b013e318265d1b8 · Cited by 29
Poisson factor models with applications to non-normalized microRNA profiling
Lee, S., Chugh, P., Shen, H., Eberle, R., & Dittmer, D. P. (2013) · Bioinformatics · doi:10.1093/bioinformatics/btt091 · Cited by 29
A real-world multi-center RNA-seq benchmarking study using the Quartet and MAQC reference materials
Wang, D., Liu, Y., Zhang, Y., Chen, Q., Han, Y., Hou, W., Liu, C., Yu, Y., Li, Z., Li, Z., et al. (2024) · Nature Communications · doi:10.1038/s41467-024-50420-y · Cited by 28
“UQ normalization fi rst removes all zero-count genes and calculates a scaling factor for each sample to match the 75% quantile of the counts in all the samples 90 .”
Variation-preserving normalization unveils blind spots in gene expression profiling
Roca, C. P., Gomes, S. I. L., Amorim, M. J. B., & Scott-Fordsmand, J. J. (2017) · Scientific Reports · doi:10.1038/srep42460 · Cited by 30
“The normalization of gene expression, which is required to set a common reference level among samples (Smyth and Speed, 2003; Irizarry et al., 2003; Bullard et al., 2010; Garber et al., 2011; Dillies et al., 2013), is also reportedly problematic, affecting the reproducibility of results with both…”
InfluentialFlimma: a federated and privacy-aware tool for differential gene expression analysis
Zolotareva, O. I., Nasirigerdeh, R., Matschinske, J., Torkzadehmahani, R., Bakhtiari, M., Frisch, T., Späth, J., Blumenthal, D. B., Abbasinejad, A., Tieri, P., et al. (2021) · Genome biology · doi:10.1186/s13059-021-02553-2 · Cited by 31
“, normalization) [35], which may have a significant impact on the results [34].”
BackgroundMethodMicrobiomes of the Sydney Rock Oyster are acquired through both vertical and horizontal transmission
Unzueta‐Martínez, A., Scanes, E., Parker, L. M., Ross, P. M., O’Connor, W. A., & Bowen, J. L. (2022) · Animal Microbiome · doi:10.1186/s42523-022-00186-9 · Cited by 31
Gyarmati, G., Shroff, U. N., Riquier‐Brison, A., Desposito, D., Ju, W., Stocker, S. D., Izuhara, A. K., Deepak, S. K., Calderon, A. B., Burford, J. L., et al. (2024) · Journal of Clinical Investigation · doi:10.1172/jci174558 · Cited by 31
Impaired Cell Cycle Regulation in a Natural Equine Model of Asthma
Pacholewska, A., Jagannathan, V., Drögemüller, M., Klukowska‐Rötzler, J., Lanz, S., Hamza, E., Dermitzakis, E. T., Marti, E., Leeb, T., & Gerber, V. (2015) · PLoS ONE · doi:10.1371/journal.pone.0136103 · Cited by 31
Larráyoz, I. M., de Luis, A., Rúa, Ó., Velilla, S., Cabello, J., & Martı́nez, A. (2012) · PLoS ONE · doi:10.1371/journal.pone.0039359 · Cited by 28
Study of the activated macrophage transcriptome
Novoselov, V. V., Sazonova, M. A., Ivanova, E. A., & Orekhov, A. N. (2015) · Experimental and Molecular Pathology · doi:10.1016/j.yexmp.2015.09.014 · Cited by 29
Sand, M. S., Bechara, F. G., Gambichler, T., Sand, D., Friedländer, M. R., Bromba, M., Schnabel, R., & Hessam, S. (2015) · Annals of Oncology · doi:10.1093/annonc/mdv551 · Cited by 28
“The miRNA read counts were normalized as tag counts per million miRNA alignments [28].”
MethodBioinformatic analysis of bacteria and host cell dual RNA-sequencing experiments
Marsh, J. W., Hayward, R. J., Shetty, A. C., Mahurkar, A., Humphrys, M. S., & Myers, G. S. A. (2017) · Briefings in Bioinformatics · doi:10.1093/bib/bbx043 · Cited by 29
Comparison of multi-tissue aging between human and mouse
Zhuang, J., Zhang, L., Dai, S., Cui, L., Guo, C., Sloofman, L. G., & Yang, J. (2019) · Scientific Reports · doi:10.1038/s41598-019-42485-3 · Cited by 27
RNA-Seq: Improving Our Understanding of Retinal Biology and DiseasePreprint
Farkas, M. H., Au, E. D., Sousa, M. E., & Pierce, E. A. (2015) · Cold Spring Harbor Perspectives in Medicine · doi:10.1101/cshperspect.a017152 · Cited by 29
A comprehensive workflow for optimizing RNA-seq data analysis
Gao, J., Zheng, J.-Y., Ren, S.-N., Yin, W., Xia, X., Li, Y., & Wang, H. (2024) · BMC Genomics · doi:10.1186/s12864-024-10414-y · Cited by 28
“Modifying normalization parameters, hypothesis testing parameters, and fitting parameters in different DE methods are key considerations for users [12–15].”
MethodGobyWeb: Simplified Management and Analysis of Gene Expression and DNA Methylation Sequencing Data
Dorff, K. C., Chambwe, N., Zeno, Z., Simi, M., Shaknovich, R., & Campagne, F. (2013) · PLoS ONE · doi:10.1371/journal.pone.0069666 · Cited by 26
Comparative evaluation of gene set analysis approaches for RNA-Seq data
Rahmatallah, Y., Emmert‐Streib, F., & Glazko, G. V. (2014) · BMC Bioinformatics · doi:10.1186/s12859-014-0397-8 · Cited by 29
A multi-model statistical approach for proteomic spectral count quantitation
Branson, O. E., & Freitas, M. A. (2016) · Journal of Proteomics · doi:10.1016/j.jprot.2016.05.032 · Cited by 27
“Assuming that the majority proteins between sample conditions are not differentially expressed, an upper quartile (UQ) or weighted trimmed mean of M-values (TMM) normalization method provides a more robust approach to calculate a library size normalization factor [64, 65].”
MethodTuerk, A., Wiktorin, G., & Güler, S. (2017) · PLoS Computational Biology · doi:10.1371/journal.pcbi.1005515 · Cited by 27
BNP-Seq: Bayesian Nonparametric Differential Expression Analysis of Sequencing Count Data
Dadaneh, S. Z., Qian, X., & Zhou, M. (2017) · Journal of the American Statistical Association · doi:10.1080/01621459.2017.1328358 · Cited by 26
“2010] between each pair of samples or uses an upper quantile of samples [Bullard et al., 2010] for normalization [Robinson et al.”
BackgroundVisualization methods for differential expression analysis
Rutter, L. A., Lauter, A. N. M., Graham, M. A., & Cook, D. (2019) · BMC Bioinformatics · doi:10.1186/s12859-019-2968-1 · Cited by 30
Brennan, K., Zheng, H., Fahrner, J. A., Shin, J. H., Gentles, A. J., Schaefer, B., Sunwoo, J. B., Bernstein, J. A., & Gevaert, O. (2022) · Human Molecular Genetics · doi:10.1093/hmg/ddac026 · Cited by 27
“Gene-level counts were then normalized using upper quartile normalization (89), the method that was reported for TCGA projects: Raw RSEM counts were normalized by the 75th percentile of the column (patient sample) after excluding zeroes, and multiplied by 1000.”
Identification of miRNAs during mouse postnatal ovarian development and superovulation
Khan, H. A., Zhao, Y., Wang, L., Li, Q., Du, Y.-A., Yi, D., & Huo, L. (2015) · Journal of Ovarian Research · doi:10.1186/s13048-015-0170-2 · Cited by 27
Haks, M. C., Goeman, J. J., Magis-Escurra, C., & Ottenhoff, T. H. M. (2015) · Vaccine · doi:10.1016/j.vaccine.2015.04.054 · Cited by 26
“[6] Bullard JH, Purdom E, Hansen KD, Dudoit S.”
BackgroundOmics/systems biology and cancer cachexia
Gallagher, I. J., Jacobi, C., Tardif, N., Rooyackers, O., & Fearon, K. (2016) · Seminars in Cell and Developmental Biology · doi:10.1016/j.semcdb.2015.12.022 · Cited by 28
ABSSeq: a new RNA-Seq analysis method based on modelling absolute expression differences
Yang, W., Rosenstiel, P. C., & Schulenburg, H. (2016) · BMC Genomics · doi:10.1186/s12864-016-2848-2 · Cited by 28
“However, this approach was shown to introduce a bias in DE inference since DE genes can be responsive for large variations in total read number [36].”
InfluentialMoorey, S. E., Walker, B. N., Elmore, M. F., Elmore, J. B., Rodning, S. P. P., & Biase, F. H. (2020) · Scientific Reports · doi:10.1038/s41598-020-73694-w · Cited by 27
Genetics of Gene Expression in CNS
Pandey, A. K., & Williams, R. W. (2014) · International review of neurobiology · doi:10.1016/b978-0-12-801105-8.00008-4 · Cited by 27
Jiao, F., Wang, Q., Zhang, P., Bu, L.-L., Yan, J., & Tian, B. (2017) · Behavioural Brain Research · doi:10.1016/j.bbr.2017.04.044 · Cited by 26
“[19], and then take average of repeated data from the same.”
BackgroundLi, Q., Guindani, M., Reich, B. J., Bondell, H. D., & Vannucci, M. (2017) · Statistical Analysis and Data Mining The ASA Data Science Journal · doi:10.1002/sam.11350 · Cited by 26
“This is in contrast to typical approaches that use “hard” constraints as data-dependent plug-in estimates based on the observed counts, see for example [5], [12], [40], [42], and [59], which a priori condition the inference over unknown parameters on the observed counts.”
MethodResultVeras, P. S. T., Ramos, P. I. P., & de Menezes, J. P. B. (2018) · Frontiers in Cellular and Infection Microbiology · doi:10.3389/fcimb.2018.00326 · Cited by 27
“However, this property limits its application when biological replicates are available, when this assumption regarding variance does not hold because biological replicates typically present high variability (Bullard et al., 2010).”
BackgroundPeng, C., Huang, D., Shi, Y., Zhang, B., Sun, L., Li, M., Deng, X., & Wang, W. (2019) · The Science of The Total Environment · doi:10.1016/j.scitotenv.2019.04.328 · Cited by 26
Zerdes, I., Sifakis, E. G., Matikas, A., Chrétien, S., Tobin, N. P., Hartman, J., Rassidakis, G. Z., Bergh, J. C. S., & Foukakis, T. (2020) · Molecular Oncology · doi:10.1002/1878-0261.12654 · Cited by 27
“Briefly, these level 3 data have been produced after alignment of the raw reads to the human h19 genome assembly using MAPSPLICE (Wang et al., 2010), quantitation at the gene (and isoform) level using RSEM (Li and Dewey, 2011), and then applying upper-quartile normalization (Bullard et al., 2010).”
MethodTemporal Dynamic Methods for Bulk RNA-Seq Time Series Data
Oh, S., & Li, R. W. (2021) · Genes · doi:10.3390/genes12030352 · Cited by 26
“Normalization procedures outweigh differential methods themselves in determine the outcome in the identification of differentially expressed gene sets [36,45,47].”
BackgroundMethodYang, Z., Tang, T., Li, P., Li, X., Wu, Y., Feng, D., Hu, M., Dai, F., Zheng, F., Zhang, W., et al. (2022) · Phytomedicine · doi:10.1016/j.phymed.2022.154168 · Cited by 26
Approaches in Gene Coexpression Analysis in Eukaryotes
Zogopoulos, V. L., Saxami, G., Malatras, A., Papadopoulos, K. A., Tsotra, I., Iconomidou, V. A., & Michalopoulos, I. (2022) · Biology · doi:10.3390/biology11071019 · Cited by 27
“Algorithms such as Total Count [87], Quantile [88] and Upper Quartile [89], are purely based on arithmetic calculations concerning the read counts and their distributions in the samples, while TPM [90] and RPKM [91] take transcript length into account.”
MethodThe community ecology perspective of omics data
Jurburg, S. D., Buscot, F., Chatzinotas, A., Chaudhari, N. M., Clark, A. T., Garbowski, M., Grenié, M., Hom, E. F. Y., Karakoç, C., Marr, S., et al. (2022) · Microbiome · doi:10.1186/s40168-022-01423-8 · Cited by 31
“, differential detection) sensitive to the normalization method used [53].”
MethodLi, J., Tong, H., Zhang, P., Guo, G., Wang, Z., Wen, X., Dong, Z., & Tian, Y. (2014) · Scientific Reports · doi:10.1038/srep06277 · Cited by 26
Differential gene expression analysis using coexpression and RNA-Seq data
Yang, E.-W., Girke, T., & Jiang, T. (2013) · Bioinformatics · doi:10.1093/bioinformatics/btt363 · Cited by 27
Chlorobaculum tepidum TLS Displays a Complex Transcriptional Response to Sulfide Addition
Eddie, B., & Hanson, T. E. (2012) · Journal of Bacteriology · doi:10.1128/jb.01342-12 · Cited by 26
A contribution to the study of plant development evolution based on gene co-expression networks
Romero–Campero, F. J., Lucas-Reina, E., Said, F. E., Romero, J., & Valverde, F. (2013) · Frontiers in Plant Science · doi:10.3389/fpls.2013.00291 · Cited by 26
Transcriptomic Profiling Using Next Generation Sequencing - Advances, Advantages, and Challenges
Anamika, K., Verma, S. P., Jere, A., & Desai, A. (2016) · InTech eBooks · doi:10.5772/61789 · Cited by 32
Fortes, M. R. S., Nguyen, L. T., Weller, M. M. D. C. A., Cánovas, Á., Islas‐Trejo, A., Neto, L. R. P., Reverter, A., Lehnert, S. A., Boe-Hansen, G. B., Thomas, M. G., et al. (2016) · Journal of Animal Science · doi:10.2527/jas.2016-0471 · Cited by 26
Reeb, P., Bramardi, S. J., & Steibel, J. P. (2015) · PLoS ONE · doi:10.1371/journal.pone.0132310 · Cited by 26
“Although several methods[5,9,44] have been proposed to normalize data, especially for differential expression analysis, the impact of a particular normalization method seemed to be less important in classification and clustering analyses [12].”
MethodFeng, G., Wu, J., & Yi, H. (2019) · Scientific Data · doi:10.1038/s41597-019-0162-y · Cited by 26
Cer, R. Z., Herrera-Galeano, J. E., Anderson, J. J., Bishop‐Lilly, K. A., & Mokashi, V. P. (2014) · GigaScience · doi:10.1186/2047-217x-3-20 · Cited by 24
A sketch of known and novel MYCN-associated miRNA networks in neuroblastoma
Megiorni, F., Colaiacovo, M., Cialfi, S., McDowell, H. P., Guffanti, A., Camero, S., Felsani, A., Losty, P. D., Pizer, B. L., Shukla, R., et al. (2017) · Oncology Reports · doi:10.3892/or.2017.5701 · Cited by 25
“MNnA comparison was also performed with the edgeR generalized linear model (GLM) mode optimised for the analysis of data with sequence spikes (27), in order to confirm the obtained results with a second robust statistical approach well suited to handle outlier data.”
ResultBirnbaum, M. D., Zhao, N., Moorthy, B. T., Patel, D. M., Kryvenko, O. N., Heidman, L. M., Kumar, A., Morgan, W. M., Ban, Y. J., dos Reis, I. M., et al. (2018) · Oncogene · doi:10.1038/s41388-018-0462-2 · Cited by 25
Tiruvayipati, S., Wolfgeher, D. J., Yue, M., Duan, F., Andrade, J., Jiang, H., & Schuger, L. A. (2020) · PLoS ONE · doi:10.1371/journal.pone.0228871 · Cited by 26
“For an absolute quantitative count, the APEX proteomics tool [37] was used, which calculates abundances of protein expression based upon machine learning correction factors, LC/MS/MS spectral counts, and correct identification of protein PLOS ONE | https://doi.org/10.1371/journal.pone.0228871 March 2, 2020 5 / 19 prob…”
ResultInfluentialCui, D., Yin, Y., Huandong, L. I., Hu, X., Zhuang, J., Ma, R., & Jiao, Z. (2021) · Plasma Science and Technology · doi:10.1088/2058-6272/ac0686 · Cited by 25
Dynamic association rules for gene expression data analysis
Chen, S., Tsai, T.-H., Chung, C.-H., & Li, W. (2015) · BMC Genomics · doi:10.1186/s12864-015-1970-x · Cited by 26
“To take account of differences in the coverage/ depth of reads in different samples or experiments, normalization and bias correction methods have been developed [15].”
MethodCai, W., Wang, C., Li, Y., Yao, C., Shen, L., Liu, S., Bao, X., Schnable, P. S., Girton, J. R., Johansen, J., et al. (2014) · Nucleic Acids Research · doi:10.1093/nar/gku173 · Cited by 25
Detection of generic differential RNA processing events from RNA-seq data
Tran, V. D. T., Souiai, O., Romero-Barrios, N., Crespi, M. D., & Gautheret, D. (2016) · RNA Biology · doi:10.1080/15476286.2015.1118604 · Cited by 23
“We introduce a novel normalization approach, which is better adapted to event detection at nucleotide level than state-of-the-art methods, such as Total Count, Median, Upper Quartile, DESeq, RLE, and TMM 15-17 (See Fig.”
MethodRaithel, S., Johnson, L. C., Galliart, M., Brown, S., Shelton, J. M., Herndon, N., & Bello, N. M. (2016) · BMC Genomics · doi:10.1186/s12864-016-2442-7 · Cited by 23
“We adapted the approach proposed by Bullard [17] and defined highcount transcripts as the top 3 % transcripts with the highest relative abundance, which accounted for 60 % of total read counts (Fig.”
MethodInfluentialKe, S., Chen, S., Dong, Z., Hong, C. S., Zhang, Q., Tang, L., Yang, P., Zhai, J., Yan, H., Shen, F., et al. (2016) · Hepatology · doi:10.1002/hep.28889 · Cited by 28
“Level 3, normalized mRNA expression data (the calculated expression for all reads aligning to a particular mRNA per sample) were collected from the TCGA Data Portal using the Data Browser tool and quantile-normalized((19)) before performing downstream analysis.”
Improving Gene-Set Enrichment Analysis of RNA-Seq Data with Small Replicates
Yoon, S., Kim, S., & Nam, D. (2016) · PLoS ONE · doi:10.1371/journal.pone.0165919 · Cited by 27
Maize and millet transcription factors annotated using comparative genomic and transcriptomic data
Lin, J.-J., Yu, C.-P., Chang, Y., Chen, S. C.-C., & Li, W. (2014) · BMC Genomics · doi:10.1186/1471-2164-15-818 · Cited by 24
iSRAP – a one‐touch research tool for rapid profiling of small RNA‐seq data
Quek, C. Y. J., Jung, C., Bellingham, S. A., Lonie, A. J., & Hill, A. F. (2015) · Journal of Extracellular Vesicles · doi:10.3402/jev.v4.29454 · Cited by 23
An Optimal Test with Maximum Average Power While Controlling FDR with Application to RNA‐Seq Data
Si, Y., & Liu, P. (2013) · Biometrics · doi:10.1111/biom.12036 · Cited by 24
Bioinformatic analysis of retinal gene function and expression in diabetic rats
Zhao, W., Wang, D., Zhao, J. B., & Zhao, W. (2017) · Experimental and Therapeutic Medicine · doi:10.3892/etm.2017.4805 · Cited by 22
“…of DR and promote the appearance of other symptoms associated with DR. LRAT, RPE65 and RDH5 are involved in retinol metabolism, and these genes are all part of the visual cycle that recycles all-trans-retinal from bleached photoreceptors to the 11-cis-retina required for phototransduction (20).”
Transcriptomic analysis of early B-cell development in the chicken embryo
Nuthalapati, N., Evans, J. D., Taylor, R. L., Branton, S. L., Nanduri, B., & Pharr, G. T. (2019) · Poultry Science · doi:10.3382/ps/pez354 · Cited by 24
“The Poisson distribution, a common procedure in prior times, is not optimal for RNASeq data because it considers mean and variance to be equal (Bullard et al., 2010; Jiang et al., 2011; Anders and Huber, 2010).”
MethodGiraud, D., Lima, O., Rousseau‐Gueutin, M., Salmon, A., & Aïnouche, M. L. (2021) · Frontiers in Genetics · doi:10.3389/fgene.2021.589160 · Cited by 25
Hirayama, H., Takaki, Y., Abe, M., Imachi, H., Ikuta, T., Miyazaki, J., Tasumi, E., Uematsu, K., Tame, A., Tsuda, M., et al. (2021) · Applied and Environmental Microbiology · doi:10.1128/aem.00758-21 · Cited by 24
“The aligned read counts were normalized with upper quartile normalization (153), and transcripts per million (TPM) values were calculated for genes.”
MethodKupsco, A. J., Lee, J. J., Prada, D., Valvi, D., Hu, L., Petersen, M. S., Coull, B. A., Weihe, P., Grandjean, P., & Baccarelli, A. (2021) · Environment International · doi:10.1016/j.envint.2021.106986 · Cited by 24
Vannucci, F. A., Foster, D. N., & Gebhart, C. J. (2012) · PLoS ONE · doi:10.1371/journal.pone.0046708 · Cited by 24
Dynamic Changes in Chemosensory Gene Expression during the Dendrolimus punctatus Mating Process
Zhang, S., Zhang, Z., Kong, X., Wang, H., & Liu, F. (2018) · Frontiers in Physiology · doi:10.3389/fphys.2017.01127 · Cited by 24
“Unigene expression levels and DEGs were normalized following the compatible-hits-norm model (Bullard et al., 2010).”
Method
Metadata
- Authors
- Bullard, J. H., Purdom, E., Hansen, K. D., & Dudoit, S.
- Affiliations
- University of California, Berkeley (US)
- Corresponding author
- Bullard, James H
- Venue
- BMC Bioinformatics
- Published
- 2010-02-18
- Volume
- 11
- Issue
- 1
- Pages
- 94-94
- ISSN
- 1471-2105 (ISSN-L)
- PMC
- PMC2838869
- OpenAlex
- W2156631105
- Cited by
- 1,680
- References
- 23
- Citations by year
- 2026: 29 · 2025: 51 · 2024: 69 · 2023: 68 · 2022: 92 · 2021: 132 · 2020: 127 · 2019: 123 · 2018: 123 · 2017: 133 · 2016: 121 · 2015: 129 · 2014: 161 · 2013: 128 · 2012: 98
- FWCI
- 41.79
- Type
- journal article
- Language
- en
- Open access
- gold
- doi.org
- Licence
- Locations
- BMC Bioinformatics (publishedVersion, cc-by)
- PubMed Central (publishedVersion, cc-by)
- PubMed (publishedVersion)
- Collection of Biostatistics Research Archive (submittedVersion)
- DOAJ (DOAJ: Directory of Open Access Journals) (submittedVersion, cc-by-sa)
- eScholarship (California Digital Library) (submittedVersion)
- Funders
- National Science Foundation
- National Institutes of Health
- National Human Genome Research Institute (U01HG004271)
- Topics
- Life Sciences › Biochemistry, Genetics and Molecular Biology › Molecular Biology › Gene expression and cancer classification
- Life Sciences › Biochemistry, Genetics and Molecular Biology › Molecular Biology › Genomics and Phylogenetic Studies
- Life Sciences › Biochemistry, Genetics and Molecular Biology › Molecular Biology › Single-cell and spatial transcriptomics
- Keywords
- mRNA-seq, read count normalization, differential gene expression, method comparison
- MeSH terms
- RNA, Messenger, Sequence Analysis, RNA, Computational Biology, Databases, Genetic
About these checks
Registry, retraction, Cites and statistics results are computed, not judged, with one exception: a printed reference that no index lists is read once by a model before it counts as a citation error. Claims are extracted by a model and kept only when their quote appears verbatim in the text; each cited source is then checked, with a model’s help, for whether it says what the claim relies on. Those verdicts can be wrong — read the claim’s quote and the cited source before relying on one.
Statistics and arithmetic are recomputed, not judged.
Confidence bands are shown only for fields calibrated on our annotated test set. None is calibrated yet, so no band is shown.
What counts as a claim ›How we measure confidence ›How we check this ›
Are you an author, or do you see a problem with this page? Request a review
