

The DOI matches its Crossref record; 22 of the 23 references it cites were found in a registry or an index.
Evaluation of statistical methods for normalization and differential expression in mRNA-Seq experiments
Open accessAbstract
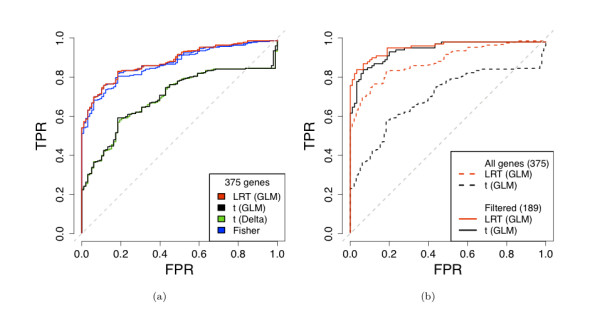
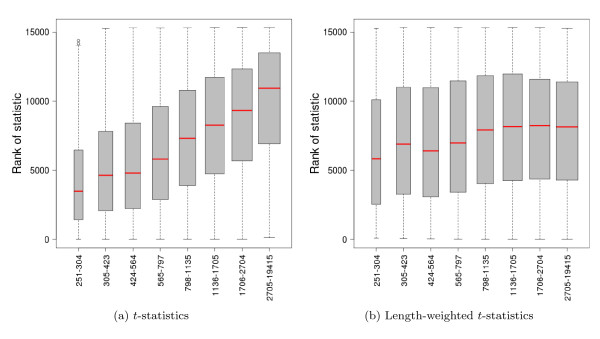
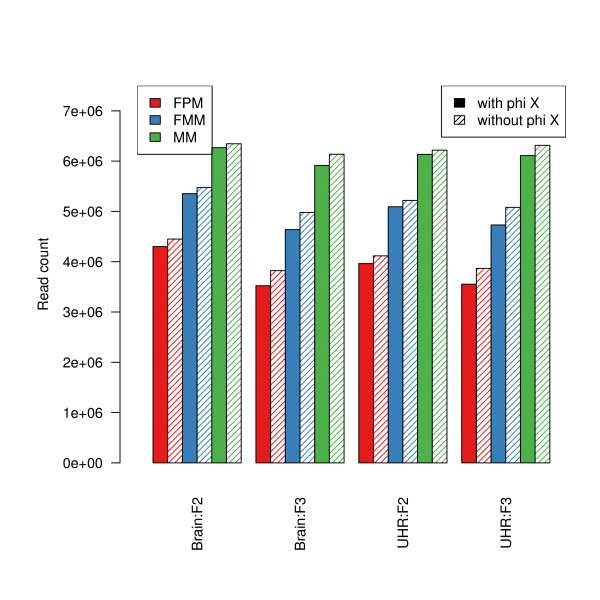
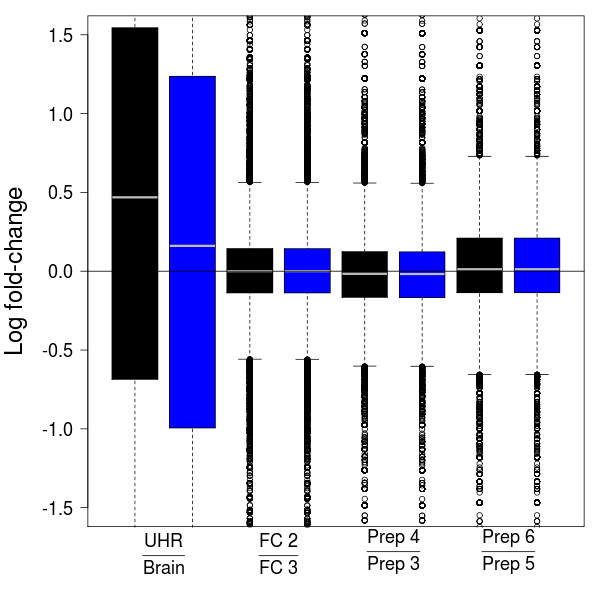
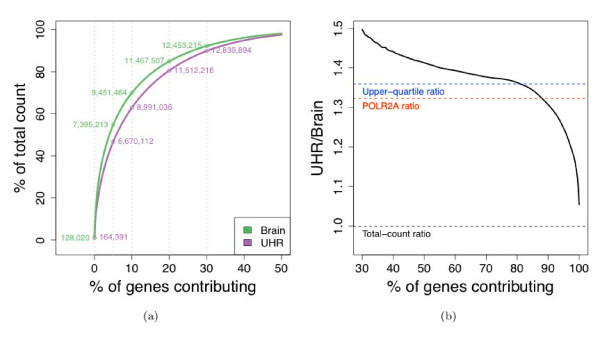
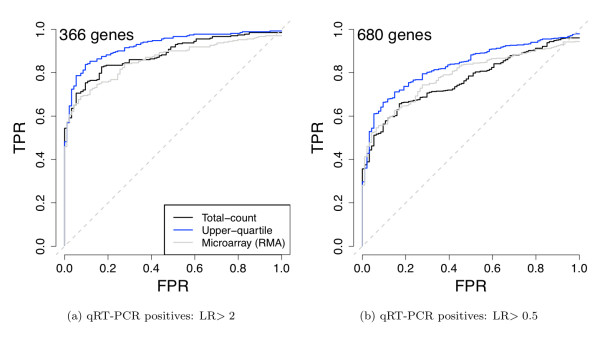
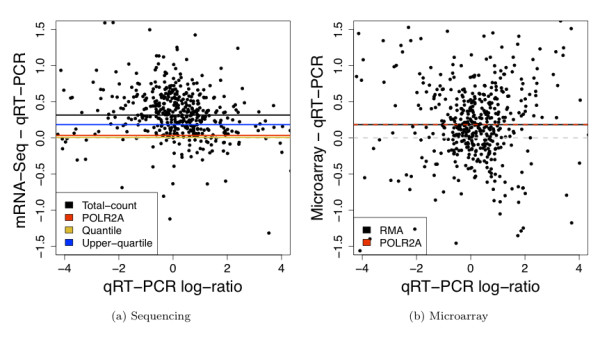
BACKGROUND: High-throughput sequencing technologies, such as the Illumina Genome Analyzer, are powerful new tools for investigating a wide range of biological and medical questions. Statistical and computational methods are key for drawing meaningful and accurate conclusions from the massive and complex datasets generated by the sequencers. We provide a detailed evaluation of statistical methods for normalization and differential expression (DE) analysis of Illumina transcriptome sequencing (mRNA-Seq) data. RESULTS: We compare statistical methods for detecting genes that are significantly DE between two types of biological samples and find that there are substantial differences in how the test statistics handle low-count genes. We evaluate how DE results are affected by features of the sequencing platform, such as, varying gene lengths, base-calling calibration method (with and without phi X control lane), and flow-cell/library preparation effects. We investigate the impact of the read count normalization method on DE results and show that the standard approach of scaling by total lane counts (e.g., RPKM) can bias estimates of DE. We propose more general quantile-based normalization procedures and demonstrate an improvement in DE detection. CONCLUSIONS: Our results have significant practical and methodological implications for the design and analysis of mRNA-Seq experiments. They highlight the importance of appropriate statistical methods for normalization and DE inference, to account for features of the sequencing platform that could impact the accuracy of results. They also reveal the need for further research in the development of statistical and computational methods for mRNA-Seq.
Overview
The claims and statistics of this paper haven’t been checked yet.
Run the check — free, no account needed. It reads the open-access text and checks the sources it cites.
Integrity signals
Registry
Cites
Statistics
Figures
![Figure 8 Comparison of normalization procedures: Goodness-of-fit of Poisson model. The multiplicative Poisson model (GLM 1 in [Additional file 2: Supplemental Table S4]) is fit to the seven Brain lanes in the MAQC-2 experiment after (a) total-count, (b) POLR2A, (c) upper-quartile, and (d) quantile normalization. Goodness-of-fit statistics are computed and displayed in χ2 quantile-quantile plots. Genes with goodness-of-fit statistics in the top quantiles of the χ2-distribution are displayed using colored plotting symbols: red (1, 5]%, purple (.1, 1]%, gold [0, .1]%. Similar plots for UHR show the same patterns.](/paper-figures/d99eb5ce90ee4a9ebac8c9f438b4c283/evaluation-of-statistical-methods-for-normalization-and-differential-expression-figure-8.jpg)
Verification
Claims the paper makes
The claims and statistics of this paper haven’t been checked yet.
Run the check — free, no account needed. It reads the open-access text and checks the sources it cites.
Claims other papers make about this one
Each is checked against this paper’s own text: does it say what the citing paper says it does?
The source backs part of the claim, not all of it — or backs it for a different population, condition or comparison.
In the citing paper
“These approaches rely on normalizing methods that are based on total or effective counts, and tend to perform poorly when samples have heterogeneous transcript distributions, that is, when highly and differentially expressed features can skew the count distribution [45, 46].”
From A survey of best practices for RNA-seq data analysis (2016) · cites this paper as [45]
Experimental — accuracy not yet measuredIn the citing paper
“While reproducibility in RNA-seq is usually high at the level of sequencing [1, 45], other steps such as RNA extraction and library preparation are noisier and may introduce biases in the data that can be minimized by adopting good experimental procedures (Box 2).”
From A survey of best practices for RNA-seq data analysis (2016) · cites this paper as [45]
Self-check
Percentages, sums and reported differences re-computed from the paper’s own numbers.
The self-check needs the paper’s full text.
Citations
Cites
Ultrafast and memory-efficient alignment of short DNA sequences to the human genome.
Langmead, B., Trapnell, C., Pop, M., & Salzberg, S. L. (2009) · Genome Biology · doi:10.1186/gb-2009-10-3-r25 · Cited by 21,849 · cited 1×
“We used Bowtie to map reads to the genome (GRCh37 assembly) [ 16 ].”
Method(2005) · Springer eBooks · doi:10.1007/0-387-27255-0_9 · Cited by 20,333
Mapping and quantifying mammalian transcriptomes by RNA-Seq
Mortazavi, A., Williams, B. A., McCue, K., Schaeffer, L., & Wold, B. (2008) · Nature Methods · doi:10.1038/nmeth.1226 · Cited by 13,696 · cited 6×
“These high-throughput sequencing technologies have already been applied to monitor genome-wide transcription levels (mRNA-Seq), DNA-protein interactions (ChIP-Seq), chromatin structure, and DNA methylation [1-9].”
BackgroundMethodInfluentialSmyth, G. K. (2004) · Statistical Applications in Genetics and Molecular Biology · doi:10.2202/1544-6115.1027 · Cited by 11,829
Exploration, normalization, and summaries of high density oligonucleotide array probe level data
Irizarry, R. A. (2003) · Biostatistics · doi:10.1093/biostatistics/4.2.249 · Cited by 10,603
Base-Calling of Automated Sequencer Traces Using Phred. I. Accuracy AssessmentPreprint
Ewing, B., Hillier, L., Wendl, M. C., & Green, P. (1998) · Genome Research · doi:10.1101/gr.8.3.175 · Cited by 6,993
Base-Calling of Automated Sequencer Traces Using Phred. II. Error Probabilities
Ewing, B., & Green, P. (1998) · Genome Research · doi:10.1101/gr.8.3.186 · Cited by 5,439 · cited 1×
“quality scores for the other seven lanes [[15], Supplementary Information, p. 7]. Bustard can also be run using the auto-calibration method, which scores basecalls in a manner similar to the phred base-caller [ 17 ] and does not require a control lane per flow-cell.”
MethodAlternative isoform regulation in human tissue transcriptomes
Wang, E. T., Sandberg, R., Luo, S., Khrebtukova, I., Zhang, L., Mayr, C., Kingsmore, S. F., Schroth, G. P., & Burge, C. B. (2008) · Nature · doi:10.1038/nature07509 · Cited by 5,181
Accurate whole human genome sequencing using reversible terminator chemistry
Bentley, D. R., Balasubramanian, S., Swerdlow, H. P., Smith, G. P., Milton, J., Brown, C. G., Hall, K. P., Evers, D. J., Barnes, C. L., Bignell, H. R., et al. (2008) · Nature · doi:10.1038/nature07517 · Cited by 3,684 · cited 1×
“quality scores for the other seven lanes [[15], Supplementary Information, p.”
BackgroundRNA-seq: An assessment of technical reproducibility and comparison with gene expression arrays
Marioni, J. C., Mason, C. E., Mane, S. M., Stephens, M., & Gilad, Y. (2008) · Genome Research · doi:10.1101/gr.079558.108 · Cited by 2,771 · cited 7×
“These high-throughput sequencing technologies have already been applied to monitor genome-wide transcription levels (mRNA-Seq), DNA-protein interactions (ChIP-Seq), chromatin structure, and DNA methylation [1-9].”
BackgroundMethodResultInfluential
Research works printed but not linked: 4
- Illumina:Sequencing Analysis Software User Guide For Pipeline Version 1.3 and CASAVA Version 1.0 T. Illumina, Inc.; 2008. [Part # 1005359 Rev. A] [ http://icom.illumina.com/icom/software.ilmn?id=277 ] [Part # 1005359 Rev. A]
- Illumina:Preparing Samples for Sequencing mRNA. Ilumina, Inc.; 2009. [Part # 1004898 Rev. A] [ http://icom.illumina.com/icom/software.ilmn?id=277 ] [Part # 1004898 Rev. A]
- Taub MA: Analysis of high-throughput biological data: some statistical problems in RNA-seq and mouse genotyping. PhD thesis. Department of Statistics, UC Berkeley; 2009.
- Irizarry RA, Hobbs B, Collin F, Beazer-Barclay YD, Antonellis KJ, Scherf U, Speed TP: Exploration, normalization, and summaries of high density oligonucleotide array probe level data. Biostatistics 2003, 4(1465–4644 (Print)):249–64. 10.1093/biostatistics/4.2.249 · DOI · Paper page
Cited by
Sorted by citations
RSEM: accurate transcript quantification from RNA-Seq data with or without a reference genome
Li, B., & Dewey, C. N. (2011) · BMC Bioinformatics · doi:10.1186/1471-2105-12-323 · Cited by 22,179
Differential expression analysis for sequence count data
Anders, S., & Huber, W. (2010) · Genome Biology · doi:10.1186/gb-2010-11-10-r106 · Cited by 15,581
Trapnell, C., Williams, B. A., Pertea, G., Mortazavi, A., Kwan, G., van Baren, M. J., Salzberg, S. L., Wold, B. J., & Pachter, L. (2010) · Nature Biotechnology · doi:10.1038/nbt.1621 · Cited by 15,556
Haas, B. J., Papanicolaou, A., Yassour, M., Grabherr, M., Blood, P. D., Bowden, J., Couger, M. B., Eccles, D., Li, B., Lieber, M., et al. (2013) · Nature Protocols · doi:10.1038/nprot.2013.084 · Cited by 8,464
McCarthy, D. J., Chen, Y., & Smyth, G. K. (2012) · Nucleic Acids Research · doi:10.1093/nar/gks042 · Cited by 5,195
Waste Not, Want Not: Why Rarefying Microbiome Data Is Inadmissible
McMurdie, P. J., & Holmes, S. (2014) · PLoS Computational Biology · doi:10.1371/journal.pcbi.1003531 · Cited by 3,034
A survey of best practices for RNA-seq data analysis
Conesa, A., Madrigal, P., Tarazona, S., Gomez-Cabrero, D., Cervera, A., McPherson, A., Szcześniak, M. W., Gaffney, D. J., Elo, L. L., Zhang, X., et al. (2016) · Genome Biology · doi:10.1186/s13059-016-0881-8 · Cited by 2,794
“Normalization methods that take this into account are TMM [47], DESeq [48], PoissonSeq [49] and UpperQuartile [45], which ignore highly variable and/or highly expressed features.”
MethodEarly allopolyploid evolution in the post-Neolithic Brassica napus oilseed genome
Chalhoub, B., Denœud, F., Liu, S., Parkin, I. A. P., Tang, H., Wang, X., Chiquet, J., Belcram, H., Tong, C., Samans, B., et al. (2014) · Science · doi:10.1126/science.1253435 · Cited by 2,514
Differential abundance analysis for microbial marker-gene surveys
Paulson, J. N., Stine, O. C., Bravo, H. C., & Pop, M. (2013) · Nature Methods · doi:10.1038/nmeth.2658 · Cited by 2,471
Normalization of RNA-seq data using factor analysis of control genes or samples
Risso, D., Ngai, J., Speed, T. P., & Dudoit, S. (2014) · Nature Biotechnology · doi:10.1038/nbt.2931 · Cited by 2,052
Self-citationNormalization and microbial differential abundance strategies depend upon data characteristics
Weiss, S. J., Xu, Z. Z., Peddada, S. D., Amir, A., Bittinger, K. L., González, A., Lozupone, C., Zaneveld, J., Vázquez‐Baeza, Y., Birmingham, A., et al. (2017) · Microbiome · doi:10.1186/s40168-017-0237-y · Cited by 2,231
“(none, proportion, rarefying without replacement as in the hypergeometric model [75], CSS [4], logUQ [28], DESeqVS [30], and edgeR-TMM [27]) and the beta”
BackgroundMethodInfluentialReimand, J., Isserlin, R., Voisin, V., Kucera, M., Tannus-Lopes, C., Rostamianfar, A., Wadi, L., Meyer, M., Wong, J., Xu, C., et al. (2019) · Nature Protocols · doi:10.1038/s41596-018-0103-9 · Cited by 1,970
RNA sequencing: the teenage years
Stark, R., Grzelak, M., & Hadfield, J. (2019) · Nature Reviews Genetics · doi:10.1038/s41576-019-0150-2 · Cited by 2,041
Improving RNA-Seq expression estimates by correcting for fragment bias
Roberts, A., Trapnell, C., Donaghey, J., Rinn, J. L., & Pachter, L. (2011) · Genome Biology · doi:10.1186/gb-2011-12-3-r22 · Cited by 1,725
McCarthy, D. J., Campbell, K. R., Lun, A. T. L., & Wills, Q. F. (2017) · Bioinformatics · doi:10.1093/bioinformatics/btw777 · Cited by 1,852
De novo assembly of bacterial transcriptomes from RNA-seq data
Tjaden, B. C. (2015) · Genome biology · doi:10.1186/s13059-014-0572-2 · Cited by 1,700
Chong, J., Liu, P., Zhou, G., & Xia, J. (2020) · Nature Protocols · doi:10.1038/s41596-019-0264-1 · Cited by 1,708
Full-length mRNA-Seq from single-cell levels of RNA and individual circulating tumor cells
Ramsköld, D., Luo, S., Wang, Y.-C., Li, R., Deng, Q., Faridani, O. R., Daniels, G. A., Khrebtukova, I., Loring, J. F., Laurent, L. C., et al. (2012) · Nature Biotechnology · doi:10.1038/nbt.2282 · Cited by 1,609
Differential expression in RNA-seq: A matter of depth
Tarazona, S., García-Alcalde, F., Dopazo, J., Ferrer, A., & Conesa, A. (2011) · Genome Research · doi:10.1101/gr.124321.111 · Cited by 1,632
Sequencing depth and coverage: key considerations in genomic analyses
Sims, D., Sudbery, I. M., Ilott, N. E., Heger, A., & Ponting, C. P. (2014) · Nature Reviews Genetics · doi:10.1038/nrg3642 · Cited by 1,488
Varet, H., Brillet-Guéguen, L., Coppée, J., & Dillies, M. (2016) · PLoS ONE · doi:10.1371/journal.pone.0157022 · Cited by 1,375
“Normalization is another key issue when looking for differentially expressed (DE) genes [10].”
BackgroundEBSeq: an empirical Bayes hierarchical model for inference in RNA-seq experiments
Leng, N., Dawson, J. A., Thomson, J. A., Ruotti, V., Rissman, A. I., Smits, B. M. G., Haag, J. D., Gould, M. N., Stewart, R. M., & Kendziorski, C. M. (2013) · Bioinformatics · doi:10.1093/bioinformatics/btt087 · Cited by 1,310
Dillies, M., Rau, A., Aubert, J., Hennequet‐Antier, C., Jeanmougin, M., Servant, N., Keime, C., Marot, G., Castel, D., Estellé, J., et al. (2012) · Briefings in Bioinformatics · doi:10.1093/bib/bbs046 · Cited by 1,363
Ingolia, N. T., Brar, G. A., Rouskin, S., McGeachy, A. M., & Weissman, J. S. (2012) · Nature Protocols · doi:10.1038/nprot.2012.086 · Cited by 1,280
Count-based differential expression analysis of RNA sequencing data using R and Bioconductor
Anders, S., McCarthy, D. J., Chen, Y., Okoniewski, M. J., Smyth, G. K., Huber, W. K., & Robinson, M. D. (2013) · Nature Protocols · doi:10.1038/nprot.2013.099 · Cited by 1,170
Computational methods for transcriptome annotation and quantification using RNA-seq
Garber, M., Grabherr, M. G., Guttman, M., & Trapnell, C. (2011) · Nature Methods · doi:10.1038/nmeth.1613 · Cited by 1,042
Guidelines for the use of flow cytometry and cell sorting in immunological studies (second edition)
Cossarizza, A., Chang, H., Radbruch, A., Acs, A., Adam, D., Adam‐Klages, S., Agace, W. W., Aghaeepour, N., Akdiş, M., Allez, M., et al. (2019) · European Journal of Immunology · doi:10.1002/eji.201970107 · Cited by 1,007
Commensal Microbiota Promote Lung Cancer Development via γδ T Cells
Jin, C., Lagoudas, G. K., Zhao, C., Bullman, S., Bhutkar, A., Hu, B., Ameh, S., Sandel, D., Liang, X. S., Mazzilli, S., et al. (2019) · Cell · doi:10.1016/j.cell.2018.12.040 · Cited by 964
Schurch, N. J., Schofield, P., Gierliński, M., Cole, C., Sherstnev, A., Singh, V., Wrobel, N., Gharbi, K., Simpson, G. G., Owen-Hughes, T., et al. (2016) · RNA · doi:10.1261/rna.053959.115 · Cited by 966
“The majority of studies based on analysis of experimental RNA-seq data rely on data from experiments with fewer than five replicates per condition (Marioni et al. 2008; Bullard et al. 2010; Kvam et al. 2012; Li et al. 2012; Busby et al. 2013; Dillies et al. 2013; Rapaport et al. 2013; SEQC/MAQC-III Consortium 2014; So…”
MethodInfluentialMonaco, G., Lee, B., Xu, W., Mustafah, S., Hwang, Y. Y., Carré, C., Burdin, N., Visan, L., Ceccarelli, M., Poidinger, M., et al. (2019) · Cell Reports · doi:10.1016/j.celrep.2019.01.041 · Cited by 958
Kukurba, K. R., & Montgomery, S. B. (2015) · Cold Spring Harbor Protocols · doi:10.1101/pdb.top084970 · Cited by 924
A comparison of methods for differential expression analysis of RNA-seq data
Soneson, C., & Delorenzi, M. (2013) · BMC Bioinformatics · doi:10.1186/1471-2105-14-91 · Cited by 887
GC-Content Normalization for RNA-Seq Data
Risso, D., Schwartz, K., Sherlock, G., & Dudoit, S. (2011) · BMC Bioinformatics · doi:10.1186/1471-2105-12-480 · Cited by 867
Self-citationTrajectory-based differential expression analysis for single-cell sequencing data
den Berge, K. V., de Bézieux, H. R., Street, K., Saelens, W., Cannoodt, R., Saeys, Y., Dudoit, S., & Clement, L. (2020) · Nature Communications · doi:10.1038/s41467-020-14766-3 · Cited by 851
Self-citationComprehensive evaluation of differential gene expression analysis methods for RNA-seq data
Rapaport, F., Khanin, R., Liang, Y., Pirun, M., Krek, A., Zumbo, P., Mason, C. E., Socci, N. D., & Betel, D. (2013) · Genome Biology · doi:10.1186/gb-2013-14-9-r95 · Cited by 733
RobiNA: a user-friendly, integrated software solution for RNA-Seq-based transcriptomics
Lohse, M., Bolger, A., Nagel, A., Fernie, A. R., Lunn, J. E., Stitt, M., & Usadel, B. (2012) · Nucleic Acids Research · doi:10.1093/nar/gks540 · Cited by 790
Data quality aware analysis of differential expression in RNA-seq with NOISeq R/Bioc package
Tarazona, S., Furió‐Tarí, P., Turrà, D., Pietro, A. D., Nueda, M. J., Ferrer, A., & Conesa, A. (2015) · Nucleic Acids Research · doi:10.1093/nar/gkv711 · Cited by 787
“The NOISeq package includes three commonly used normalization methods: RPKM (4), Upper Quartile (15) and TMM (14).”
MethodbaySeq: Empirical Bayesian methods for identifying differential expression in sequence count data
Hardcastle, T. J., & Kelly, K. A. (2010) · BMC Bioinformatics · doi:10.1186/1471-2105-11-422 · Cited by 755
Revealing the vectors of cellular identity with single-cell genomics
Wagner, A., Regev, A., & Yosef, N. (2016) · Nature Biotechnology · doi:10.1038/nbt.3711 · Cited by 632
A general and flexible method for signal extraction from single-cell RNA-seq data
Risso, D., Perraudeau, F., Gribkova, S., Dudoit, S., & Vert, J.-P. (2018) · Nature Communications · doi:10.1038/s41467-017-02554-5 · Cited by 718
“• Full-quantile normalization (FQ) [54].”
Self-citationBiases in Illumina transcriptome sequencing caused by random hexamer priming
Hansen, K. D., Brenner, S. E., & Dudoit, S. (2010) · Nucleic Acids Research · doi:10.1093/nar/gkq224 · Cited by 713
Self-citationFrom RNA-seq reads to differential expression results
Oshlack, A., Robinson, M. D., & Young, M. D. (2010) · Genome biology · doi:10.1186/gb-2010-11-12-220 · Cited by 733
Quantitative assessment of single-cell RNA-sequencing methods
Wu, A. R., Neff, N. F., Kalisky, T., Dalerba, P., Treutlein, B., Rothenberg, M. E., Mburu, F. M., Mantalas, G. L., Sim, S., Clarke, M. F., et al. (2014) · Nature Methods · doi:10.1038/nmeth.2694 · Cited by 696
Removing technical variability in RNA-seq data using conditional quantile normalization
Hansen, K. D., Irizarry, R. A., & WU, Z. (2012) · Biostatistics · doi:10.1093/biostatistics/kxr054 · Cited by 607
Self-citationPatro, R., Mount, S. M., & Kingsford, C. (2014) · Nature Biotechnology · doi:10.1038/nbt.2862 · Cited by 586
A quantitative atlas of polyadenylation in five mammalsPreprint
Derti, A., Garrett-Engele, P. W., MacIsaac, K. D., Stevens, R. C., Sriram, S., Chen, R., Rohl, C. A., Johnson, J. M., & Babak, T. (2012) · Genome Research · doi:10.1101/gr.132563.111 · Cited by 663
Synthetic spike-in standards for RNA-seq experiments
Jiang, L., Schlesinger, F., Davis, C. A., Zhang, Y., Li, R., Salit, M., Gingeras, T. R., & Oliver, B. (2011) · Genome Research · doi:10.1101/gr.121095.111 · Cited by 653
Keap1 loss promotes Kras-driven lung cancer and results in dependence on glutaminolysis
Romero, R., Sayin, V. I., Davidson, S. M., Bauer, M. R., Singh, S. X., LeBoeuf, S. E., Karakousi, T. R., Ellis, D. C., Bhutkar, A., Sánchez-Rivera, F. J., et al. (2017) · Nature Medicine · doi:10.1038/nm.4407 · Cited by 652
TCC: an R package for comparing tag count data with robust normalization strategies
Sun, J., Nishiyama, T., Shimizu, K., & Kadota, K. (2013) · BMC Bioinformatics · doi:10.1186/1471-2105-14-219 · Cited by 613
RNA-Seq differential expression analysis: An extended review and a software tool
Silva, J. C., Domingues, D. S., & Lopes, F. M. (2017) · PLoS ONE · doi:10.1371/journal.pone.0190152 · Cited by 676
Computational analysis of bacterial RNA-Seq data
McClure, R., Balasubramanian, D., Sun, Y., Bobrovskyy, M., Sumby, P., Genco, C. A., Vanderpool, C. K., & Tjaden, B. C. (2013) · Nucleic Acids Research · doi:10.1093/nar/gkt444 · Cited by 584
Widespread macromolecular interaction perturbations in human genetic disorders
Sahni, N., Yi, S., Taipale, M., Fuxman Bass, J. I., Coulombe-Huntington, J., Yang, F., Peng, J., Weile, J., Karras, G. I., Wang, Y., et al. (2015) · Cell · doi:10.1016/j.cell.2015.04.013 · Cited by 594
Metabolic landscape of the tumor microenvironment at single cell resolution
Xiao, Z., Dai, Z., & Locasale, J. W. (2019) · Nature Communications · doi:10.1038/s41467-019-11738-0 · Cited by 524
Xia, Z., Donehower, L. A., Cooper, T. A., Neilson, J. R., Wheeler, D. A., Wagner, E. J., & Li, W. (2014) · Nature Communications · doi:10.1038/ncomms6274 · Cited by 581
TT-seq maps the human transient transcriptome
Schwalb, B., Michel, M., Zacher, B., Frühauf, K., Demel, C., Tresch, A., Gagneur, J., & Cramer, P. (2016) · Science · doi:10.1126/science.aad9841 · Cited by 570
The genomic landscape underlying phenotypic integrity in the face of gene flow in crows
Poelstra, J. W., Vijay, N., Bossu, C. M., Lantz, H., Ryll, B., Müller, I., Baglione, V., Unneberg, P., Wikelski, M. C., Grabherr, M. G., et al. (2014) · Science · doi:10.1126/science.1253226 · Cited by 551
svaseq: removing batch effects and other unwanted noise from sequencing data
Leek, J. T. (2014) · Nucleic Acids Research · doi:10.1093/nar/gku864 · Cited by 551
Microarrays, deep sequencing and the true measure of the transcriptome
Malone, J. H., & Oliver, B. (2011) · BMC Biology · doi:10.1186/1741-7007-9-34 · Cited by 571
Normalizing single-cell RNA sequencing data: challenges and opportunities
Vallejos, C. A., Risso, D., Scialdone, A., Dudoit, S., & Marioni, J. C. (2017) · Nature Methods · doi:10.1038/nmeth.4292 · Cited by 436
“However, these estimates can be dominated by a handful of highly expressed genes, which can bias downstream results [16, 22].”
BackgroundMethodInfluentialSelf-citationBenchmarking of cell type deconvolution pipelines for transcriptomics data
Avila Cobos, F., Alquicira-Hernandez, J., Powell, J. E., Mestdagh, P., & De Preter, K. (2020) · Nature Communications · doi:10.1038/s41467-020-19015-1 · Cited by 446
Miller, R., Wu, G., Deshpande, R. R., Vieler, A., Gärtner, K., Li, X., Moellering, E. R., Zäuner, S., Cornish, A. J., Liu, B., et al. (2010) · PLANT PHYSIOLOGY · doi:10.1104/pp.110.165159 · Cited by 511
Zhao, Y., Li, M., Konaté, M. M., Chen, L., Das, B., Karlovich, C., Williams, P. M., Evrard, Y. A., Doroshow, J. H., & McShane, L. M. (2021) · Journal of Translational Medicine · doi:10.1186/s12967-021-02936-w · Cited by 517
Hollern, D. P., Xu, N., Thennavan, A., Glodowski, C. R., García‐Recio, S., Mott, K. R., He, X., Garay, J. P., Carey-Ewend, K., Marron, D. L., et al. (2019) · Cell · doi:10.1016/j.cell.2019.10.028 · Cited by 480
Comparison of software packages for detecting differential expression in RNA-seq studies
Seyednasrollah, F., Laiho, A., & Elo, L. L. (2015) · Briefings in Bioinformatics · doi:10.1093/bib/bbt086 · Cited by 421
Klambauer, G., Schwarzbauer, K., Mayr, A., Clevert, D.-A., Mitterecker, A., Bodenhofer, U., & Hochreiter, S. (2012) · Nucleic Acids Research · doi:10.1093/nar/gks003 · Cited by 454
Linear models enable powerful differential activity analysis in massively parallel reporter assays
Myint, L., Avramopoulos, D., Goff, L., & Hansen, K. (2017) · BMC Genomics · doi:10.1186/s12864-019-5556-x · Cited by 140
“On the log scale, low counts are more variable across replicates than high counts, at least partly due to inherent Poisson variation in the sequencing process [27, 28].”
BackgroundSelf-citationDesign and computational analysis of single-cell RNA-sequencing experiments
Bacher, R. L., & Kendziorski, C. M. (2016) · Genome biology · doi:10.1186/s13059-016-0927-y · Cited by 460
“Given the importance of normalization, it is not surprising that many normalization methods are available for bulk RNA-seq experiments [40 – 46], and these methods have been used in the majority of reported scRNA-seq experiments to date.”
MethodLi, J., & Tibshirani, R. J. (2011) · Statistical Methods in Medical Research · doi:10.1177/0962280211428386 · Cited by 447
GFOLD: a generalized fold change for ranking differentially expressed genes from RNA-seq data
Feng, J., Meyer, C. A., Wang, Q., Liu, J. S., Liu, X. S., & Zhang, Y. (2012) · Bioinformatics · doi:10.1093/bioinformatics/bts515 · Cited by 433
Ribosome Footprint Profiling of Translation throughout the Genome
Ingolia, N. T. (2016) · Cell · doi:10.1016/j.cell.2016.02.066 · Cited by 424
“Statistical frameworks for read count analysis typically account for this library size factor but rely on the assumption that most genes show similar expression between different samples (Bullard et al., 2010).”
BackgroundNormalization, testing, and false discovery rate estimation for RNA-sequencing data
Li, J., Witten, D. M., Johnstone, I. M., & Tibshirani, R. (2012) · Biostatistics · doi:10.1093/biostatistics/kxr031 · Cited by 369
Analysis of microbial compositions: a review of normalization and differential abundance analysis
Lin, H., & Peddada, S. D. (2020) · npj Biofilms and Microbiomes · doi:10.1038/s41522-020-00160-w · Cited by 341
George, J., Walter, V., Peifer, M., Alexandrov, L. B., Seidel, D., Leenders, F., Maas, L., Müller, C., Dahmen, I., Delhomme, T. M., et al. (2018) · Nature Communications · doi:10.1038/s41467-018-03099-x · Cited by 381
Selecting between-sample RNA-Seq normalization methods from the perspective of their assumptions
Evans, C., Hardin, J., & Stoebel, D. M. (2017) · Briefings in Bioinformatics · doi:10.1093/bib/bbx008 · Cited by 368
“Normalization for qRT-PCR often relies on housekeeping genes [10, 37, 38].”
BackgroundMethodInfluentialMethods for normalizing microbiome data: An ecological perspective
McKnight, D. T., Huerlimann, R., Bower, D. S., Schwarzkopf, L., Alford, R. A., & Zenger, K. R. (2018) · Methods in Ecology and Evolution · doi:10.1111/2041-210x.13115 · Cited by 373
Transcriptomics in the RNA-seq era
McGettigan, P. (2013) · Current Opinion in Chemical Biology · doi:10.1016/j.cbpa.2012.12.008 · Cited by 383
A Comparative Study of Techniques for Differential Expression Analysis on RNA-Seq Data
Zhang, Z. H., Jhaveri, D. J., Marshall, V. M., Bauer, D. C., Edson, J., Narayanan, R. K., Robinson, G. J., Lundberg, A. E., Bartlett, P. F., Wray, N. R., et al. (2014) · PLoS ONE · doi:10.1371/journal.pone.0103207 · Cited by 373
Hugerth, L. W., & Andersson, A. F. (2017) · Frontiers in Microbiology · doi:10.3389/fmicb.2017.01561 · Cited by 385
“A similar approach is using not the total count of reads for normalization, but a fixed percentile of them (Bullard et al., 2010), which should be less sensitive to events such as blooms.”
MethodInfluentialNext maSigPro: updating maSigPro bioconductor package for RNA-seq time series
Nueda, M. J., Tarazona, S., & Conesa, A. (2014) · Bioinformatics · doi:10.1093/bioinformatics/btu333 · Cited by 348
Comparative analysis of RNA-Seq alignment algorithms and the RNA-Seq unified mapper (RUM)
Grant, G. R., Farkas, M. H., Pizarro, A., Lahens, N. F., Schug, J., Brunk, B. P., Stoeckert, C. J., Hogenesch, J. B., & Pierce, E. A. (2011) · Bioinformatics · doi:10.1093/bioinformatics/btr427 · Cited by 353
Li, Y., Ge, X., Peng, F., Li, W., & Li, J. J. (2022) · Genome Biology · doi:10.1186/s13059-022-02648-4 · Cited by 303
Nookaew, I., Papini, M., Pornputtapong, N., Scalcinati, G., Fagerberg, L., Uhlén, M., & Nielsen, J. (2012) · Nucleic Acids Research · doi:10.1093/nar/gks804 · Cited by 309
Lund, S. P., Nettleton, D. S., McCarthy, D. J., & Smyth, G. K. (2012) · Statistical Applications in Genetics and Molecular Biology · doi:10.1515/1544-6115.1826 · Cited by 322
Pérez-Cobas, A. E., Gomez-Valero, L., & Buchrieser, C. (2020) · Microbial Genomics · doi:10.1099/mgen.0.000409 · Cited by 314
“A simple scaling method, the log upper quartile (logUQ), basically scales each sample by the 75th percentile of the distribution of counts before log transformation [215].”
MethodPolyester : simulating RNA-seq datasets with differential transcript expression
Frazee, A. C., Jaffe, A. E., Langmead, B., & Leek, J. T. (2015) · Bioinformatics · doi:10.1093/bioinformatics/btv272 · Cited by 313
Cloud-scale RNA-sequencing differential expression analysis with Myrna
Langmead, B., Hansen, K. D., & Leek, J. T. (2010) · Genome biology · doi:10.1186/gb-2010-11-8-r83 · Cited by 320
Self-citationInnate-like functions of natural killer T cell subsets result from highly divergent gene programs
Engel, I., Seumois, G., Chávez, L., Samaniego‐Castruita, D., White, B. M., Chawla, A., Mock, D. C., Vijayanand, P., & Kronenberg, M. (2016) · Nature Immunology · doi:10.1038/ni.3437 · Cited by 304
TCGA Workflow: Analyze cancer genomics and epigenomics data using Bioconductor packages
Silva, T. C., Colaprico, A., Olsen, C., D’Angelo, F., Bontempi, G., Ceccarelli, M., & Noushmehr, H. (2016) · F1000Research · doi:10.12688/f1000research.8923.1 · Cited by 303
RNA-seq: technical variability and sampling
McIntyre, L. M., Lopiano, K. K., Morse, A. M., Amin, V., Oberg, A. L., Young, L. J., & Nuzhdin, S. V. (2011) · BMC Genomics · doi:10.1186/1471-2164-12-293 · Cited by 285
Evolutionary changes in promoter and enhancer activity during human corticogenesis
Reilly, S. K., Yin, J., Ayoub, A. E., Emera, D., Leng, J., Cotney, J., Sarro, R., Rakic, P., & Noonan, J. P. (2015) · Science · doi:10.1126/science.1260943 · Cited by 297
Power analysis and sample size estimation for RNA-Seq differential expression
Ching, T., Huang, S., & Garmire, L. X. (2014) · RNA · doi:10.1261/rna.046011.114 · Cited by 263
Twine, N. A., Janitz, K., Wilkins, M. R., & Janitz, M. (2011) · PLoS ONE · doi:10.1371/journal.pone.0016266 · Cited by 309
Resolving host–pathogen interactions by dual RNA-seq
Westermann, A. J., Barquist, L., & Vogel, J. (2017) · PLoS Pathogens · doi:10.1371/journal.ppat.1006033 · Cited by 301
“The most commonly used (and best performing [47]) RNA-seq normalization techniques address this problem by attempting to scale read counts by a factor derived from a set of putatively invariant genes identified through excluding genes with extreme differences in expression [48], the use of robust median statistics [49…”
MethodRNA sequencing reveals two major classes of gene expression levels in metazoan cells
Hebenstreit, D., Fang, M., Gu, M., Charoensawan, V., van Oudenaarden, A., & Teichmann, S. A. (2011) · Molecular Systems Biology · doi:10.1038/msb.2011.28 · Cited by 289
Da Silva, H. E., Teterina, A., Comelli, E. M., Taibi, A., Arendt, B. M., Fischer, S. E., Lou, W., & Allard, J. P. (2018) · Scientific Reports · doi:10.1038/s41598-018-19753-9 · Cited by 283
A comparison of statistical methods for detecting differentially expressed genes from RNA‐seq data
Kvam, V. M., Liu, P., & Si, Y. (2012) · American Journal of Botany · doi:10.3732/ajb.1100340 · Cited by 281
Advanced Applications of RNA Sequencing and Challenges
Han, Y., Gao, S., Muegge, K., Zhang, W., & Zhou, B. (2015) · Bioinformatics and Biology Insights · doi:10.4137/bbi.s28991 · Cited by 303
Zeng, A., Li, H., Guo, L., Gao, X., McKinney, S., Wang, Y., Yu, Z., Park, J., Semerad, C. L., Ross, E. J., et al. (2018) · Cell · doi:10.1016/j.cell.2018.05.006 · Cited by 280
Dietary Fat, but Not Protein or Carbohydrate, Regulates Energy Intake and Causes Adiposity in Mice
Hu, S., Wang, L., Yang, D., Li, L., Togo, J., Wu, Y., Liu, Q., Li, B., Li, M., Wang, G., et al. (2018) · Cell Metabolism · doi:10.1016/j.cmet.2018.06.010 · Cited by 289
RD26 mediates crosstalk between drought and brassinosteroid signalling pathways
Ye, H., Liu, S., Tang, B., Chen, J., Xie, Z., Nolan, T. M., Jiang, H., Guo, H., Lin, H.-Y., Li, L., et al. (2017) · Nature Communications · doi:10.1038/ncomms14573 · Cited by 272
“The 0.75 quantile of reads from each sample was used as the normalization factor 65 .”
MethodInfluential
Metadata
- Authors
- Bullard, J. H., Purdom, E., Hansen, K. D., & Dudoit, S.
- Affiliations
- University of California, Berkeley (US)
- Corresponding author
- Bullard, James H
- Venue
- BMC Bioinformatics
- Published
- 2010-02-18
- Volume
- 11
- Issue
- 1
- Pages
- 94-94
- ISSN
- 1471-2105 (ISSN-L)
- PMC
- PMC2838869
- OpenAlex
- W2156631105
- Cited by
- 1,680
- References
- 23
- Citations by year
- 2026: 29 · 2025: 51 · 2024: 69 · 2023: 68 · 2022: 92 · 2021: 132 · 2020: 127 · 2019: 123 · 2018: 123 · 2017: 133 · 2016: 121 · 2015: 129 · 2014: 161 · 2013: 128 · 2012: 98
- FWCI
- 41.79
- Type
- journal article
- Language
- en
- Open access
- gold
- doi.org
- Licence
- Locations
- BMC Bioinformatics (publishedVersion, cc-by)
- PubMed Central (publishedVersion, cc-by)
- PubMed (publishedVersion)
- Collection of Biostatistics Research Archive (submittedVersion)
- DOAJ (DOAJ: Directory of Open Access Journals) (submittedVersion, cc-by-sa)
- eScholarship (California Digital Library) (submittedVersion)
- Funders
- National Science Foundation
- National Institutes of Health
- National Human Genome Research Institute (U01HG004271)
- Topics
- Life Sciences › Biochemistry, Genetics and Molecular Biology › Molecular Biology › Gene expression and cancer classification
- Life Sciences › Biochemistry, Genetics and Molecular Biology › Molecular Biology › Genomics and Phylogenetic Studies
- Life Sciences › Biochemistry, Genetics and Molecular Biology › Molecular Biology › Single-cell and spatial transcriptomics
- Keywords
- mRNA-seq, read count normalization, differential gene expression, method comparison
- MeSH terms
- RNA, Messenger, Sequence Analysis, RNA, Computational Biology, Databases, Genetic
About these checks
Registry, retraction, Cites and statistics results are computed, not judged, with one exception: a printed reference that no index lists is read once by a model before it counts as a citation error. Claims are extracted by a model and kept only when their quote appears verbatim in the text; each cited source is then checked, with a model’s help, for whether it says what the claim relies on. Those verdicts can be wrong — read the claim’s quote and the cited source before relying on one.
Statistics and arithmetic are recomputed, not judged.
Confidence bands are shown only for fields calibrated on our annotated test set. None is calibrated yet, so no band is shown.
What counts as a claim ›How we measure confidence ›How we check this ›
Are you an author, or do you see a problem with this page? Request a review
