

The DOI matches its Crossref record; 22 of the 23 references it cites were found in a registry or an index.
Evaluation of statistical methods for normalization and differential expression in mRNA-Seq experiments
Open accessAbstract
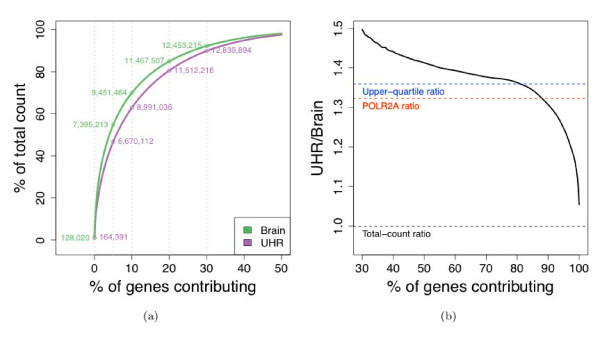
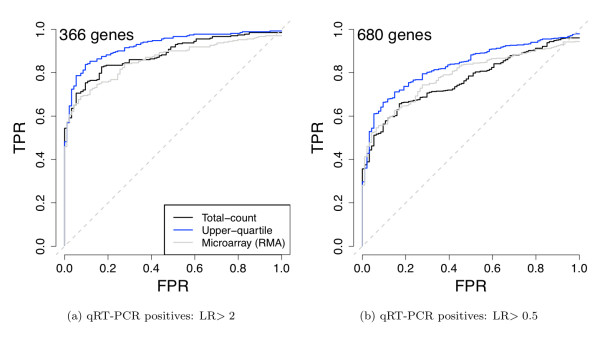
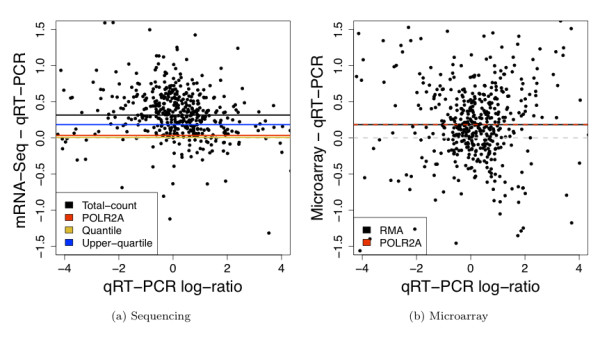
BACKGROUND: High-throughput sequencing technologies, such as the Illumina Genome Analyzer, are powerful new tools for investigating a wide range of biological and medical questions. Statistical and computational methods are key for drawing meaningful and accurate conclusions from the massive and complex datasets generated by the sequencers. We provide a detailed evaluation of statistical methods for normalization and differential expression (DE) analysis of Illumina transcriptome sequencing (mRNA-Seq) data. RESULTS: We compare statistical methods for detecting genes that are significantly DE between two types of biological samples and find that there are substantial differences in how the test statistics handle low-count genes. We evaluate how DE results are affected by features of the sequencing platform, such as, varying gene lengths, base-calling calibration method (with and without phi X control lane), and flow-cell/library preparation effects. We investigate the impact of the read count normalization method on DE results and show that the standard approach of scaling by total lane counts (e.g., RPKM) can bias estimates of DE. We propose more general quantile-based normalization procedures and demonstrate an improvement in DE detection. CONCLUSIONS: Our results have significant practical and methodological implications for the design and analysis of mRNA-Seq experiments. They highlight the importance of appropriate statistical methods for normalization and DE inference, to account for features of the sequencing platform that could impact the accuracy of results. They also reveal the need for further research in the development of statistical and computational methods for mRNA-Seq.
Overview
The claims and statistics of this paper haven’t been checked yet.
Run the check — free, no account needed. It reads the open-access text and checks the sources it cites.
Integrity signals
Registry
Cites
Statistics
Figures
![Figure 8 Comparison of normalization procedures: Goodness-of-fit of Poisson model. The multiplicative Poisson model (GLM 1 in [Additional file 2: Supplemental Table S4]) is fit to the seven Brain lanes in the MAQC-2 experiment after (a) total-count, (b) POLR2A, (c) upper-quartile, and (d) quantile normalization. Goodness-of-fit statistics are computed and displayed in χ2 quantile-quantile plots. Genes with goodness-of-fit statistics in the top quantiles of the χ2-distribution are displayed using colored plotting symbols: red (1, 5]%, purple (.1, 1]%, gold [0, .1]%. Similar plots for UHR show the same patterns.](/paper-figures/d99eb5ce90ee4a9ebac8c9f438b4c283/evaluation-of-statistical-methods-for-normalization-and-differential-expression-figure-8.jpg)
Verification
Claims the paper makes
The claims and statistics of this paper haven’t been checked yet.
Run the check — free, no account needed. It reads the open-access text and checks the sources it cites.
Claims other papers make about this one
Each is checked against this paper’s own text: does it say what the citing paper says it does?
The source backs part of the claim, not all of it — or backs it for a different population, condition or comparison.
In the citing paper
“These approaches rely on normalizing methods that are based on total or effective counts, and tend to perform poorly when samples have heterogeneous transcript distributions, that is, when highly and differentially expressed features can skew the count distribution [45, 46].”
From A survey of best practices for RNA-seq data analysis (2016) · cites this paper as [45]
Experimental — accuracy not yet measuredIn the citing paper
“While reproducibility in RNA-seq is usually high at the level of sequencing [1, 45], other steps such as RNA extraction and library preparation are noisier and may introduce biases in the data that can be minimized by adopting good experimental procedures (Box 2).”
From A survey of best practices for RNA-seq data analysis (2016) · cites this paper as [45]
Self-check
Percentages, sums and reported differences re-computed from the paper’s own numbers.
The self-check needs the paper’s full text.
Citations
Cites
Ultrafast and memory-efficient alignment of short DNA sequences to the human genome.
Langmead, B., Trapnell, C., Pop, M., & Salzberg, S. L. (2009) · Genome Biology · doi:10.1186/gb-2009-10-3-r25 · Cited by 21,849 · cited 1×
“We used Bowtie to map reads to the genome (GRCh37 assembly) [ 16 ].”
Method(2005) · Springer eBooks · doi:10.1007/0-387-27255-0_9 · Cited by 20,333
Mapping and quantifying mammalian transcriptomes by RNA-Seq
Mortazavi, A., Williams, B. A., McCue, K., Schaeffer, L., & Wold, B. (2008) · Nature Methods · doi:10.1038/nmeth.1226 · Cited by 13,696 · cited 6×
“These high-throughput sequencing technologies have already been applied to monitor genome-wide transcription levels (mRNA-Seq), DNA-protein interactions (ChIP-Seq), chromatin structure, and DNA methylation [1-9].”
BackgroundMethodInfluentialSmyth, G. K. (2004) · Statistical Applications in Genetics and Molecular Biology · doi:10.2202/1544-6115.1027 · Cited by 11,829
Exploration, normalization, and summaries of high density oligonucleotide array probe level data
Irizarry, R. A. (2003) · Biostatistics · doi:10.1093/biostatistics/4.2.249 · Cited by 10,603
Base-Calling of Automated Sequencer Traces Using Phred. I. Accuracy AssessmentPreprint
Ewing, B., Hillier, L., Wendl, M. C., & Green, P. (1998) · Genome Research · doi:10.1101/gr.8.3.175 · Cited by 6,993
Base-Calling of Automated Sequencer Traces Using Phred. II. Error Probabilities
Ewing, B., & Green, P. (1998) · Genome Research · doi:10.1101/gr.8.3.186 · Cited by 5,439 · cited 1×
“quality scores for the other seven lanes [[15], Supplementary Information, p. 7]. Bustard can also be run using the auto-calibration method, which scores basecalls in a manner similar to the phred base-caller [ 17 ] and does not require a control lane per flow-cell.”
MethodAlternative isoform regulation in human tissue transcriptomes
Wang, E. T., Sandberg, R., Luo, S., Khrebtukova, I., Zhang, L., Mayr, C., Kingsmore, S. F., Schroth, G. P., & Burge, C. B. (2008) · Nature · doi:10.1038/nature07509 · Cited by 5,181
Accurate whole human genome sequencing using reversible terminator chemistry
Bentley, D. R., Balasubramanian, S., Swerdlow, H. P., Smith, G. P., Milton, J., Brown, C. G., Hall, K. P., Evers, D. J., Barnes, C. L., Bignell, H. R., et al. (2008) · Nature · doi:10.1038/nature07517 · Cited by 3,684 · cited 1×
“quality scores for the other seven lanes [[15], Supplementary Information, p.”
BackgroundRNA-seq: An assessment of technical reproducibility and comparison with gene expression arrays
Marioni, J. C., Mason, C. E., Mane, S. M., Stephens, M., & Gilad, Y. (2008) · Genome Research · doi:10.1101/gr.079558.108 · Cited by 2,771 · cited 7×
“These high-throughput sequencing technologies have already been applied to monitor genome-wide transcription levels (mRNA-Seq), DNA-protein interactions (ChIP-Seq), chromatin structure, and DNA methylation [1-9].”
BackgroundMethodResultInfluential
Research works printed but not linked: 4
- Illumina:Sequencing Analysis Software User Guide For Pipeline Version 1.3 and CASAVA Version 1.0 T. Illumina, Inc.; 2008. [Part # 1005359 Rev. A] [ http://icom.illumina.com/icom/software.ilmn?id=277 ] [Part # 1005359 Rev. A]
- Illumina:Preparing Samples for Sequencing mRNA. Ilumina, Inc.; 2009. [Part # 1004898 Rev. A] [ http://icom.illumina.com/icom/software.ilmn?id=277 ] [Part # 1004898 Rev. A]
- Taub MA: Analysis of high-throughput biological data: some statistical problems in RNA-seq and mouse genotyping. PhD thesis. Department of Statistics, UC Berkeley; 2009.
- Irizarry RA, Hobbs B, Collin F, Beazer-Barclay YD, Antonellis KJ, Scherf U, Speed TP: Exploration, normalization, and summaries of high density oligonucleotide array probe level data. Biostatistics 2003, 4(1465–4644 (Print)):249–64. 10.1093/biostatistics/4.2.249 · DOI · Paper page
Cited by
Sorted by citations
Items 401–500 of 999
Wiemann, P., Lechner, B. E., Baccile, J. A., Velk, T. A., Yin, W.-B., Bok, J. W., Pakala, S., Losada, L., Nierman, W. C., Schroeder, F. C., et al. (2014) · Frontiers in Microbiology · doi:10.3389/fmicb.2014.00530 · Cited by 60
Differential expression analysis of RNA-seq data at single-base resolution
Frazee, A. C., Sabunciyan, S., Hansen, K. D., Irizarry, R. A., & Leek, J. T. (2014) · Biostatistics · doi:10.1093/biostatistics/kxt053 · Cited by 63
Self-citationHuang, W.-C., Ferris, E., Cheng, T., Hörndli, C. S., Gleason, K., Tamminga, C. A., Wagner, J. D., Boucher, K. M., Christian, J. L., & Gregg, C. J. (2017) · Neuron · doi:10.1016/j.neuron.2017.01.033 · Cited by 59
“Our approach is based on studies that showed that technical variance in RNA-seq data is accurately modeled by the Poisson distribution (Bullard et al., 2010; Marioni et al., 2008; Oberg et al., 2012), and that combined biological + technical variance can be modeled using the negative binomial…”
Zhukova, A., Fernandes, L. G. V., Hugon, P., Pappas, C. J., Sismeiro, O., Coppée, J., Bécavin, C., Malabat, C., Eshghi, A., Zhang, J., et al. (2017) · Frontiers in Cellular and Infection Microbiology · doi:10.3389/fcimb.2017.00010 · Cited by 59
“On each coverage graph the upper quartile normalization (Bullard et al., 2010) was performed.”
MethodCurrent and Future Methods for mRNA Analysis: A Drive Toward Single Molecule Sequencing
Bayega, A., Fahiminiya, S., Oikonomopoulos, S., & Ragoussis, J. (2018) · Methods in molecular biology · doi:10.1007/978-1-4939-7834-2_11 · Cited by 58
Intrinsic electrical activity drives small-cell lung cancer progression
Peinado, P., Stazi, M., Ballabio, C., Margineanu, M.-B., Li, Z., Colón, C. I., Hsieh, M., Choudhuri, S. P., Stastny, V., Hamilton, S., et al. (2025) · Nature · doi:10.1038/s41586-024-08575-7 · Cited by 67
Physico-chemical foundations underpinning microarray and next-generation sequencing experiments
Harrison, A., Binder, H., Buhot, A., Burden, C. J., Carlon, E., Gibas, C., Gamble, L. J., Halperin, A., Hooyberghs, J., Kreil, D. P., et al. (2013) · Nucleic Acids Research · doi:10.1093/nar/gks1358 · Cited by 58
Sensitive gene fusion detection using ambiguously mapping RNA-Seq read pairs
Kinsella, M., Harismendy, O., Nakano, M., Frazer, K. A., & Bafna, V. (2011) · Bioinformatics · doi:10.1093/bioinformatics/btr085 · Cited by 58
Keith, S. A., Maddux, S., Zhong, Y., Chinchankar, M. N., Ferguson, A. A., Ghazi, A., & Fisher, A. L. (2016) · PLoS Genetics · doi:10.1371/journal.pgen.1005823 · Cited by 61
“The resulting transcript counts were then normalized using the upper quartile normalization approach [125].”
MethodSun, Y., Bao, Y., Han, W., Song, F., Shen, X., Zhao, J., Zuo, J., Saffen, D. W., Chen, W., Wang, Z., et al. (2017) · Nucleic Acids Research · doi:10.1093/nar/gkx508 · Cited by 57
“RNA expression levels in TCGA were estimated from RNA-Seq data using the RSEM algorithm (53) and presented as ‘normalized counts’ following upper quartile normalization (54).”
MethodStatistical methods on detecting differentially expressed genes for RNA-seq data
Chen, Z., Liu, J., Ng, H. K. T., Nadarajah, S., Kaufman, H. L., Yang, J. Y., & Deng, Y. (2011) · BMC Systems Biology · doi:10.1186/1752-0509-5-s3-s1 · Cited by 58
Challenges in defining the role of intron retention in normal biology and disease
Vanichkina, D., Schmitz, U., Wong, J. J. L., & Rasko, J. E. J. (2017) · Seminars in Cell and Developmental Biology · doi:10.1016/j.semcdb.2017.07.030 · Cited by 58
“This could be addressed by comparative studies of informatics methodologies, which have a long history in the differential gene expression analysis space [50, 98, 99], but are lacking”
BackgroundGu, Y., Zhang, L., & Chen, X. (2014) · General and Comparative Endocrinology · doi:10.1016/j.ygcen.2014.05.019 · Cited by 57
Gao, M., Cao, M., Suástegui, M., Walker, J., Quiroz, N. R., Wu, Y., Tribby, D., Okerlund, A. L., Stanley, L. M., Shanks, J. V., et al. (2016) · ACS Synthetic Biology · doi:10.1021/acssynbio.6b00132 · Cited by 57
MLSeq: Machine learning interface for RNA-sequencing data
Göksülük, D., Zararsız, G., Korkmaz, S., Eldem, V., Zararsız, G. E., Özçetin, E., Ozturk, A. B., & Karaağaoğlu, A. E. (2019) · Computer Methods and Programs in Biomedicine · doi:10.1016/j.cmpb.2019.04.007 · Cited by 57
Assefa, A. T., Paepe, K. D., Everaert, C., Mestdagh, P., Thas, O., & Vandesompele, J. (2018) · Genome biology · doi:10.1186/s13059-018-1466-5 · Cited by 59
“Previous studies [13, 16, 20, 21] have pointed out that the normalization procedure can affect DE results.”
BackgroundIdentification of long non-coding RNAs in insects genomes
Legeai, F., & Derrien, T. (2015) · Current Opinion in Insect Science · doi:10.1016/j.cois.2015.01.003 · Cited by 57
Reducing bias in RNA sequencing data: a novel approach to compute counts
Finotello, F., Lavezzo, E., Bianco, L., Barzon, L., Mazzon, P. E., Fontana, P., Toppo, S., & Camillo, B. D. (2014) · BMC Bioinformatics · doi:10.1186/1471-2105-15-s1-s7 · Cited by 55
Lawless, N., Reinhardt, T. A., Bryan, K. R., Baker, M., Pesch, B. A., Zimmerman, D. R., Zuelke, K. A., Sonstegard, T. S., O’Farrelly, C., Lippolis, J. D., et al. (2014) · G3 Genes Genomes Genetics · doi:10.1534/g3.113.009936 · Cited by 56
Dual RNA-seq of the plant pathogen Phytophthora ramorum and its tanoak host
Hayden, K. J., Garbelotto, M. M., Knaus, B. J., Cronn, R., Rai, H., & Wright, J. W. (2014) · Tree Genetics & Genomes · doi:10.1007/s11295-014-0698-0 · Cited by 59
SimSeq: a nonparametric approach to simulation of RNA-sequence datasets
Benidt, S., & Nettleton, D. S. (2015) · Bioinformatics · doi:10.1093/bioinformatics/btv124 · Cited by 58
NBLDA: negative binomial linear discriminant analysis for RNA-Seq data
Dong, K., Zhao, H., Tong, T., & Wan, X. (2016) · BMC Bioinformatics · doi:10.1186/s12859-016-1208-1 · Cited by 56
Federico, A., Serra, A., Ha, M. K., Kohonen, P. J., Choi, J., Liampa, I., Nymark, P. E. H., Sanabria, N. M., Cattelani, L., Fratello, M., et al. (2020) · Nanomaterials · doi:10.3390/nano10050903 · Cited by 58
“To overcome this limitation, they proposed a new normalization method [57] which scales the read counts by the upper quantile of the counts distribution (UQUA), after filtering out the genes whose read counts are significantly low in all the samples.”
MethodLi, X., Cooper, N. G. F., O’Toole, T. E., & Rouchka, E. C. (2020) · BMC Genomics · doi:10.1186/s12864-020-6502-7 · Cited by 60
“Still other methods normalize by the expression of control genes such as RUV for removing unwanted technical variation across samples [17, 27], GC-content [28], or log 2 transformed read counts implemented in voom-limma [24, 29].”
MethodResultInfluentialPlacental genomics mediates genetic associations with complex health traits and disease
Bhattacharya, A., Freedman, A. N., Avula, V. R., Harris, R., Liu, W., Pan, C., Lusis, A. J., Joseph, R. M., Smeester, L., Hartwell, H. J., et al. (2022) · Nature Communications · doi:10.1038/s41467-022-28365-x · Cited by 58
Downregulation of OGDHL expression is associated with promoter hypermethylation in colorectal cancer
Fedorova, M., Kudryavtseva, A. V., Lakunina, V. A., Snezhkina, A. V., Волченко, Н. Н., Slavnova, E. N., Данилова, Т. В., Садритдинова, А. Ф., Melnikova, N. V., Белова, А. А., et al. (2015) · Molecular Biology · doi:10.1134/s0026893315040044 · Cited by 55
“75 quar tile normalization, relative log expression (RLE), and trimmed mean of LogFC values (TMM) [40, 41].”
InfluentialBootstrap-based differential gene expression analysis for RNA-Seq data with and without replicates
Seesi, S. A., Temate‐Tiagueu, Y., Zelikovsky, A., & Măndoiu, I. (2014) · BMC Genomics · doi:10.1186/1471-2164-15-s8-s2 · Cited by 57
Single Cell Transcriptome Amplification with MALBAC
Chapman, A. R., He, Z., Lü, S., Yong, J., Tan, L., Tang, F., & Xie, X. S. (2015) · PLoS ONE · doi:10.1371/journal.pone.0120889 · Cited by 55
Sex Chromosome Dosage Compensation in Heliconius Butterflies: Global yet Still Incomplete?
Walters, J. R., Hardcastle, T. J., & Jiggins, C. D. (2015) · Genome Biology and Evolution · doi:10.1093/gbe/evv156 · Cited by 55
Bouvy‐Liivrand, M., de Sande, A. H., Pölönen, P., Mehtonen, J., Vuorenmaa, T., Niskanen, H., Sinkkonen, L., Kaikkonen, M. U., & Heinäniemi, M. (2017) · Nucleic Acids Research · doi:10.1093/nar/gkx680 · Cited by 54
“The scaling factors used for normalizing the scores across samples were obtained by upper quartile normalization (31) of the regions corresponding to annotated TSS.”
MethodLight regulates alternative splicing outcomes via the TOR kinase pathway
Riegler, S., Servi, L., Scarpin, M. R., Herz, M. A. G., Kubaczka, M. G., Venhuizen, P., Meyer, C., Brunkard, J. O., Kalyna, M., Barta, A., et al. (2021) · Cell Reports · doi:10.1016/j.celrep.2021.109676 · Cited by 55
“The TMM method was used to normalize the gene and transcript read counts to log2-CPM (Bullard et al., 2010).”
MethodGenome-guided transcript assembly by integrative analysis of RNA sequence data
Boley, N., Stoiber, M. H., Booth, B. W., Wan, K. H., Hoskins, R. A., Bickel, P. J., Celniker, S. E., & Brown, J. B. (2014) · Nature Biotechnology · doi:10.1038/nbt.2850 · Cited by 48
Statistical and Bioinformatics Analysis of Data from Bulk and Single-Cell RNA Sequencing Experiments
Yu, X., Aghababazadeh, F. A., Chen, Y. A., & Fridley, B. L. (2020) · Methods in molecular biology · doi:10.1007/978-1-0716-0849-4_9 · Cited by 55
“To correct for library size, most of methods use a common scaling factor per sample to normalize genes such as upper quartile (UQ) [45], median (Med) [45], relative log expression (RLE) [52], trimmed mean of M-values (TMM) [53], and quantile (Q) [54, 55].”
BackgroundMethodInfluentialChallenges and best practices in omics benchmarking
Brooks, T. G., Lahens, N. F., Mrčela, A., & Grant, G. R. (2024) · Nature Reviews Genetics · doi:10.1038/s41576-023-00679-6 · Cited by 58
“The Stratagene Universal Human Reference (UHR) sample 139 is usually used to benchmark RNA-sequencing methods.”
A Log-Linear Graphical Model for inferring genetic networks from high-throughput sequencing data
Allen, G. I., & Liu, Z. (2012) · IEEE International Conference on Bioinformatics and Biomedicine (BIBM) · doi:10.1109/bibm.2012.6392619 · Cited by 54
Muroya, S., Taniguchi, M., Shibata, M., Oe, M., Ojima, K., Nakajima, I., & CHIKUNI, K. (2012) · Journal of Animal Science · doi:10.2527/jas.2012-5371 · Cited by 57
The transcriptome landscape of early maize meiosis
Dukowic‐Schulze, S., Sundararajan, A., Mudge, J., Ramaraj, T., Farmer, A. D., Wang, M., Sun, Q., Pillardy, J., Kianian, S. F., Retzel, E. F., et al. (2014) · BMC Plant Biology · doi:10.1186/1471-2229-14-118 · Cited by 54
Regulatory Requirements for Staphylococcus aureus Nitric Oxide Resistance
Grosser, M. R., Weiss, A., Shaw, L. N., & Richardson, A. R. (2016) · Journal of Bacteriology · doi:10.1128/jb.00229-16 · Cited by 53
Spatially Resolved Deconvolution of the Fibrotic Niche in Lung Fibrosis
Eyres, M., Bell, J. A., Davies, E. R., Fabre, A., Alzetani, A., Jogai, S., Marshall, B. G., Johnston, D. A., Xu, Z., Fletcher, S., et al. (2022) · Cell Reports · doi:10.1016/j.celrep.2022.111230 · Cited by 54
Alternative Polyadenylation of Mammalian Transcripts Is Generally Deleterious, Not Adaptive
Xu, C., & Zhang, J. (2018) · Cell Systems · doi:10.1016/j.cels.2018.05.007 · Cited by 49
“…or RESOURCE SOURCE IDENTIFIER Deposited Data PolyA-seq data Derti et al., 2012 https://www.ncbi.nlm.nih.gov/geo/; GSE: GSE30198 RNA-seq data Bullard et al., 2010 https://trace.ddbj.nig.ac.jp/DRASearch/; SRA: SRX016359 and SRX016367 SNP and PASs Kainov et al., 2016 N/A Software and…”
Muhammad, I. I., Kong, S. L., Abdullah, S. N. A., & Munusamy, U. (2019) · International Journal of Molecular Sciences · doi:10.3390/ijms21010167 · Cited by 55
“While reproducibility of RNA-seq data across lanes and flow cells is generally high, biological replication is mandatory o population inferential analysis [48].”
BackgroundJunior, H. P. D. O. S., Bhattacharya, A., Joseph, R. M., Smeester, L., Kuban, K., Marsit, C. J., O’Shea, T. M., & Fry, R. C. (2020) · Molecular Autism · doi:10.1186/s13229-020-00402-w · Cited by 52
DNA damage induces targeted, genome-wide variation of poly(A) sites in budding yeastPreprint
Graber, J. H., Nazeer, F. I., Yeh, P.-C., Kuehner, J. N., Borikar, S., Hoskinson, D. C., & Moore, C. L. (2013) · Genome Research · doi:10.1101/gr.144964.112 · Cited by 53
PHF6 regulates phenotypic plasticity through chromatin organization within lineage-specific genesPreprint
Soto‐Feliciano, Y. M., Bartlebaugh, J. M. E., Liu, Y., Rivera, F. J. S., Bhutkar, A. J., Weintraub, A. S., Buenrostro, J. D., Cheng, C. S., Regev, A., Jacks, T., et al. (2017) · Genes & Development · doi:10.1101/gad.295857.117 · Cited by 53
“Raw estimated expression counts were upper-quartile-normalized to a count of 1000 (Bullard et al. 2010).”
Skelly, D. A., Czechanski, A., Byers, C., Aydin, S., Spruce, C. A., Olivier, C., Choi, K., Gatti, D. M., Raghupathy, N., Keele, G. R., et al. (2020) · Cell stem cell · doi:10.1016/j.stem.2020.07.005 · Cited by 54
“We chose upper quartile normalization rather than TPM normalization because the latter is influenced by variation in a small number of the most highly expressed genes (Bullard et al., 2010).”
BackgroundFerguson, A. A., Roy, S. S., Kormanik, K., Kim, Y.-S., Dumas, K. J., Ritov, V. B., Matern, D., Hu, P. J., & Fisher, A. L. (2013) · PLoS Genetics · doi:10.1371/journal.pgen.1004020 · Cited by 49
Production of fatty acids in Ralstonia eutropha H16 by engineering β -oxidation and carbon storage
Chen, J. S., Colón, B. C., Dusel, B., Ziesack, M., Way, J. C., & Torella, J. P. (2015) · PeerJ · doi:10.7717/peerj.1468 · Cited by 51
“Read counts normalized to upper-quartile gene expression ( McClure et al., 2013 ; Bullard et al., 2010 ) were used to identify four genes annotated as acyl-CoA ligases in the R. eutropha genome that were upregulated strongly ( ≥ 5-fold) and significantly ( q -value < 0.001) during growth on laurate…”
MethodInfluentialZhao, S., Sun, J., Shimizu, K., & Kadota, K. (2018) · Biological Procedures Online · doi:10.1186/s12575-018-0067-8 · Cited by 50
“RNA-seq is now the main method used to obtain expression data, but microarrays have provided important insights (e.g., [9]).”
MethodTan, L., Shao, Y., Mu, G., Ning, S., & Shi, S. (2019) · Bioresource Technology · doi:10.1016/j.biortech.2019.122283 · Cited by 51
Single-Cell RNA Sequencing of the Cardiovascular System: New Looks for Old Diseases
Chaudhry, F., Isherwood, J., Bawa, T. S., Patel, D. A., Gurdziel, K., Lanfear, D. E., Ruden, D. M., & Levy, P. D. (2019) · Frontiers in Cardiovascular Medicine · doi:10.3389/fcvm.2019.00173 · Cited by 53
Isoform Diversity and Regulation in Peripheral and Central Neurons Revealed through RNA-Seq
Lerch, J. K., Kuo, F., Motti, D., Morris, R., Bixby, J. L., & Lemmon, V. P. (2012) · PLoS ONE · doi:10.1371/journal.pone.0030417 · Cited by 50
Chen, Z., Wen, B., Wang, Q., Tong, W., Guo, J., Bai, X., Zhao, J., Sun, Y., Tang, Q., Lin, Z., et al. (2013) · Molecular & Cellular Proteomics · doi:10.1074/mcp.m112.025817 · Cited by 48
Length bias correction for RNA-seq data in gene set analyses
Gao, L., Fang, Z., Zhang, K., Zhi, D., & Cui, X. (2011) · Bioinformatics · doi:10.1093/bioinformatics/btr005 · Cited by 50
A full-body transcriptome and proteome resource for the European common carp
Kolder, I. C. R. M., van der Plas-Duivesteijn, S. J., Tan, G., Wiegertjes, G. F., Forlenza, M., Güler, A. T., Travin, D. Y., Nakao, M., Moritomo, T., Irnazarow, I., et al. (2016) · BMC Genomics · doi:10.1186/s12864-016-3038-y · Cited by 50
“Dividing counts by simple sequencing depth (the total number of reads) can lead to inaccurate results [28], as it is strongly influenced by the most abundantly expressed genes.”
BackgroundTT‐seq captures enhancer landscapes immediately after T‐cell stimulation
Michel, M., Demel, C., Zacher, B., Schwalb, B., Krebs, S., Blum, H., Gagneur, J., & Cramer, P. (2017) · Molecular Systems Biology · doi:10.15252/msb.20167507 · Cited by 51
RNA-Seq Reveals Novel Transcriptional Reorganization in Human Alcoholic Brain
Farris, S. P., & Dayne Mayfield, R. (2014) · International Review of Neurobiology · doi:10.1016/b978-0-12-801105-8.00011-4 · Cited by 49
Kim, G. J., Mo, H., Liu, H., Wu, Z., Chen, S., Zheng, J., Zhao, X., Nucum, D., Shortland, J., Peng, L., et al. (2021) · eLife · doi:10.7554/elife.69795 · Cited by 49
“This normalization method allows for gene count comparisons between samples, which is suitable for comparing differential gene expression across different sample groups with high sensitivity and specificity ( Li et al., 2020 ; Bullard et al., 2010 ).”
CLIPSeqTools—a novel bioinformatics CLIP-seq analysis suite
Maragkakis, M., Alexiou, P., Nakaya, T., & Mourelatos, Z. (2015) · RNA · doi:10.1261/rna.052167.115 · Cited by 50
“Finally, to identify potential differential binding between two conditions, the pipeline performs upper quartile normalization (Bullard et al. 2010) on all conditions combined and compares the binding levels for genes, gene transcripts, introns, and exons (compare_counts).”
MethodInfluentialGuanylate-binding protein-1 is a potential new therapeutic target for triple-negative breast cancer
Quintero, M., Adamóski, D., dos Reis, L. M., Ascenção, C. F. R., de Oliveira, K. R. S., Gonçalves, K. D. A., Dias, M. M., Carazzolle, M. F., & Dias, S. M. G. (2017) · BMC Cancer · doi:10.1186/s12885-017-3726-2 · Cited by 50
“Normalization performed with upper-quantile [35] methodology harmonized all of the datasets (right).”
MethodMiller, J. A., Menon, V., Goldy, J., Kaykas, A., Lee, C.-K., Smith, K. A., Shen, E. H., Phillips, J. W., Lein, E. S., & Hawrylycz, M. J. (2014) · BMC Genomics · doi:10.1186/1471-2164-15-154 · Cited by 48
Bi, Y., Meyer, A., Downs, G. S., Shi, X., El‐Kereamy, A., LUKENS, L. N., & Rothstein, S. J. (2014) · BMC Genomics · doi:10.1186/1471-2164-15-77 · Cited by 48
Liu, S., Shan, B., Zhou, X., Gao, W., Liu, Y., Zhu, B., & Sun, L. (2022) · Journal of Agricultural and Food Chemistry · doi:10.1021/acs.jafc.2c00368 · Cited by 48
The Roles of Compensatory Evolution and Constraint in Aminoacyl tRNA Synthetase Evolution
Adrion, J. R., White, P. S., & Montooth, K. L. (2015) · Molecular Biology and Evolution · doi:10.1093/molbev/msv206 · Cited by 47
“We used a quartile library normalization method to improve the accuracy of expression calls for low abundance transcripts (Bullard et al. 2010) and to scale among replicate libraries.”
MethodFicklin, S. P., Dunwoodie, L. J., Poehlman, W. L., Watson, C., Roche, K. E., & Feltus, F. A. (2017) · Scientific Reports · doi:10.1038/s41598-017-09094-4 · Cited by 48
Gonçalves, T. M., Regitano, L. C. D. A., Koltes, J. E., César, A. S. M., Andrade, S. C. D. S., Mourão, G. B., Gasparin, G. R., Moreira, G. C. M., Fritz‐Waters, E., Reecy, J. M., et al. (2018) · Frontiers in Genetics · doi:10.3389/fgene.2018.00441 · Cited by 48
“Read count data was normalized for differences in library size using the 75% Quartile method to account for differences in RNA quantity and other library effects (Bullard et al., 2010).”
MethodSong, Y., Hanner, R., & Meng, B. (2021) · Viruses · doi:10.3390/v13040593 · Cited by 54
Valli, A. A., Santos, B., Hnatova, S., Bassett, A. R., Molnár, A., Chung, B., & Baulcombe, D. C. (2016) · Genome Research · doi:10.1101/gr.199703.115 · Cited by 48
“The library scaling factor (surrogates for library size) has to be specified for each sample, and they were calculated by using the previously described quantile normalization (Bullard et al. 2010).”
MethodReference-based compression of short-read sequences using path encoding
Kingsford, C., & Patro, R. (2015) · Bioinformatics · doi:10.1093/bioinformatics/btv071 · Cited by 52
Nalpas, N., Magee, D. A., Conlon, K. M., Browne, J. A., Healy, C. M., McLoughlin, K. E., Rue-Albrecht, K., McGettigan, P., Killick, K. E., Gormley, E. P., et al. (2015) · Scientific Reports · doi:10.1038/srep13629 · Cited by 50
Robinson, N. A., Baranski, M., Mahapatra, K. D., Saha, J. N., Das, S., Mishra, J., Das, P., Kent, M., Árnyasi, M., & Sahoo, P. K. (2014) · BMC Genomics · doi:10.1186/1471-2164-15-541 · Cited by 47
Analysis combining correlated glaucoma traits identifies five new risk loci for open-angle glaucoma
Gharahkhani, P., Burdon, K. P., Bailey, J. N. C., Hewitt, A. W., Law, M. H., Pasquale, L. R., Kang, J. H., Haines, J. L., Souzeau, E., Zhou, T., et al. (2018) · Scientific Reports · doi:10.1038/s41598-018-20435-9 · Cited by 47
RNA-seq mixology: designing realistic control experiments to compare protocols and analysis methods
Holik, A. Z., Law, C. W., Liu, R., Wang, Z., Wang, W., Ahn, J., Asselin-Labat, M.-L., Smyth, G. K., & Ritchie, M. E. (2016) · Nucleic Acids Research · doi:10.1093/nar/gkw1063 · Cited by 47
“Quantile normalization (21) is carried out for baySeq methods; normalization using the median ratio method (22) is carried out for DESeq2 and TMM normalization (23) is carried out for edgeR and voom methods.”
Methodvan Alphen, B., Stewart, S., Iwanaszko, M., Xu, F., Li, K., Rozenfeld, S., Ramakrishnan, A., Itoh, T. Q., Sisobhan, S., Qin, Z., et al. (2022) · PLoS Biology · doi:10.1371/journal.pbio.3001456 · Cited by 54
“Small deviations, arising from the technical differences, can be observed in D01 and D03; these were removed with UQ between lane correction [70].”
The hitchhikers’ guide to RNA sequencing and functional analysis
Chen, J.-W., Shrestha, L., Green, G. A., Leier, A., & Marquez‐Lago, T. T. (2023) · Briefings in Bioinformatics · doi:10.1093/bib/bbac529 · Cited by 53
RNASeqGUI: a GUI for analysing RNA-Seq data
Russo, F., & Angelini, C. (2014) · Bioinformatics · doi:10.1093/bioinformatics/btu308 · Cited by 46
Wolfien, M., Rimmbach, C., Schmitz, U., Jung, J., Krebs, S., Steinhoff, G., David, R., & Wolkenhauer, O. (2016) · BMC Bioinformatics · doi:10.1186/s12859-015-0873-9 · Cited by 49
“Nevertheless, it has to be considered that the RPKM value for a gene from a deep library may have more statistical meaning than an equivalent value from a more shallow library [51].”
BackgroundFang, R., Wagner, B. D., Harris, J. K., & Fillon, S. (2016) · Epidemiology and Infection · doi:10.1017/s0950268816000662 · Cited by 46
Choudhary, K., Deng, F., & Aviran, S. (2017) · Quantitative Biology · doi:10.1007/s40484-017-0093-6 · Cited by 44
“Finally, readouts from sequencing machines are also affected by stochasticities [54,66,67].”
BackgroundMadhavan, A., Anju, A. J., Binod, P., Sindhu, R., Sukumaran, R. K., Pandey, A., & Castro, G. E. (2017) · Frontiers in Energy Research · doi:10.3389/fenrg.2017.00008 · Cited by 46
“Recent transcriptomic study under lignocellulosic biomass inducing condition and oxygen limited condition resulted in the mapping of several important genes (Bullard et al., 2010).”
Differential Expression Analysis of RNA-seq Reads: Overview, Taxonomy, and Tools
Chowdhury, H. A., Bhattacharyya, D. K., & Kalita, J. K. (2018) · IEEE Transactions on Computational Biology and Bioinformatics · doi:10.1109/tcbb.2018.2873010 · Cited by 49
“Please refer to [96] for detailed performance evaluation of”
BackgroundMaize ANT1 modulates vascular development, chloroplast development, photosynthesis, and plant growth
Liu, W.-Y., Lin, H.-H., Yu, C.-P., Chang, C.-K., Chen, H.-J., Lin, J.-J., Lu, M. J., Tu, S., Shiu, S., Wu, S., et al. (2020) · Proceedings of the National Academy of Sciences · doi:10.1073/pnas.2012245117 · Cited by 45
“To compare the RPKMs of the selected genes across time points in a set of transcriptomes, we applied the upper quartile normalization procedure (55).”
MethodLu, Z., Guan, X., Schmidt, C. A., & Matera, A. G. (2014) · Genome biology · doi:10.1186/gb-2014-15-1-r7 · Cited by 46
ExpressionPlot: a web-based framework for analysis of RNA-Seq and microarray gene expression data
Friedman, B. A., & Maniatis, T. (2011) · Genome biology · doi:10.1186/gb-2011-12-7-r69 · Cited by 45
Galinier, R., Roger, E., Moné, Y., DUVAL, D. T., Portet, A., Pinaud, S., Chaparro, C., Grunau, C., Genthon, C., Dubois, E., et al. (2017) · PLoS neglected tropical diseases · doi:10.1371/journal.pntd.0005398 · Cited by 45
“The obtained values were normalized by the upper quartile method [46], which has been proposed to be more accurate than the RPKM method of normalization [47].”
MethodLiu, S., Guo, C., Lin, W., Wu, F., Lu, G., Lü, J., & Dang, Z. (2017) · The Science of The Total Environment · doi:10.1016/j.scitotenv.2017.07.245 · Cited by 45
Elicitor hydrophobin Hyd1 interacts with Ubiquilin1‐like to induce maize systemic resistance
Yu, C., Dou, K., Wang, S., Wu, Q., Ni, M., Zhang, T., Lu, Z., Tang, J., & Chen, J. (2019) · Journal of Integrative Plant Biology · doi:10.1111/jipb.12796 · Cited by 45
Leonard, M. M., Bai, Y., Serena, G., Nickerson, K. P., Camhi, S. S., Sturgeon, C., Yan, S., Fiorentino, M. R., Katz, A. J., Nath, B. J., et al. (2019) · PLoS ONE · doi:10.1371/journal.pone.0215132 · Cited by 46
DegNorm: normalization of generalized transcript degradation improves accuracy in RNA-seq analysis
Xiong, B., Yang, Y., Fineis, F., & Wang, J.-P. (2019) · Genome biology · doi:10.1186/s13059-019-1682-7 · Cited by 46
“Normalization is a crucial step in post-experiment data processing to ensure a fair comparison of gene expression in RNA-seq analysis [3, 4].”
BackgroundMethodRNAflow: An Effective and Simple RNA-Seq Differential Gene Expression Pipeline Using Nextflow
Lataretu, M., & Hölzer, M. (2020) · Genes · doi:10.3390/genes11121487 · Cited by 49
“The single-end short reads are available under the NCBI Short-Read Archive (SRA) accessions SRR037445-SRR037451 (UHR, seven biological replicates) and SRR035678, SRR037439-SRR37444 (Brain, seven biological replicates) [44].”
MethodSilva, J. C., Domingues, D. S., Menotti, D., Hungría, M., & Lopes, F. M. (2022) · Computational and Structural Biotechnology Journal · doi:10.1016/j.csbj.2022.11.051 · Cited by 45
“Among the most widely used distributions for DEG analysis are the Negative Binomial [30,12,11,6], Poisson [94,95,91–93] and Gaussian [96–98] distributions.”
MethodTsai, Y., Dominguez, D., Gomez, S. M., & Wang, Z. (2015) · Oncotarget · doi:10.18632/oncotarget.3145 · Cited by 48
Evolutionary and Experimental Loss of Gene Body Methylation and Its Consequence to Gene Expression
Bewick, A. J., Zhang, Y., Wendte, J. M., Zhang, X., & Schmitz, R. J. (2019) · G3 Genes Genomes Genetics · doi:10.1534/g3.119.400365 · Cited by 43
“BMC Bioinformatics 11: 94. https://doi.org/ 10.1186/1471-2105-11-94 Chen, Y., A. T. L. Lun, and G. K. Smyth, 2016 From reads to genes to pathways: differential expression analysis of RNA-Seq experiments using Rsubread and the edgeR quasi-likelihood pipeline.”
MethodInfluentialCronn, R., Dolan, P. C., Jogdeo, S., Wegrzyn, J., Neale, D. B., Clair, J. B. S., & Denver, D. R. (2017) · BMC Genomics · doi:10.1186/s12864-017-3916-y · Cited by 44
Win, S., Min, R. W. M., Chen, C. Q., Zhang, J., Chen, Y., Li, M., Suzuki, A., Abdelmalek, M. F., Wang, Y., Aghajan, M., et al. (2019) · Journal of Clinical Investigation · doi:10.1172/jci128289 · Cited by 42
“(82) with offset 1 and analyzed for differential expression using the”
MethodLinnstaedt, S. D., Rueckeis, C. A., Riker, K. D., Pan, Y., Wu, A. H. B., Yu, S., Wanstrath, B. J., Gonzalez, M., Harmon, E., Green, P. G., et al. (2019) · Pain · doi:10.1097/j.pain.0000000000001709 · Cited by 45
High heterogeneity undermines generalization of differential expression results in RNA-Seq analysis
Cui, W., Xue, H., Wei, L., Jin, J., Tian, X., & Wang, Q. (2021) · Human Genomics · doi:10.1186/s40246-021-00308-5 · Cited by 42
A three-stage developmental pathway for human Vγ9Vδ2 T cells within the postnatal thymus
Perriman, L., Tavakolinia, N., Jalali, S., Li, S., Hickey, P. F., Amann‐Zalcenstein, D., Ho, W. W. H., Baldwin, T. M., Piers, A. T., Konstantinov, I. E., et al. (2023) · Science Immunology · doi:10.1126/sciimmunol.abo4365 · Cited by 42
“We applied upper-quartile normalization (87) to the count matrix, performed differential gene expression analysis using the likelihood ratio testing framework in edgeR (88), and visualized the results in Glimma (89).”
MethodLee, K., Huang, X., Yang, C., Lee, D., Ho, V., Nobuta, K., Fan, J., & Wang, K. (2013) · PLoS ONE · doi:10.1371/journal.pone.0070720 · Cited by 43
Frank, M. H., & Scanlon, M. J. (2015) · The Plant Journal · doi:10.1111/tpj.12928 · Cited by 43
Ganapathi, M. K., Jones, W. D., Sehouli, J., Michener, C. M., Braicu, E. I., Norris, E. J., Biscotti, C. V., Vaziri, S. A. J., & Ganapathi, R. N. (2015) · International Journal of Cancer · doi:10.1002/ijc.29815 · Cited by 43
“Result per sample was normalized for comparative purposes using the upper quartile normalization method.(25) All samples were quality reviewed related to consistency in key metrics such as genes detected (21,1836 370), mapping, GC content (61.”
Method
Metadata
- Authors
- Bullard, J. H., Purdom, E., Hansen, K. D., & Dudoit, S.
- Affiliations
- University of California, Berkeley (US)
- Corresponding author
- Bullard, James H
- Venue
- BMC Bioinformatics
- Published
- 2010-02-18
- Volume
- 11
- Issue
- 1
- Pages
- 94-94
- ISSN
- 1471-2105 (ISSN-L)
- PMC
- PMC2838869
- OpenAlex
- W2156631105
- Cited by
- 1,680
- References
- 23
- Citations by year
- 2026: 29 · 2025: 51 · 2024: 69 · 2023: 68 · 2022: 92 · 2021: 132 · 2020: 127 · 2019: 123 · 2018: 123 · 2017: 133 · 2016: 121 · 2015: 129 · 2014: 161 · 2013: 128 · 2012: 98
- FWCI
- 41.79
- Type
- journal article
- Language
- en
- Open access
- gold
- doi.org
- Licence
- Locations
- BMC Bioinformatics (publishedVersion, cc-by)
- PubMed Central (publishedVersion, cc-by)
- PubMed (publishedVersion)
- Collection of Biostatistics Research Archive (submittedVersion)
- DOAJ (DOAJ: Directory of Open Access Journals) (submittedVersion, cc-by-sa)
- eScholarship (California Digital Library) (submittedVersion)
- Funders
- National Science Foundation
- National Institutes of Health
- National Human Genome Research Institute (U01HG004271)
- Topics
- Life Sciences › Biochemistry, Genetics and Molecular Biology › Molecular Biology › Gene expression and cancer classification
- Life Sciences › Biochemistry, Genetics and Molecular Biology › Molecular Biology › Genomics and Phylogenetic Studies
- Life Sciences › Biochemistry, Genetics and Molecular Biology › Molecular Biology › Single-cell and spatial transcriptomics
- Keywords
- mRNA-seq, read count normalization, differential gene expression, method comparison
- MeSH terms
- RNA, Messenger, Sequence Analysis, RNA, Computational Biology, Databases, Genetic
About these checks
Registry, retraction, Cites and statistics results are computed, not judged, with one exception: a printed reference that no index lists is read once by a model before it counts as a citation error. Claims are extracted by a model and kept only when their quote appears verbatim in the text; each cited source is then checked, with a model’s help, for whether it says what the claim relies on. Those verdicts can be wrong — read the claim’s quote and the cited source before relying on one.
Statistics and arithmetic are recomputed, not judged.
Confidence bands are shown only for fields calibrated on our annotated test set. None is calibrated yet, so no band is shown.
What counts as a claim ›How we measure confidence ›How we check this ›
Are you an author, or do you see a problem with this page? Request a review
