

The DOI matches its Crossref record; 75 of the 76 references it cites were found in a registry or an index.
The transcriptional landscape of mouse beta cells compared to human beta cells reveals notable species differences in long non-coding RNA and protein-coding gene expression
Open accessAbstract
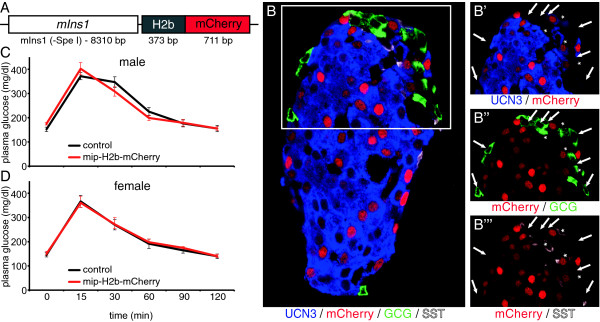
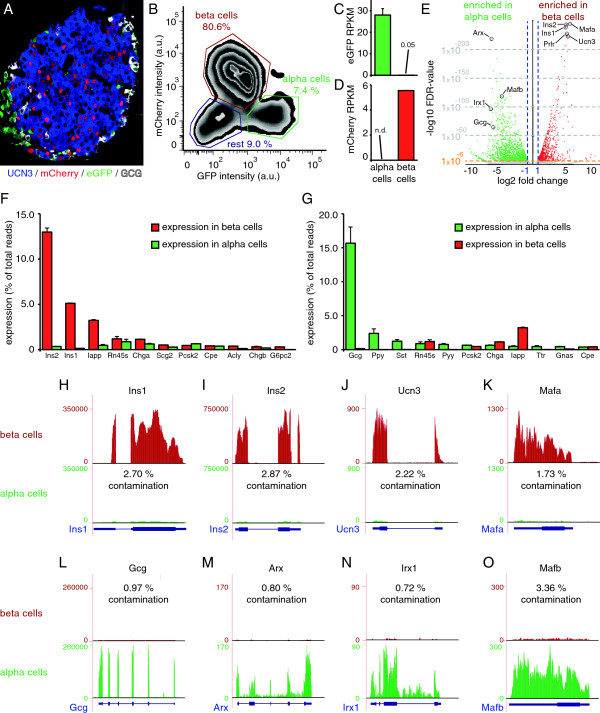
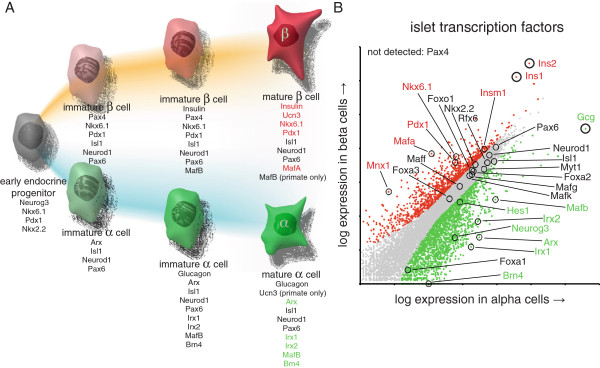
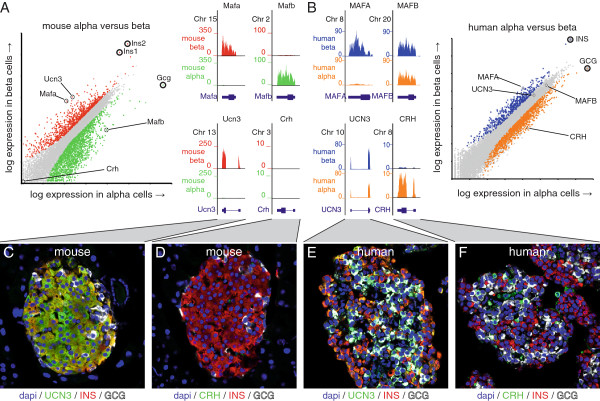
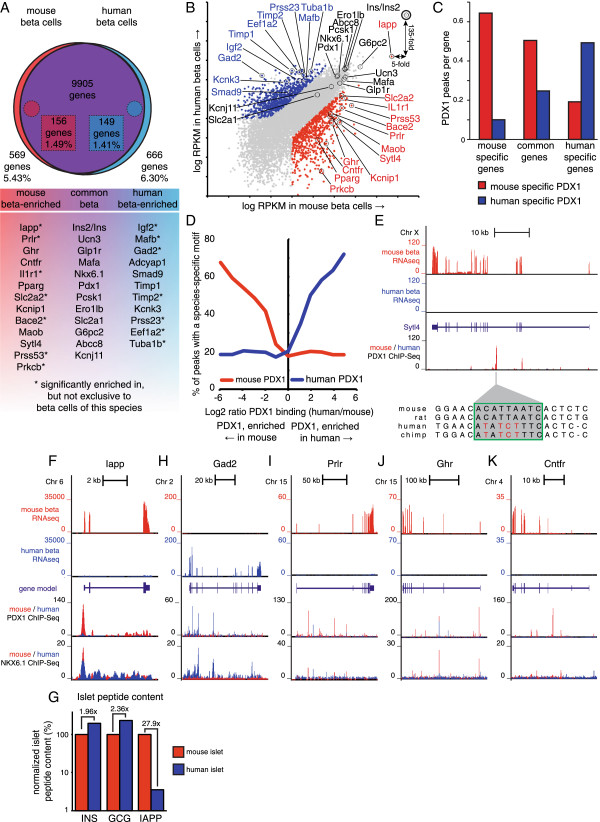
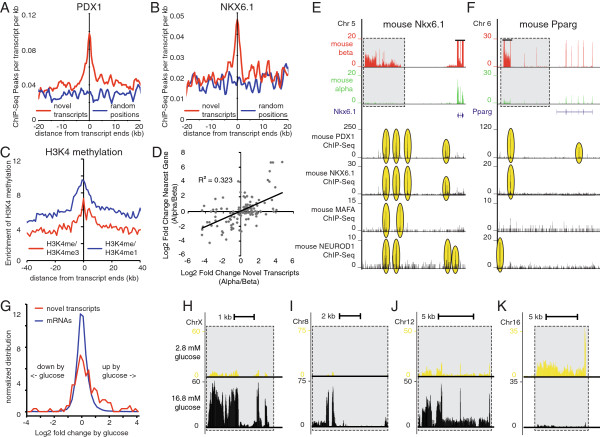
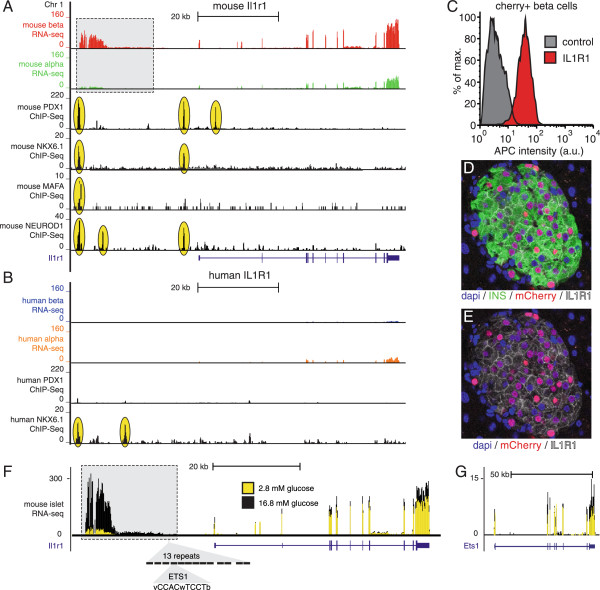
BACKGROUND: Insulin producing beta cell and glucagon producing alpha cells are colocalized in pancreatic islets in an arrangement that facilitates the coordinated release of the two principal hormones that regulate glucose homeostasis and prevent both hypoglycemia and diabetes. However, this intricate organization has also complicated the determination of the cellular source(s) of the expression of genes that are detected in the islet. This reflects a significant gap in our understanding of mouse islet physiology, which reduces the effectiveness by which mice model human islet disease. RESULTS: To overcome this challenge, we generated a bitransgenic reporter mouse that faithfully labels all beta and alpha cells in mouse islets to enable FACS-based purification and the generation of comprehensive transcriptomes of both populations. This facilitates systematic comparison across thousands of genes between the two major endocrine cell types of the islets of Langerhans whose principal hormones are of cardinal importance for glucose homeostasis. Our data leveraged against similar data for human beta cells reveal a core common beta cell transcriptome of 9900+ genes. Against the backdrop of overall similar beta cell transcriptomes, we describe marked differences in the repertoire of receptors and long non-coding RNAs between mouse and human beta cells. CONCLUSIONS: The comprehensive mouse alpha and beta cell transcriptomes complemented by the comparison of the global (dis)similarities between mouse and human beta cells represent invaluable resources to boost the accuracy by which rodent models offer guidance in finding cures for human diabetes.
Overview
The claims and statistics of this paper haven’t been checked yet.
Run the check — free, no account needed. It reads the open-access text and checks the sources it cites.
Integrity signals
Registry
Cites
Statistics
Figures
Verification
Claims the paper makes
The claims and statistics of this paper haven’t been checked yet.
Run the check — free, no account needed. It reads the open-access text and checks the sources it cites.
Claims other papers make about this one
Each is checked against this paper’s own text: does it say what the citing paper says it does?
The check wasn’t confident either way, so it gives no verdict — never disputed.
In the citing paper
“A tetrameric complex of two α- and two β-subunits, the Na-K ATPase of both mouse and human β-cells is predominantly composed of α1-, β1- and β3-subunits (56, 68).”
From Pancreatic β-Cell Electrical Activity and Insulin Secretion: Of Mice and Men (2018) · cites this paper as [56]
Experimental — accuracy not yet measuredThe check wasn’t confident either way, so it gives no verdict — never disputed.
In the citing paper
“However, Ryrs are only expressed at low levels in mouse β-cells (56).”
From Pancreatic β-Cell Electrical Activity and Insulin Secretion: Of Mice and Men (2018) · cites this paper as [56]
Experimental — accuracy not yet measuredThe check wasn’t confident either way, so it gives no verdict — never disputed.
In the citing paper
“Mouse β-cells express Slc1a5 (encoding the transporter ASCT20) (56), which mediates Na+-dependent uptake of glutamate into the β-cell (Appendix Figure 11A).”
From Pancreatic β-Cell Electrical Activity and Insulin Secretion: Of Mice and Men (2018) · cites this paper as [56]
Experimental — accuracy not yet measuredThe check wasn’t confident either way, so it gives no verdict — never disputed.
In the citing paper
“Interestingly, mouse β-cells express Epac2 at ≈10-fold higher levels than their human counterparts (56).”
From Pancreatic β-Cell Electrical Activity and Insulin Secretion: Of Mice and Men (2018) · cites this paper as [56]
Experimental — accuracy not yet measured
Self-check
Percentages, sums and reported differences re-computed from the paper’s own numbers.
The self-check needs the paper’s full text.
Citations
Cites
1 retracted
Baeyens, L., Lemper, M., Leuckx, G., Groef, S. D., Bonfanti, P., Stangé, G. M., Shemer, R., Nord, C., Scheel, D. W., Pan, F. C., et al. (2013) · Nature Biotechnology · doi:10.1038/nbt.2747 · Cited by 179
RetractedSTAR: ultrafast universal RNA-seq aligner
Dobin, A., Davis, C. A., Schlesinger, F., Drenkow, J., Zaleski, C., Jha, S., Batut, P., Chaisson, M., & Gingeras, T. R. (2013) · Bioinformatics · doi:10.1093/bioinformatics/bts635 · Cited by 51,709
BEDTools: a flexible suite of utilities for comparing genomic features
Quinlan, A. R., & Hall, I. M. (2010) · Bioinformatics · doi:10.1093/bioinformatics/btq033 · Cited by 27,437
Differential expression analysis for sequence count data
Anders, S., & Huber, W. (2010) · Genome Biology · doi:10.1186/gb-2010-11-10-r106 · Cited by 15,581
Trapnell, C., Williams, B. A., Pertea, G., Mortazavi, A., Kwan, G., van Baren, M. J., Salzberg, S. L., Wold, B. J., & Pachter, L. (2010) · Nature Biotechnology · doi:10.1038/nbt.1621 · Cited by 15,556
Huang, D. W., Sherman, B. T., & Lempicki, R. A. (2009) · Nucleic Acids Research · doi:10.1093/nar/gkn923 · Cited by 14,108
Mapping and quantifying mammalian transcriptomes by RNA-Seq
Mortazavi, A., Williams, B. A., McCue, K., Schaeffer, L., & Wold, B. (2008) · Nature Methods · doi:10.1038/nmeth.1226 · Cited by 13,696
Heinz, S., Benner, C., Spann, N., Bertolino, E., Lin, Y. C., Laslo, P., Cheng, J. X., Murre, C., Singh, H., & Glass, C. K. (2010) · Molecular Cell · doi:10.1016/j.molcel.2010.05.004 · Cited by 13,382
Self-citationLong non-coding RNAs: insights into functions
Mercer, T. R., Dinger, M. E., & Mattick, J. S. (2009) · Nature Reviews Genetics · doi:10.1038/nrg2521 · Cited by 5,654
Cabili, M. N., Trapnell, C., Goff, L. A., Koziol, M. J., Tazón‐Vega, B., Regev, A., & Rinn, J. L. (2011) · Genes & Development · doi:10.1101/gad.17446611 · Cited by 3,551
Cited by
Sorted by citations
Items 101–200 of 310
Piecing together the puzzle of pancreatic islet adaptation in pregnancy
Banerjee, R. R. (2018) · Annals of the New York Academy of Sciences · doi:10.1111/nyas.13552 · Cited by 41
Loss of α2δ-1 Calcium Channel Subunit Function Increases the Susceptibility for Diabetes
Mastrolia, V., Flucher, S. M., Obermair, G. J., Drach, M., Hofer, H., Renström, E., Schwartz, A., Striessnig, J., Flucher, B. E., & Tuluc, P. (2017) · Diabetes · doi:10.2337/db16-0336 · Cited by 40
Modeling different types of diabetes using human pluripotent stem cells
Abdelalim, E. M. (2020) · Cellular and Molecular Life Sciences · doi:10.1007/s00018-020-03710-9 · Cited by 38
Pancreatic Pseudoislets: An Organoid Archetype for Metabolism Research
Friedlander, M. S. H., Nguyen, V., Kim, S. K., & Bevacqua, R. J. (2021) · Diabetes · doi:10.2337/db20-1115 · Cited by 42
TALK-1 channels control β cell endoplasmic reticulum Ca 2+ homeostasis
Vierra, N. C., Dadi, P. K., Milian, S. C., Dickerson, M. T., Jordan, K. L., Gilon, P., & Jacobson, D. A. (2017) · Science Signaling · doi:10.1126/scisignal.aan2883 · Cited by 37
Petrenko, V., & Dibner, C. (2017) · Acta Physiologica · doi:10.1111/apha.13021 · Cited by 38
Serine racemase is expressed in islets and contributes to the regulation of glucose homeostasis
Lockridge, A. D., Baumann, D. C., Akhaphong, B., Abrenica, A. G., Miller, R. F., & Alejandro, E. U. (2016) · Islets · doi:10.1080/19382014.2016.1260797 · Cited by 37
Sirtuin 6, a possible therapeutic target for type 2 diabetes
Bae, E. J. (2017) · Archives of Pharmacal Research · doi:10.1007/s12272-017-0989-8 · Cited by 36
Single cell transcriptomic profiling of mouse pancreatic progenitors
Stanescu, D. E., Yu, R., Won, K., & Stoffers, D. A. (2016) · Physiological Genomics · doi:10.1152/physiolgenomics.00114.2016 · Cited by 35
δ-Cells: The Neighborhood Watch in the Islet Community
Gao, R., Yang, T., & Zhang, Q. (2021) · Biology · doi:10.3390/biology10020074 · Cited by 40
Horn, S., Kirkegaard, J. S., Hoelper, S., Seymour, P. A., Rescan, C., Nielsen, J. H., Madsen, O. D., Jensen, J. N., Krüger, M., Grønborg, M., et al. (2015) · Molecular Endocrinology · doi:10.1210/me.2015-1208 · Cited by 35
Lawlor, N. T., Youn, A., Kursawe, R., Ucar, D., & Stitzel, M. L. (2017) · Scientific Reports · doi:10.1038/s41598-017-12335-1 · Cited by 35
Atanes, P., Ruz‐Maldonado, I., Hawkes, R. G., Liu, B., Zhao, M., Huang, G. C., Al-Amily, I. M., Salehi, A. A., Amisten, S., & Persaud, S. J. (2018) · Cellular and Molecular Life Sciences · doi:10.1007/s00018-018-2778-z · Cited by 33
Liu, S., Promes, J. A., Harata, M., Mishra, A., Stephens, S. B., Taylor, E. B., Burand, A. J., Sivitz, W. I., Fink, B. D., Ankrum, J. A., et al. (2020) · Diabetes · doi:10.2337/db19-0951 · Cited by 33
Enteroviruses and T1D: Is It the Virus, the Genes or Both which Cause T1D
Geravandi, S., Liu, H., & Maedler, K. (2020) · Microorganisms · doi:10.3390/microorganisms8071017 · Cited by 33
IL-1beta promotes the age-associated decline of beta cell function
Böni‐Schnetzler, M., Méreau, H., Rachid, L., Wiedemann, S. J., Schulze, F., TRIMIGLIOZZI, K. A., Meier, D. T., & Donath, M. Y. (2021) · iScience · doi:10.1016/j.isci.2021.103250 · Cited by 35
Genetic Engineering of Immune Evasive Stem Cell-Derived Islets
Sackett, S. D., Kaplan, S. J., Mitchell, S. A., Brown, M. E., Burrack, A. L., Grey, S., Huangfu, D., & Odorico, J. (2022) · Transplant International · doi:10.3389/ti.2022.10817 · Cited by 32
Bosch, A. J. T., Keller, L., Steiger, L., Rohm, T. V., Wiedemann, S. J., Low, A. J. Y., Stawiski, M., Rachid, L., Roux, J., Konrad, D., et al. (2023) · Diabetologia · doi:10.1007/s00125-023-06007-1 · Cited by 31
Cane, M. C., Parrington, J., Rorsman, P., Galione, A., & Rutter, G. A. (2015) · Cell Calcium · doi:10.1016/j.ceca.2015.12.004 · Cited by 31
Serotonin competence of mouse beta cells during pregnancy
Goyvaerts, L., Schraenen, A., & Schuit, F. C. (2016) · Diabetologia · doi:10.1007/s00125-016-3951-2 · Cited by 33
β-Cell Inactivation of Gpr119 Unmasks Incretin Dependence of GPR119-Mediated Glucoregulation
Panaro, B. L., Flock, G. B., Campbell, J. E., Beaudry, J. L., Cao, X., & Drucker, D. J. (2017) · Diabetes · doi:10.2337/db17-0017 · Cited by 31
Metabolic regulation of glucagon secretion
Armour, S. L., Stanley, J. E., Cantley, J., Dean, E. D., & Knudsen, J. G. (2023) · Journal of Endocrinology · doi:10.1530/joe-23-0081 · Cited by 41
β‐cell differentiation status in type 2 diabetes
Jeffery, N. M., & Harries, L. W. (2016) · Diabetes Obesity and Metabolism · doi:10.1111/dom.12778 · Cited by 30
Cell Autonomous Dysfunction and Insulin Resistance in Pancreatic α Cells
Honzawa, N., Fujimoto, K., & Kitamura, T. (2019) · International Journal of Molecular Sciences · doi:10.3390/ijms20153699 · Cited by 29
Xie, L., Zhang, Z., Wang, Q., Chen, Y., Lu, D., & Wu, W. (2021) · Frontiers in Endocrinology · doi:10.3389/fendo.2021.772865 · Cited by 30
Acetyl-CoA-carboxylase 1 (ACC1) plays a critical role in glucagon secretion
Veprik, A., Denwood, G., Liu, D., Bakar, R. B., Morfin, V., McHugh, K., Tebeka, N. N., Vetterli, L., Yonova‐Doing, E., Gribble, F. M., et al. (2022) · Communications Biology · doi:10.1038/s42003-022-03170-w · Cited by 29
Georgiadou, E., Muralidharan, C., Irizarry, M. M. M., CHABOSSEAU, P. L., Akalestou, E., Tomás, A., Wern, F. Y. S., Stylianides, T., Wretlind, A., Legido‐Quigley, C., et al. (2022) · Diabetes · doi:10.2337/db21-0800 · Cited by 29
Innate immune priming of insulin secretion
Dalmas, É. (2018) · Current Opinion in Immunology · doi:10.1016/j.coi.2018.10.005 · Cited by 32
Role of innate immune cells in metabolism: from physiology to type 2 diabetes
Dalmas, É. (2019) · Seminars in Immunopathology · doi:10.1007/s00281-019-00736-5 · Cited by 28
Altered islet prohormone processing: a cause or consequence of diabetes?
Ramzy, A., & Kieffer, T. J. (2021) · Physiological Reviews · doi:10.1152/physrev.00008.2021 · Cited by 27
The Importance of REST for Development and Function of Beta Cells
Martin, D. J., & Grapin‐Botton, A. (2017) · Frontiers in Cell and Developmental Biology · doi:10.3389/fcell.2017.00012 · Cited by 27
Jeffery, N. M., Richardson, S. J., Chambers, D. J., Morgan, N. G., & Harries, L. W. (2019) · Human Molecular Genetics · doi:10.1093/hmg/ddz094 · Cited by 28
Nutrient regulation of the islet epigenome controls adaptive insulin secretion
Wortham, M., Liu, F., Harrington, A. R., Fleischman, J. Y., Wallace, M., Mulas, F., Mallick, M., Vinckier, N. K., Cross, B. R., Chiou, J., et al. (2023) · Journal of Clinical Investigation · doi:10.1172/jci165208 · Cited by 27
Self-citationThe long noncoding RNA MALAT1 predicts human islet isolation quality
Wong, W. K. M., Jiang, G., Sørensen, A. E., Chew, Y. V., Lee-Maynard, C., Liuwantara, D., Williams, L. J., O’Connell, P. J., Dalgaard, L. T., Ronald, C. W., et al. (2019) · JCI Insight · doi:10.1172/jci.insight.129299 · Cited by 25
Grotz, A. K., Abaitua, F., Navarro‐Guerrero, E., Hastoy, B., Ebner, D. V., & Gloyn, A. L. (2019) · Wellcome Open Research · doi:10.12688/wellcomeopenres.15447.2 · Cited by 27
Virgin β-Cells at the Neogenic Niche Proliferate Normally and Mature Slowly
Lee, S. C. L., Zhang, J., Saravanakumar, S., Flisher, M. F., Grimm, D. R., van der Meulen, T., & Huising, M. O. (2021) · Diabetes · doi:10.2337/db20-0679 · Cited by 23
Self-citationSingh, B., Khattab, F., Chae, H., Desmet, L., Herrera, P. L., & Gilon, P. (2021) · Molecular Metabolism · doi:10.1016/j.molmet.2021.101268 · Cited by 23
Dynamic Ins2 Gene Activity Defines β-Cell Maturity States
Chu, C. M. J., Modi, H., Ellis, C. E., Krentz, N. A. J., Skovsø, S., Zhao, Y., Cen, H. H., Noursadeghi, N., Panzhinskiy, E., Hu, X., et al. (2022) · Diabetes · doi:10.2337/db21-1065 · Cited by 22
Self-citationLeduc, M., Richard, J., Costes, S., Muller, D. S., Varrault, A., Compan, V., Mathieu, J., Tanti, J., Pagès, G., Pouysségur, J., et al. (2017) · Diabetologia · doi:10.1007/s00125-017-4356-6 · Cited by 24
Manialawy, Y. M., Khan, S. R., Bhattacharjee, A., & Wheeler, M. B. (2020) · Journal of Biological Chemistry · doi:10.1074/jbc.ra120.013277 · Cited by 22
Role of long non‐coding RNAs in the determination of β‐cell identity
Motterle, A., Sanchez‐Parra, C., & Regazzi, R. (2016) · Diabetes Obesity and Metabolism · doi:10.1111/dom.12714 · Cited by 23
Human Islet Microtissues as an In Vitro and an In Vivo Model System for Diabetes
Mir-Coll, J., Moede, T., Paschen, M., Neelakandhan, A., Valladolid‐Acebes, I., Leibiger, B., Biernath, A., Ämmälä, C., Leibiger, I. B., Yesildag, B., et al. (2021) · International Journal of Molecular Sciences · doi:10.3390/ijms22041813 · Cited by 21
Mehta, Z. B., Fine, N. H. F., Pullen, T. J., Cane, M. C., Hu, M., CHABOSSEAU, P. L., Meur, G., Velayos‐Baeza, A., Monaco, A. P., Marselli, L., et al. (2016) · American Journal of Physiology-Endocrinology and Metabolism · doi:10.1152/ajpendo.00074.2016 · Cited by 22
Farnsworth, N. L., Walter, R., Piscopio, R. A., Schleicher, W. E., & Benninger, R. K. P. (2018) · The Journal of Physiology · doi:10.1113/jp276106 · Cited by 25
Urocortin3: Local inducer of somatostatin release and bellwether of beta cell maturity
Flisher, M. F., Shin, D., & Huising, M. O. (2022) · Peptides · doi:10.1016/j.peptides.2022.170748 · Cited by 20
Self-citationHill, T. G., & Hill, D. J. (2024) · International Journal of Molecular Sciences · doi:10.3390/ijms25074070 · Cited by 21
Beta cell adaptation in pregnancy: a tribute to Claes Hellerström
Nielsen, J. H. (2016) · Upsala Journal of Medical Sciences · doi:10.3109/03009734.2016.1165776 · Cited by 21
Abarkan, M., Gaitan, J., Lebreton, F., Perrier, R., Jaffredo, M., Mulle, C., Magnan, C., Raoux, M., & Lang, J. (2019) · Molecular Metabolism · doi:10.1016/j.molmet.2019.09.011 · Cited by 20
Osteopontin activates the diabetes-associated potassium channel TALK-1 in pancreatic β-cells
Dickerson, M. T., Vierra, N. C., Milian, S. C., Dadi, P. K., & Jacobson, D. A. (2017) · PLoS ONE · doi:10.1371/journal.pone.0175069 · Cited by 20
Expression of GLP-1 receptors in insulin-containing interneurons of rat cerebral cortex
Csajbók, É., Kocsis, Á. K., Faragó, N., Furdan, S., Kovács, B., Lovas, S., Molnár, G., Likó, I., Zvara, Á., Puskás, L. G., et al. (2019) · Diabetologia · doi:10.1007/s00125-018-4803-z · Cited by 19
Gap junction coupling and islet delta-cell function in health and disease
MIRANDA, C. A., Samad, M., Vergari, E., & Briant, L. J. B. (2021) · Peptides · doi:10.1016/j.peptides.2021.170704 · Cited by 21
Mundinger, T. O., & Taborsky, G. J. (2016) · Diabetologia · doi:10.1007/s00125-016-4026-0 · Cited by 19
Insights from lncRNAs Profiling of MIN6 Beta Cells Undergoing Inflammation
Sun, C., Xue, L., Zhu, Z., Zhang, F., Yang, R., Yuan, X., Jia, Z., & Liu, Q. (2016) · Mediators of Inflammation · doi:10.1155/2016/9275106 · Cited by 18
The glucose-lowering effects of α-glucosidase inhibitor require a bile acid signal in mice
Qiu, Y., Shen, L., Fu, L., Yang, J., Cui, C., Li, T., Li, X., Fu, C., Gao, X., Wang, W., et al. (2020) · Diabetologia · doi:10.1007/s00125-020-05095-7 · Cited by 18
Large-Scale Functional Genomics Screen to Identify Modulators of Human β-Cell Insulin Secretion
Szczerbinska, I., Tessitore, A., Hansson, L., Agrawal, A., Lopez, A. R., Helenius, M., Malinowski, A. R., Gilboa, B., Ruby, M. A., Gupta, R., et al. (2022) · Biomedicines · doi:10.3390/biomedicines10010103 · Cited by 17
Zhang, Z., Gao, Y., & Meng, Z. (2022) · Journal of genetics and genomics/Journal of Genetics and Genomics · doi:10.1016/j.jgg.2022.03.002 · Cited by 16
Liu, Q., Aseer, K. R., Yao, Q., Zhong, X., Ghosh, P., O’Connell, J. F., & Egan, J. M. (2022) · Frontiers in Pharmacology · doi:10.3389/fphar.2021.809965 · Cited by 16
Roles of Noncoding RNAs in Islet Biology
Guay, C., Jacovetti, C., Bayazit, M. B., Brozzi, F., Rodriguez‐Trejo, A., Wu, K., & Regazzi, R. (2020) · Comprehensive physiology · doi:10.1002/cphy.c190032 · Cited by 16
Some mechanisms of inflammation development in type 2 diabetes mellitus
Бочкарева, Л. А., Недосугова, Л. В., Petunina, N. A., Эдуардовна, Т. М., & Валерьевна, Г. Е. (2021) · Diabetes Mellitus · doi:10.14341/dm12746 · Cited by 15
Grasso, P. (2022) · Frontiers in Aging Neuroscience · doi:10.3389/fnagi.2022.861350 · Cited by 15
RFX6 Maintains Gene Expression and Function of Adult Human Islet α-Cells
Coykendall, V. M. N., Qian, M. F., Tellez, K., Bautista, A., Bevacqua, R. J., Gu, X., Hang, Y., Neukam, M., Zhao, W., Chang, C., et al. (2023) · Diabetes · doi:10.2337/db23-0483 · Cited by 14
Recent progress in modeling and treating diabetes using stem cell-derived islets
Maestas, M. M., Bui, M. H., & Millman, J. R. (2024) · Stem Cells Translational Medicine · doi:10.1093/stcltm/szae059 · Cited by 14
Beta Cell Imaging—From Pre-Clinical Validation to First in Man Testing
Demine, S., Schulte, M. I., Territo, P. R., & Eizirik, D. L. (2020) · International Journal of Molecular Sciences · doi:10.3390/ijms21197274 · Cited by 15
Potential Therapeutic Targeting Neurotransmitter Receptors in Diabetes
Pan, X., Tao, S., & Tong, N. (2022) · Frontiers in Endocrinology · doi:10.3389/fendo.2022.884549 · Cited by 14
Mawla, A. M., van der Meulen, T., & Huising, M. O. (2023) · BMC Genomics · doi:10.1186/s12864-023-09293-6 · Cited by 14
Self-citationEfficient generation of pancreatic β-like cells from the mouse gallbladder
Wang, Y., Galivo, F., Pelz, C., Haft, A., Lee, J., Kim, S. K., & Grompe, M. (2016) · Stem Cell Research · doi:10.1016/j.scr.2016.10.009 · Cited by 14
Pappalardo, Z., Gambhir, D., Hennings, T. G., Richards, H. W., Choe, J., Yang, K. Y., Baeyens, L., Ang, K., Chen, S., Arkin, M. R., et al. (2017) · Diabetes · doi:10.2337/db16-0962 · Cited by 14
Prolactin and oleic acid synergistically stimulate β-cell proliferation and growth in rat islets
Brelje, T. C., Bhagroo, N. V., Stout, L. E., & Sorenson, R. L. (2017) · Islets · doi:10.1080/19382014.2017.1330234 · Cited by 14
Mousavy-Gharavy, S. N., Owen, B. M., Millership, S. J., CHABOSSEAU, P. L., Pizza, G., Martínez-Sánchez, A., Taşöz, E., Georgiadou, E., Hu, M., Fine, N. H. F., et al. (2021) · Diabetologia · doi:10.1007/s00125-020-05350-x · Cited by 16
Nguyen‐Tu, M., Harris, J. P., Martínez-Sánchez, A., CHABOSSEAU, P. L., Hu, M., Georgiadou, E., Pollard, A., Otero, P., López–Noriega, L., Leclerc, I., et al. (2022) · Diabetologia · doi:10.1007/s00125-022-05673-x · Cited by 13
Amino acids and the changing face of the α-cell
Hamilton, A., Eliasson, L., & Knudsen, J. G. (2023) · Peptides · doi:10.1016/j.peptides.2023.171039 · Cited by 14
Ali, Z., Chandrasekera, P. C., & Pippin, J. J. (2018) · Alternatives to Laboratory Animals · doi:10.1177/026119291804600101 · Cited by 13
Assessing Mouse Islet Function
Atanes, P., Ruz‐Maldonado, I., Olaniru, O. E., & Persaud, S. J. (2020) · Methods in molecular biology · doi:10.1007/978-1-0716-0385-7_17 · Cited by 13
Yang, Y. H. C., Wills, Q. F., & Johnson, J. D. (2015) · Diabetologia · doi:10.1007/s00125-015-3552-5 · Cited by 13
Perez‐Alcantara, M., Honoré, C., Wesolowska‐Andersen, A., Gloyn, A. L., McCarthy, M. I., Hansson, M. D., Beer, N. L., & van de Bunt, M. (2018) · Diabetologia · doi:10.1007/s00125-018-4612-4 · Cited by 14
Stathmin-2 Mediates Glucagon Secretion From Pancreatic α-Cells
Asadi, F., & Dhanvantari, S. (2020) · Frontiers in Endocrinology · doi:10.3389/fendo.2020.00029 · Cited by 15
Cha, J., Tong, X., Walker, E. M., Dahan, T., Cochrane, V. A., Ashe, S., Russell, R., Osipovich, A. B., Mawla, A. M., Guo, M. A., et al. (2023) · JCI Insight · doi:10.1172/jci.insight.166386 · Cited by 12
Self-citationA tumor-secreted protein utilizes glucagon release to cause host wasting
Ding, G., Li, Y., Chen, C., Tan, K., Deng, Y., Pang, H., Wang, Z., Dang, P., Wu, X., Rushworth, E., et al. (2025) · Cell Discovery · doi:10.1038/s41421-024-00762-0 · Cited by 12
UGGT1 retains proinsulin in the endoplasmic reticulum in an arginine dependent manner
Cho, J., Hiramoto, M., Masaike, Y., Sakamoto, S., Imai, Y., Imai, Y., Handa, H., & Imai, T. (2020) · Biochemical and Biophysical Research Communications · doi:10.1016/j.bbrc.2020.04.158 · Cited by 12
Aung, Z. K., Kokay, I. C., Grattan, D. R., & Ladyman, S. R. (2021) · Frontiers in Endocrinology · doi:10.3389/fendo.2021.765976 · Cited by 13
Pancreatic β-cell remodeling in health and aging: Lessons from rodents and humans
Darwish, R., Alcibahy, Y., Dhawan, S., Butler, A. E., & Moin, A. S. M. (2025) · Ageing Research Reviews · doi:10.1016/j.arr.2025.102815 · Cited by 11
Pavlíková, N., Šrámek, J., Němcová‐Fürstová, V., & Bajard, L. (2024) · Archives of Toxicology · doi:10.1007/s00204-024-03841-z · Cited by 10
Chang, Y.-H., Katoh, M., Abdellatif, A. M., Xiafukaiti, G., Ibrahim, E. A. E., Ojima, M., Mizuno, S., Kuno, A., & Takahashi, S. (2019) · EXPERIMENTAL ANIMALS · doi:10.1538/expanim.19-0105 · Cited by 10
Molecular Mechanisms of Nutrient-Mediated Regulation of MicroRNAs in Pancreatic β-cells
Sałówka, A., & Martínez-Sánchez, A. (2021) · Frontiers in Endocrinology · doi:10.3389/fendo.2021.704824 · Cited by 10
Global proteomics reveals insulin abundance as a marker of human islet homeostasis alterations
Mathisen, A. F., Abadpour, S., Legøy, T. A., Paulo, J. A., Ghila, L., Scholz, H., & Chera, S. (2023) · Acta Physiologica · doi:10.1111/apha.14037 · Cited by 10
Langlhofer, G., Kögel, A., & Schaefer, M. (2021) · Cell Calcium · doi:10.1016/j.ceca.2021.102469 · Cited by 11
G protein-coupled receptors as regulators of pancreatic islet functionality
Thor, D. (2022) · Biochimica et Biophysica Acta (BBA) - Molecular Cell Research · doi:10.1016/j.bbamcr.2022.119235 · Cited by 10
Lundsgaard, A., Giudice, R. D., Kanta, J. M., Larance, M., Armour, S. L., London, A., Richter, M. M., Andersen, N. R., Nicolaisen, T. S., Carl, C. S., et al. (2025) · Molecular Metabolism · doi:10.1016/j.molmet.2025.102119 · Cited by 9
Tang, Y., Chen, Y.-G., Huang, H., Li, S., Zuo, H., Chen, J., Li, L., Mao, R.-B., Lin, Y.-C.-D., & Huang, H. (2023) · Chinese Medicine · doi:10.1186/s13020-023-00768-y · Cited by 9
High-Resolution Recording of the Circadian Oscillator in Primary Mouse α- and β-Cell Culture
Petrenko, V., Gosmain, Y., & Dibner, C. (2017) · Frontiers in Endocrinology · doi:10.3389/fendo.2017.00068 · Cited by 9
Jeffery, N. M., Richardson, S. J., Beall, C., & Harries, L. W. (2017) · Experimental Cell Research · doi:10.1016/j.yexcr.2017.10.028 · Cited by 9
CAMSAP2 localizes to the Golgi in islet β-cells and facilitates Golgi-ER trafficking
Ho, K., Jayathilake, A., Yagan, M., Nour, A., Osipovich, A. B., Magnuson, M. A., Gu, G., & Kaverina, I. (2023) · iScience · doi:10.1016/j.isci.2023.105938 · Cited by 8
Opposing roles of the entero-pancreatic hormone urocortin-3 in glucose metabolism in rats
Grunddal, K. V., Trammell, S. A. J., Bæch‐Laursen, C., Andersen, D. B., Xu, S. F. S., Andersen, H., Gillum, M. P., Ghiasi, S. M., Novak, I., Tyrberg, B., et al. (2022) · Diabetologia · doi:10.1007/s00125-022-05675-9 · Cited by 8
Zhu, Y., Li, Y., Dai, C., Sun, L., You, L., De, W., Yuan, Q., Wang, N., & Chen, Y. (2018) · The International Journal of Biochemistry & Cell Biology · doi:10.1016/j.biocel.2018.09.004 · Cited by 8
Møldrup, A., Lindberg, M. N., Galsgaard, E. D., Henriksen, U. L., Dalgaard, L. T., & Nielsen, J. H. (2020) · Acta Physiologica · doi:10.1111/apha.13454 · Cited by 8
Aoyama, S., Nishida, Y., Fujitani, Y., Fukunaka, A., Miyatsuka, T., Suzuki, L., Himuro, M., Yoshimori, T., & Watada, H. (2020) · Endocrine Journal · doi:10.1507/endocrj.ej20-0326 · Cited by 8
Brandhorst, H., Brandhorst, D., Abraham, A., Acreman, S., Schive, S. W., Scholz, H., & Johnson, P. (2020) · Cell Transplantation · doi:10.1177/0963689720952332 · Cited by 8
Prolyl-4-hydroxylase 3 maintains β cell glucose metabolism during fatty acid excess in mice
Nasteska, D., Cuozzo, F., Viloria, K., Johnson, E. M., Thakker, A., Bakar, R. B., Westbrook, R. L., Barlow, J. P., Hoang, M., Joseph, J. W., et al. (2021) · JCI Insight · doi:10.1172/jci.insight.140288 · Cited by 8
Dynamic Ins2 gene activity defines β-cell maturity statesPreprint
Chu, C. M. J., Modi, H., Skovsø, S., Ellis, C., Krentz, N. A. J., Zhao, Y. B., Cen, H., Noursadeghi, N., Panzhinskiy, E., Hu, X., et al. (2019) · bioRxiv (Cold Spring Harbor Laboratory) · doi:10.1101/702589 · Cited by 8
Self-citationPedersen, S. S., Mets, R. D. M. D., de Melo, J. M. L., Irazoki, A., MacDonald, P. E., Prause, M. C. B., & Billestrup, N. (2025) · The FASEB Journal · doi:10.1096/fj.202403388r · Cited by 8
Metadata
- Authors
- Benner, C., van der Meulen, T., Cacéres, E., Tigyi, K., Donaldson, C. J., & Huising, M. O.
- Affiliations
- Salk Institute for Biological Studies (US)
- Corresponding author
- Huising, Mark O
- Venue
- BMC Genomics
- Published
- 2014-07-22
- Volume
- 15
- Issue
- 1
- Pages
- 620-620
- ISSN
- 1471-2164 (ISSN-L)
- PMC
- PMC4124169
- OpenAlex
- W2139458690
- Cited by
- 302
- References
- 76
- Citations by year
- 2026: 9 · 2025: 18 · 2024: 11 · 2023: 44 · 2022: 24 · 2021: 30 · 2020: 33 · 2019: 20 · 2018: 27 · 2017: 41 · 2016: 24 · 2015: 18 · 2014: 1
- FWCI
- 27.78
- Type
- journal article
- Language
- en
- Open access
- gold
- doi.org
- Licence
- cc-by
- Locations
- BMC Genomics (publishedVersion, cc-by)
- PubMed Central (publishedVersion, cc-by)
- PubMed (publishedVersion)
- eScholarship (California Digital Library) (submittedVersion)
- Funders
- Vanderbilt University
- National Institutes of Health (DK026741)
- National Institute of Diabetes and Digestive and Kidney Diseases (P01DK026741)
- Topics
- Health Sciences › Medicine › Endocrinology, Diabetes and Metabolism › Pancreatic function and diabetes
- Life Sciences › Biochemistry, Genetics and Molecular Biology › Genetics › Diabetes and associated disorders
- Life Sciences › Biochemistry, Genetics and Molecular Biology › Molecular Biology › Single-cell and spatial transcriptomics
- Keywords
- pancreatic beta cells, alpha cells, islet transcriptome, long non-coding RNA, species differences, human-mouse comparison, receptor repertoire, diabetes model, glucose homeostasis, insulin, glucagon
- MeSH terms
- Red Fluorescent Protein, Animals, Flow Cytometry, Glucagon, Humans, Luminescent Proteins, Receptors, Cell Surface, RNA, Transcription Factors, Gene Library, Sequence Analysis, RNA, Glucagon-Secreting Cells, Insulin-Secreting Cells, Mice, Transcriptome, RNA, Long Noncoding
About these checks
Registry, retraction, Cites and statistics results are computed, not judged, with one exception: a printed reference that no index lists is read once by a model before it counts as a citation error. Claims are extracted by a model and kept only when their quote appears verbatim in the text; each cited source is then checked, with a model’s help, for whether it says what the claim relies on. Those verdicts can be wrong — read the claim’s quote and the cited source before relying on one.
Statistics and arithmetic are recomputed, not judged.
Confidence bands are shown only for fields calibrated on our annotated test set. None is calibrated yet, so no band is shown.
What counts as a claim ›How we measure confidence ›How we check this ›
Are you an author, or do you see a problem with this page? Request a review
