

The DOI matches its Crossref record; 63 of the 63 references it cites were found in a registry or an index.
Duodenal and faecal microbiota of celiac children: molecular, phenotype and metabolome characterization
Open accessAbstract
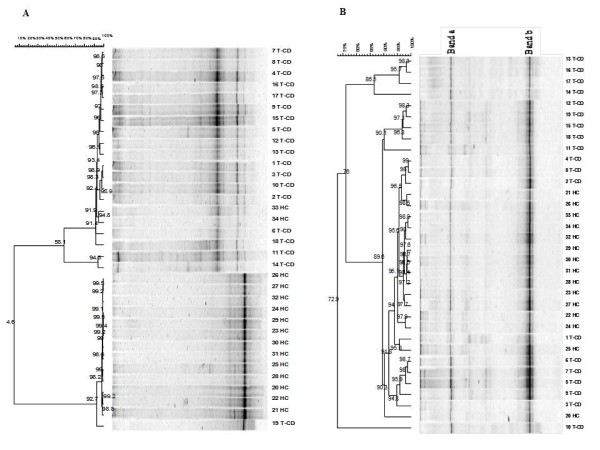
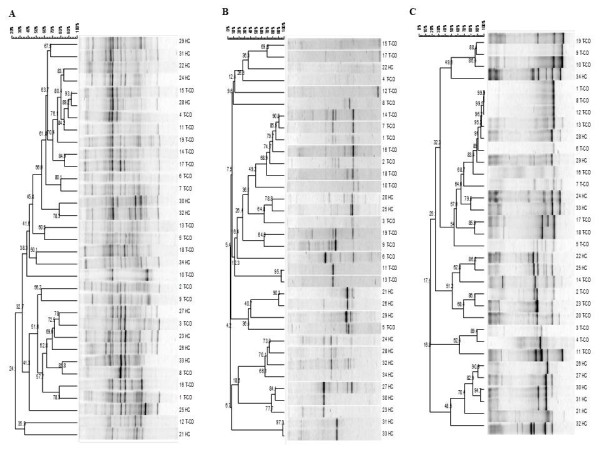
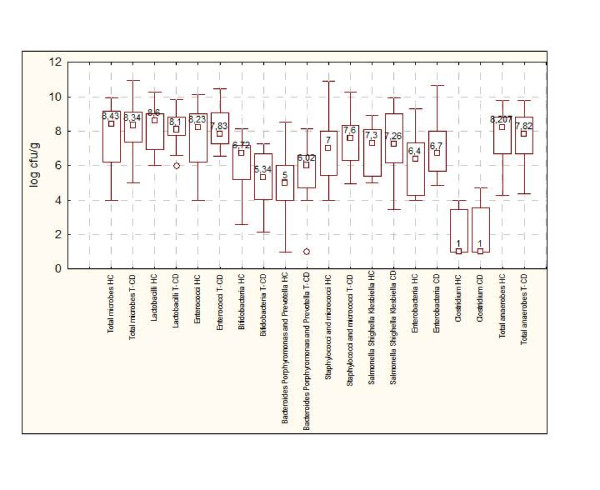
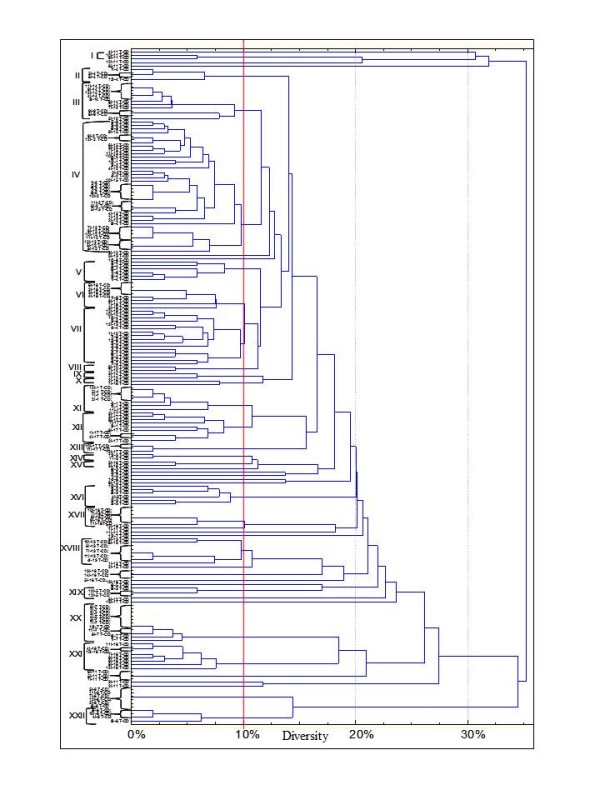
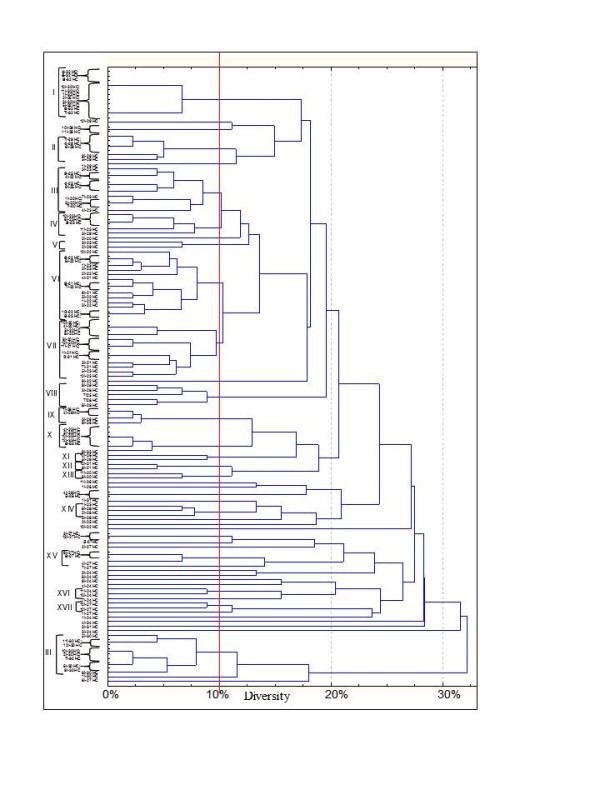
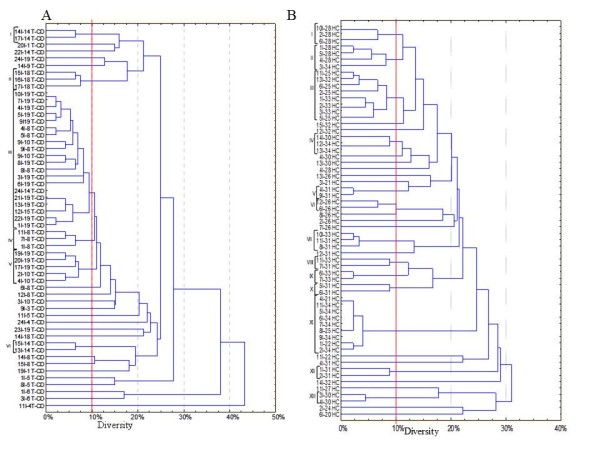
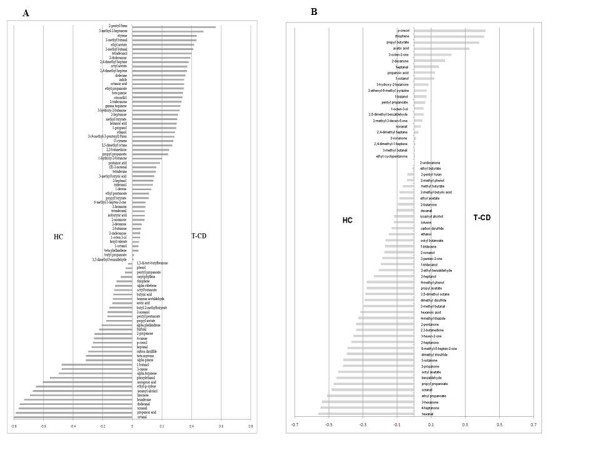
Background: Epidemiology of celiac disease (CD) is increasing. CD mainly presents in early childhood with small intestinal villous atrophy and signs of malabsorption. Compared to healthy individuals, CD patients seemed to be characterized by higher numbers of Gram-negative bacteria and lower numbers Gram-positive bacteria. Results: This study aimed at investigating the microbiota and metabolome of 19 celiac disease children under gluten-free diet (treated celiac disease, T-CD) and 15 non-celiac children (HC). PCR-denaturing gradient gel electrophoresis (DGGE) analyses by universal and group-specific primers were carried out in duodenal biopsies and faecal samples. Based on the number of PCR-DGGE bands, the diversity of Eubacteria was the higher in duodenal biopsies of T-CD than HC children. Bifidobacteria were only found in faecal samples. With a few exceptions, PCR-DGGE profiles of faecal samples for Lactobacillus and Bifidobacteria differed between T-CD and HC. As shown by culture-dependent methods, the levels of Lactobacillus , Enterococcus and Bifidobacteria were confirmed to be significantly higher ( P = 0.028; P = 0.019; and P = 0.023, respectively) in fecal samples of HC than in T-CD children. On the contrary, cell counts (CFU/ml) of presumptive Bacteroides , Staphylococcus , Salmonella , Shighella and Klebsiella were significantly higher ( P = 0.014) in T-CD compared to HC children. Enterococcus faecium and Lactobacillus plantarum were the species most diffusely identified. This latter species was also found in all duodenal biopsies of T-CD and HC children. Other bacterial species were identified only in T-CD or HC faecal samples. As shown by Randomly Amplified Polymorphic DNA-PCR analysis, the percentage of strains identified as lactobacilli significantly ( P = 0.011) differed between T-CD (ca. 26.5%) and HC (ca. 34.6%) groups. The metabolome of T-CD and HC children was studied using faecal and urine samples which were analyzed by gas-chromatography mass spectrometry-solid-phase microextraction and 1 H-Nuclear Magnetic Resonance. As shown by Canonical Discriminant Analysis of Principal Coordinates, the levels of volatile organic compounds and free amino acids in faecal and/or urine samples were markedly affected by CD. Conclusion: As shown by the parallel microbiology and metabolome approach, the gluten-free diet lasting at least two years did not completely restore the microbiota and, consequently, the metabolome of CD children. Some molecules (e.g., ethyl-acetate and octyl-acetate, some short chain fatty acids and free amino acids, and glutamine) seems to be metabolic signatures of CD.
Overview
The claims and statistics of this paper haven’t been checked yet.
Run the check — free, no account needed. It reads the open-access text and checks the sources it cites.
Integrity signals
Registry
Cites
Statistics
Figures
Verification
Claims the paper makes
The claims and statistics of this paper haven’t been checked yet.
Run the check — free, no account needed. It reads the open-access text and checks the sources it cites.
Claims other papers make about this one
Each is checked against this paper’s own text: does it say what the citing paper says it does?
In the citing paper
“Evidences on healthy subjects showed that gluten-free diet has been associated with the reduction of beneficial gut bacteria populations, the increase in opportunistic pathogens and with immune-suppressive effects [100,101,102].”
From Autism, Gastrointestinal Symptoms and Modulation of Gut Microbiota by Nutritional Interventions (2019) · cites this paper as [101]
Self-check
Percentages, sums and reported differences re-computed from the paper’s own numbers.
The self-check needs the paper’s full text.
Citations
Cites
Gentleman R: R: A language for data analysis and graphics
Ihaka, R., & Gentleman, R. (1996) · Journal of Computational and Graphical Statistics · doi:10.1080/10618600.1996.10474713 · Cited by 11,747
Muyzer, G., de Waal, E. C., & Uitterlinden, A. G. (1993) · Applied and Environmental Microbiology · doi:10.1128/aem.59.3.695-700.1993 · Cited by 11,490
Cani, P. D., Bibiloni, R., Knauf, C., Waget, A., Neyrinck, A. M., Delzenne, N. M., & Burcelin, R. (2008) · Diabetes · doi:10.2337/db07-1403 · Cited by 4,819
Molecular Microbial Ecology Manual
Microbioly, N. S. I. (1996) · Springer eBooks · doi:10.1007/978-94-009-0215-2 · Cited by 1,692
van Gelder, H. A. E. (1961) · Springer eBooks · doi:10.1007/978-94-011-9562-1_10 · Cited by 1,657
Mucosal flora in inflammatory bowel disease
Swidsinski, A. V., Ladhoff, A., Pernthaler, A., Swidsinski, S., Loening-Baucke, V. A., Ortner, M., Weber, J., Hoffmann, U., Schreiber, S., Dietel, M., et al. (2002) · Gastroenterology · doi:10.1053/gast.2002.30294 · Cited by 1,344
Dysbiosis of the faecal microbiota in patients with Crohn’s disease and their unaffected relatives
Joossens, M., Huys, G., Cnockaert, M., De Preter, V., Verbeke, K., Rutgeerts, P., Vandamme, P., & Vermeire, S. (2011) · Gut · doi:10.1136/gut.2010.223263 · Cited by 1,063
Sartor, R. B. (2004) · Gastroenterology · doi:10.1053/j.gastro.2004.03.024 · Cited by 1,053
Molecular Microbial Ecology Manual
Kowalchuk, G. A., de Bruijn, F. J., Head, I. M., Akkermans, A. D. L., & van, E. J. (2004) · Springer eBooks · doi:10.1007/978-1-4020-2177-0 · Cited by 808
Walter, J., Hertel, C., Tannock, G. W., Lis, C. M., Munro, K., & Hammes, W. P. (2001) · Applied and Environmental Microbiology · doi:10.1128/aem.67.6.2578-2585.2001 · Cited by 782
Cited by
Sorted by citations
The ecology of the microbiome: Networks, competition, and stability
Coyte, K. Z., Schlüter, J., & Foster, K. R. (2015) · Science · doi:10.1126/science.aad2602 · Cited by 2,812
Dysbiosis and the immune system
Levy, M., Kolodziejczyk, A. A., Thaiss, C. A., & Elinav, E. (2017) · Nature Reviews Immunology · doi:10.1038/nri.2017.7 · Cited by 1,769
De Angelis, M., Piccolo, M., Vannini, L., Siragusa, S., De Giacomo, A., Serrazzanetti, D. I., Cristofori, F., Guerzoni, M. E., Gobbetti, M., & Francavilla, R. (2013) · PLoS ONE · doi:10.1371/journal.pone.0076993 · Cited by 887
Self-citationDiet-Induced Dysbiosis of the Intestinal Microbiota and the Effects on Immunity and Disease
Brown, K., DeCoffe, D., Molcan, E., & Gibson, D. L. (2012) · Nutrients · doi:10.3390/nu4081095 · Cited by 700
Food Components and Dietary Habits: Keys for a Healthy Gut Microbiota Composition
Rinninella, E., Cintoni, M., Raoul, P. C., Lopetuso, L. R., Scaldaferri, F., Pulcini, G., Miggiano, G. A. D., Gasbarrini, A., & Mele, M. C. (2019) · Nutrients · doi:10.3390/nu11102393 · Cited by 707
Role of the intestinal microbiome in health and disease: from correlation to causation
de Vos, W. M., & de Vos, E. A. (2012) · Nutrition Reviews · doi:10.1111/j.1753-4887.2012.00505.x · Cited by 440
Gut Microbiota Profiling: Metabolomics Based Approach to Unravel Compounds Affecting Human Health
Vernocchi, P., Del Chierico, F., & Putignani, L. (2016) · Frontiers in Microbiology · doi:10.3389/fmicb.2016.01144 · Cited by 426
Self-citationGluten-Free Diet: Gaps and Needs for a Healthier Diet
Melini, V., & Melini, F. (2019) · Nutrients · doi:10.3390/nu11010170 · Cited by 412
Metabolomics toward personalized medicine
Jacob, M., Lopata, A. L., Dasouki, M., & Rahman, A. M. A. (2017) · Mass Spectrometry Reviews · doi:10.1002/mas.21548 · Cited by 422
Triggers and drivers of autoimmunity: lessons from coeliac disease
Sollid, L. M., & Jabrì, B. (2013) · Nature reviews. Immunology · doi:10.1038/nri3407 · Cited by 348
Impact of gastrointestinal physiology on drug absorption in special populations––An UNGAP review
Stillhart, C., Vučićević, K. M., Augustijns, P., Basit, A. W., Batchelor, H. K., Flanagan, T. R., Gesquiere, I., Greupink, R., Keszthelyi, D., Koskinen, M., et al. (2020) · European Journal of Pharmaceutical Sciences · doi:10.1016/j.ejps.2020.105280 · Cited by 343
A review on human fecal metabolomics: Methods, applications and the human fecal metabolome database
Karu, N., Deng, L., Slae, M., Guo, A. C., Sajed, T., Huynh, H. Q., Wine, E., & Wishart, D. S. (2018) · Analytica Chimica Acta · doi:10.1016/j.aca.2018.05.031 · Cited by 274
Novel players in coeliac disease pathogenesis: role of the gut microbiota
Verdu, E. F., Galipeau, H. J., & Jabrì, B. (2015) · Nature Reviews Gastroenterology & Hepatology · doi:10.1038/nrgastro.2015.90 · Cited by 251
Microbiota and Metabolome Associated with Immunoglobulin A Nephropathy (IgAN)
Angelis, M. D., Montemurno, E., Píccolo, M. C., Vannini, L., Lauriero, G., Maranzano, V., Gozzi, G., Serrazanetti, D. I., Dalfino, G., Gobbetti, M., et al. (2014) · PLoS ONE · doi:10.1371/journal.pone.0099006 · Cited by 244
Self-citationAutism, Gastrointestinal Symptoms and Modulation of Gut Microbiota by Nutritional Interventions
Ristori, M. V., Quagliariello, A., Reddel, S., Ianiro, G., Vicari, S., Gasbarrini, A., & Putignani, L. (2019) · Nutrients · doi:10.3390/nu11112812 · Cited by 214
Does the microbiota play a role in the pathogenesis of autoimmune diseases?
McLean, M. H., Dieguez, D., Miller, L. M., & Young, H. A. (2014) · Gut · doi:10.1136/gutjnl-2014-308514 · Cited by 214
Vonaesch, P., Morien, E., Andrianonimiadana, L., Sanke‐Waîgana, H., Mbecko, J., Huus, K. E., Naharimanananirina, T., Gondje, B. P., Nigatoloum, S. N., Vondo, S. S., et al. (2018) · Proceedings of the National Academy of Sciences · doi:10.1073/pnas.1806573115 · Cited by 201
Intestinal Microbiota and Celiac Disease: Cause, Consequence or Co-Evolution?
Cénit, M. C., Olivares, M., Codoñer‐Franch, P., & Sanz, Y. (2015) · Nutrients · doi:10.3390/nu7085314 · Cited by 189
Glyphosate, pathways to modern diseases II: Celiac sprue and gluten intolerance
Samsel, A., & Seneff, S. (2013) · Interdisciplinary Toxicology · doi:10.2478/intox-2013-0026 · Cited by 177
The Oral Microbiome of Children: Development, Disease, and Implications Beyond Oral Health
Gomez, A., & Nelson, K. E. (2017) · Microbial Ecology · doi:10.1007/s00248-016-0854-1 · Cited by 175
Pathogenic role of the gut microbiota in gastrointestinal diseases
Nagao‐Kitamoto, H., Kitamoto, S., Kuffa, P., & Kamada, N. (2016) · Intestinal Research · doi:10.5217/ir.2016.14.2.127 · Cited by 178
Wilson, A. D. (2018) · Sensors · doi:10.3390/s18082613 · Cited by 174
Duodenal-Mucosal Bacteria Associated with Celiac Disease in Children
Sánchez, E., Donat, E., Ribes-Koninckx, C., Fernández-Murga, M. L., & Sanz, Y. (2013) · Applied and Environmental Microbiology · doi:10.1128/aem.00869-13 · Cited by 171
Nistal, E., Caminero, A., Vivas, S., Morales, J., de Miera, L. E. S., Rodríguez-Aparicio, L. B., & Casqueiro, J. (2012) · Biochimie · doi:10.1016/j.biochi.2012.03.025 · Cited by 175
Gut Microbiota and Celiac Disease
Marasco, G., Biase, A. R. D., Schiumerini, R., Eusebi, L. H., Iughetti, L., Ravaioli, F., Scaioli, E., Colecchia, A., & Festi, D. (2016) · Digestive Diseases and Sciences · doi:10.1007/s10620-015-4020-2 · Cited by 176
Smecuol, E., Hwang, H. J., Sugai, E., Corso, L., Cherñavsky, A. C., Bellavite, F. P., Gonzalez, A. F., Vodánovich, F., Moreno, M. L., Vázquez, H., et al. (2013) · Journal of Clinical Gastroenterology · doi:10.1097/mcg.0b013e31827759ac · Cited by 166
Analysis of short-chain fatty acids in human feces: A scoping review
Primec, M., Mičetić‐Turk, D., & Langerholc, T. (2017) · Analytical Biochemistry · doi:10.1016/j.ab.2017.03.007 · Cited by 171
Leonard, M. M., Valitutti, F., Karathia, H., Pujolassos, M., Kenyon, V., Fanelli, B., Troisi, J., Subramanian, P., Camhi, S., Colucci, A., et al. (2021) · Proceedings of the National Academy of Sciences · doi:10.1073/pnas.2020322118 · Cited by 162
Self-citationNew perspectives on probiotics in health and disease
Daliri, E. B., & Lee, B. H. (2015) · Food Science and Human Wellness · doi:10.1016/j.fshw.2015.06.002 · Cited by 158
Challenges of metabolomics in human gut microbiota research
Smirnov, K. S., Maier, T. V., Walker, A., Heinzmann, S. S., Forcisi, S., Martínez, I., Walter, J., & Schmitt‐Kopplin, P. (2016) · International Journal of Medical Microbiology · doi:10.1016/j.ijmm.2016.03.006 · Cited by 163
Pathophysiology of Celiac Disease
Kupfer, S. S., & Jabrì, B. (2012) · Gastrointestinal Endoscopy Clinics of North America · doi:10.1016/j.giec.2012.07.003 · Cited by 157
Pellegrini, S., Sordi, V., Bolla, A. M., Saita, D., Ferrarese, R., Canducci, F., Clementi, M., Invernizzi, F., Mariani, A., Bonfanti, R., et al. (2017) · The Journal of Clinical Endocrinology & Metabolism · doi:10.1210/jc.2016-3222 · Cited by 153
Francavilla, R., Píccolo, M. C., Francavilla, A., Polimeno, L., Semeraro, F., Cristofori, F., Castellaneta, S. P., Barone, M., Indrio, F., Gobbetti, M., et al. (2018) · Journal of Clinical Gastroenterology · doi:10.1097/mcg.0000000000001023 · Cited by 155
Self-citationD’Argenio, V., Casaburi, G., Precone, V., Pagliuca, C., Colicchio, R., Sarnataro, D., Discepolo, V., Kim, S. M., Russo, I., Blanco, G. D. V., et al. (2016) · The American Journal of Gastroenterology · doi:10.1038/ajg.2016.95 · Cited by 154
Klemenak, M., Dolinšek, J., Langerholc, T., Gioia, D. D., & Mičetić‐Turk, D. (2015) · Digestive Diseases and Sciences · doi:10.1007/s10620-015-3769-7 · Cited by 150
Shahbazkhani, B., Sadeghi, A., Malekzadeh, R., Khatavi, F., Etemadi, M., Kalantri, E., Rostami‐Nejad, M., & Rostami, K. (2015) · Nutrients · doi:10.3390/nu7064542 · Cited by 149
The Gut Microbiota in Celiac Disease and probiotics
Chibbar, R., & Dieleman, L. A. (2019) · Nutrients · doi:10.3390/nu11102375 · Cited by 146
Li, G., Yang, M. J., Zhou, K., Zhang, L., Tian, L., Lv, S., Jin, Y. T., Qian, W., Xiong, H., Lin, R., et al. (2015) · Journal of Microbiology and Biotechnology · doi:10.4014/jmb.1412.12047 · Cited by 146
Tovaglieri, A., Sontheimer-Phelps, A., Geirnaert, A., Prantil‐Baun, R., Camacho, D. M., Chou, D. B., Jalili‐Firoozinezhad, S., de Wouters, T., Kasendra, M. J., Super, M., et al. (2019) · Microbiome · doi:10.1186/s40168-019-0650-5 · Cited by 140
Davoren, M. J., & Schiestl, R. H. (2018) · Carcinogenesis · doi:10.1093/carcin/bgy105 · Cited by 144
Persisting changes of intestinal microbiota after bowel lavage and colonoscopy
Drago, L., Toscano, M., Grandi, R. D., Casini, V., & Pace, F. (2016) · European Journal of Gastroenterology & Hepatology · doi:10.1097/meg.0000000000000581 · Cited by 135
Quagliariello, A., Aloisio, I., Cionci, N. B., Luiselli, D., D’Auria, G., Martinez-Priego, L., Pérez-Villaroya, D., Langerholc, T., Primec, M., Mičetić‐Turk, D., et al. (2016) · Nutrients · doi:10.3390/nu8100660 · Cited by 130
Higher Prevalence and Abundance of Bdellovibrio bacteriovorus in the Human Gut of Healthy Subjects
Iebba, V., Santangelo, F., Totino, V., Nicoletti, M., Gagliardi, A., Biase, R. V. D., Cucchiara, S., Nencioni, L., Conte, M. P., & Schippa, S. (2013) · PLoS ONE · doi:10.1371/journal.pone.0061608 · Cited by 122
Short chain fatty acids, a possible treatment option for autoimmune diseases
Golpour, F., Abbasi-Alaei, M., Babaei, F., Mirzababaei, M., Parvardeh, S., Mohammadi, G., & Nassiri‐Asl, M. (2023) · Biomedicine & Pharmacotherapy · doi:10.1016/j.biopha.2023.114763 · Cited by 123
Nishitsuji, K., Xiao, J., Nagatomo, R., Umemoto, H., Morimoto, Y., Akatsu, H., Inoue, K., & Tsuneyama, K. (2017) · Scientific Reports · doi:10.1038/s41598-017-16189-5 · Cited by 121
Vernocchi, P., CHIERICO, F. D., Russo, A., Majo, F., Rossitto, M., Valerio, M., Casadei, L., Storia, A. L., Filippis, F. D., Rizzo, C., et al. (2018) · PLoS ONE · doi:10.1371/journal.pone.0208171 · Cited by 119
Self-citationMapping of Immune-Mediated Disease Genes
Ricaño-Ponce, I., & Wijmenga, C. (2013) · Annual Review of Genomics and Human Genetics · doi:10.1146/annurev-genom-091212-153450 · Cited by 121
Intestinal Microbiota and Probiotics in Celiac Disease
Moraes, L. F. D. S., Grześkowiak, Ł., Teixeira, T. F. S., & Pelúzio, M. D. C. G. (2014) · Clinical Microbiology Reviews · doi:10.1128/cmr.00106-13 · Cited by 116
Primec, M., Klemenak, M., Gioia, D. D., Aloisio, I., Cionci, N. B., Quagliariello, A., Gorenjak, M., Mičetić‐Turk, D., & Langerholc, T. (2018) · Clinical Nutrition · doi:10.1016/j.clnu.2018.06.931 · Cited by 116
Implications of Diet and The Gut Microbiome in Neuroinflammatory and Neurodegenerative Diseases
Hirschberg, S., Gisevius, B., Duscha, A., & Haghikia, A. (2019) · International Journal of Molecular Sciences · doi:10.3390/ijms20123109 · Cited by 120
Probiotics for inflammatory bowel diseases: a promising adjuvant treatment
Coqueiro, A. Y., Raizel, R., Bonvini, A., Tirapegui, J., & Rogero, M. M. (2018) · International Journal of Food Sciences and Nutrition · doi:10.1080/09637486.2018.1477123 · Cited by 114
A microbiota-centric view of diseases of the upper gastrointestinal tract
Nardone, G., Compare, D., & Rocco, A. (2017) · The Lancet. Gastroenterology & hepatology · doi:10.1016/s2468-1253(16)30108-x · Cited by 114
Salivary Microbiota and Metabolome Associated with Celiac Disease
Francavilla, R., Ercolini, D., Piccolo, M., Vannini, L., Siragusa, S., De Filippis, F., De Pasquale, I., Di Cagno, R., Di Toma, M., Gozzi, G., et al. (2014) · Applied and Environmental Microbiology · doi:10.1128/aem.00362-14 · Cited by 111
Self-citationAntibiotics in the pathogenesis of diabetes and inflammatory diseases of the gastrointestinal tract
Fenneman, A. C., Weidner, M., Chen, L. A., Nieuwdorp, M., & Blaser, M. J. (2022) · Nature Reviews Gastroenterology & Hepatology · doi:10.1038/s41575-022-00685-9 · Cited by 112
Reddel, S., Putignani, L., & Del Chierico, F. (2019) · Nutrients · doi:10.3390/nu11020373 · Cited by 104
Walker, M. M., & Talley, N. J. (2014) · Alimentary Pharmacology & Therapeutics · doi:10.1111/apt.12666 · Cited by 103
Small intestinal bacterial overgrowth
Quigley, E. M. M. (2014) · Current Opinion in Gastroenterology · doi:10.1097/mog.0000000000000040 · Cited by 96
The Gut Microbiome Feelings of the Brain: A Perspective for Non-Microbiologists
Lerner, A., Neidhöfer, S., & Matthias, T. (2017) · Microorganisms · doi:10.3390/microorganisms5040066 · Cited by 97
Marasco, G., Cirota, G. G., Rossini, B., Lungaro, L., Biase, A. R. D., Colecchia, A., Volta, U., GIORGIO, R. D., Festi, D., & Caio, G. (2020) · Nutrients · doi:10.3390/nu12092674 · Cited by 98
Role of microbiota short-chain fatty acids in the pathogenesis of autoimmune diseases
Rasouli‐Saravani, A., Jahankhani, K., Moradi, S., Gorgani, M., Shafaghat, Z., Mirsanei, Z., Mehmandar‐Oskuie, A., & Mirzaei, R. (2023) · Biomedicine & Pharmacotherapy · doi:10.1016/j.biopha.2023.114620 · Cited by 98
Akobeng, A. K., Singh, P., Kumar, M., & Khodor, S. A. (2020) · European Journal of Nutrition · doi:10.1007/s00394-020-02324-y · Cited by 96
Exploring the influence of the gut microbiota and probiotics on health: a symposium report
Thomas, L. V., Ockhuizen, T., & Suzuki, K. (2014) · British Journal Of Nutrition · doi:10.1017/s0007114514001275 · Cited by 93
Herrán, A. R., Pérez-Andrés, J., Caminero, A., Nistal, E., Vivas, S., de Morales, J. M. R., & Casqueiro, J. (2017) · Research in Microbiology · doi:10.1016/j.resmic.2017.04.008 · Cited by 90
Upper gastrointestinal microbiota and digestive diseases
Wang, Z.-K. (2013) · World Journal of Gastroenterology · doi:10.3748/wjg.v19.i10.1541 · Cited by 90
Giacomin, P., Zakrzewski, M., Jenkins, T. P., Su, X., Al-Hallaf, R., Croese, J., de Vries, S., Grant, A. J., Mitreva, M., Loukas, A. C., et al. (2016) · Scientific Reports · doi:10.1038/srep36797 · Cited by 88
Gut Microbiota in Celiac Disease: Is There Any Role for Probiotics?
Pecora, F., Persico, F., Gismondi, P., Fornaroli, F., Iuliano, S., de’Angelis, G. L., & Esposito, S. (2020) · Frontiers in Immunology · doi:10.3389/fimmu.2020.00957 · Cited by 88
Gastrointestinal microbiome and gluten in celiac disease
Wu, X., Lin, Q., Liu, K., Wu, J., & Shan, Z.-W. (2021) · Annals of Medicine · doi:10.1080/07853890.2021.1990392 · Cited by 90
Variation of the microbiota and metabolome along the canine gastrointestinal tract
Honneffer, J. B., Steiner, J. M., Lidbury, J. A., & Suchodolski, J. S. (2017) · Metabolomics · doi:10.1007/s11306-017-1165-3 · Cited by 100
Aguayo-Patrón, S., & de la Barca, A. M. C. (2017) · Foods · doi:10.3390/foods6110100 · Cited by 88
Drabińska, N., Jarocka‐Cyrta, E., Markiewicz, L. H., & Krupa‐Kozak, U. (2018) · Nutrients · doi:10.3390/nu10020201 · Cited by 82
Celiac Disease and Neurological Manifestations: From Gluten to Neuroinflammation
Giuffrè, M., Gazzin, S., Zoratti, C., Llido, J. P., Lanza, G., Tiribelli, C., & Moretti, R. (2022) · International Journal of Molecular Sciences · doi:10.3390/ijms232415564 · Cited by 85
Bacterially mediated drug delivery and therapeutics: Strategies and advancements
Wu, L., Bao, F., Li, L., Yin, X., & Hua, Z. (2022) · Advanced Drug Delivery Reviews · doi:10.1016/j.addr.2022.114363 · Cited by 80
Bones of Contention: Bone Mineral Density Recovery in Celiac Disease—A Systematic Review
Grace-Farfaglia, P. (2015) · Nutrients · doi:10.3390/nu7053347 · Cited by 82
Zafeiropoulou, K., Nichols, B., Mackinder, M., Biskou, O., Rizou, E., Karanikolou, A., Clark, C., Buchanan, E., Cardigan, T., Duncan, H., et al. (2020) · Gastroenterology · doi:10.1053/j.gastro.2020.08.007 · Cited by 81
Nistal, E., Caminero, A., Herrán, A. R., Pérez-Andrés, J., Vivas, S., Morales, J., de Miera, L. E. S., & Casqueiro, J. (2016) · Journal of Applied Microbiology · doi:10.1111/jam.13111 · Cited by 80
Cristofori, F., Indrio, F., Miniello, V. L., Angelis, M. D., & Francavilla, R. (2018) · Nutrients · doi:10.3390/nu10121824 · Cited by 82
Self-citationCarey, J. N., Mettert, E. L., Roggiani, M., Myers, K. S., Kiley, P. J., & Goulian, M. (2018) · Cell · doi:10.1016/j.cell.2018.02.005 · Cited by 80
Chander, A. M., Yadav, H., Jain, S., Bhadada, S. K., & Dhawan, D. K. (2018) · Frontiers in Microbiology · doi:10.3389/fmicb.2018.02597 · Cited by 74
Innate immunity: Actuating the gears of celiac disease pathogenesis
Kim, S. M., Mayassi, T., & Jabrì, B. (2015) · Best Practice & Research Clinical Gastroenterology · doi:10.1016/j.bpg.2015.05.001 · Cited by 75
Verdu, E. F., & Schuppan, D. (2021) · Gastroenterology · doi:10.1053/j.gastro.2021.08.016 · Cited by 78
The diagnostic and prognostic potential of gut bacteria in inflammatory bowel disease
Ocansey, D. K. W., Hang, S., Yuan, X., Qian, H., Zhou, M., Olovo, C. V., Zhang, X., & Mao, F. (2023) · Gut Microbes · doi:10.1080/19490976.2023.2176118 · Cited by 71
Dysbiosis a risk factor for celiac disease
Girbovan, A. H., Sur, G., Samaşcă, G., & Lupan, I. (2017) · Medical Microbiology and Immunology · doi:10.1007/s00430-017-0496-z · Cited by 71
Sroka-Oleksiak, A., Młodzińska, A., Bulanda, M., Salamon, D., Major, P., Stanek, M., & Gosiewski, T. (2020) · Journal of Clinical Medicine · doi:10.3390/jcm9020369 · Cited by 70
On the Etiology of Type 1 Diabetes
Korsgren, S., Molin, Y., Salmela, K. T., Lundgren, T., Melhus, Å., & Korsgren, O. (2012) · American Journal Of Pathology · doi:10.1016/j.ajpath.2012.07.022 · Cited by 71
de Meij, T. G. J., Budding, A. E., Grasman, M. E., Kneepkens, C. M. F., Savelkoul, P. H. M., & Mearin, M. L. (2013) · Scandinavian Journal of Gastroenterology · doi:10.3109/00365521.2013.775666 · Cited by 67
The human microbiome and metabolomics: Current concepts and applications
Daliri, E. B., Wei, S., Oh, D., & Lee, B. H. (2016) · Critical Reviews in Food Science and Nutrition · doi:10.1080/10408398.2016.1220913 · Cited by 66
Sanz, Y. (2015) · Annals of Nutrition and Metabolism · doi:10.1159/000440991 · Cited by 62
CHIERICO, F. D., Vernocchi, P., Bonizzi, L., Carsetti, R., Castellazzi, A. M., Dallapiccola, B., de Vos, W. M., Guerzoni, M. E., Manco, M., Marseglia, G. L., et al. (2012) · Journal of Proteomics · doi:10.1016/j.jprot.2012.02.018 · Cited by 64
Self-citationNavigating the Gluten-Free Boom: The Dark Side of Gluten Free Diet
Lerner, A., O'Bryan, T., & Matthias, T. (2019) · Frontiers in Pediatrics · doi:10.3389/fped.2019.00414 · Cited by 61
Baldi, S., Menicatti, M., Nannini, G., Niccolai, E., Russo, E., Ricci, F., Pallecchi, M., Romano, F., Pedone, M., Poli, G., et al. (2021) · Nutrients · doi:10.3390/nu13030742 · Cited by 62
Volatile Organic Compounds as Novel Markers for the Detection of Bacterial Infections
Zhang, L. (2014) · Clinical Microbiology Open Access · doi:10.4172/2327-5073.1000151 · Cited by 62
Intestinal microbiota during early life – impact on health and disease
Nylund, L., Satokari, R. M., Salminen, S., & de Vos, W. M. (2014) · Proceedings of The Nutrition Society · doi:10.1017/s0029665114000627 · Cited by 60
Tian, N., Faller, L. L., Leffler, D. A., Kelly, C. P., Hansen, J., Bosch, J. A., Wei, G., Paster, B. J., Schuppan, D., & Helmerhorst, E. J. (2017) · Applied and Environmental Microbiology · doi:10.1128/aem.03330-16 · Cited by 58
Opportunities and challenges for gut microbiome studies in the Indian population
Shetty, S. A., Marathe, N. P., & Shouche, Y. S. (2013) · Microbiome · doi:10.1186/2049-2618-1-24 · Cited by 57
Haque, S. Z., & Haque, M. (2017) · Clinical and Experimental Gastroenterology · doi:10.2147/ceg.s126243 · Cited by 62
Gwilt, K. B., González-Dávila, P., Olliffe, N., Oller, H. R., Hoffing, R. A., Puzan, M. L., Aidy, S. E., & Miller, G. M. (2019) · Cellular and Molecular Neurobiology · doi:10.1007/s10571-019-00772-7 · Cited by 57
The Role of Environmental Factors in the Development of Celiac Disease: What Is New?
Lionetti, E., & Catassi, C. (2015) · Diseases · doi:10.3390/diseases3040282 · Cited by 53
Multidimensional Disadvantages of a Gluten-Free Diet in Celiac Disease: A Narrative Review
Marciniak, M., Szymczak‐Tomczak, A., Mahadea, D., Eder, P., Dobrowolska, A., & Krela‐Kaźmierczak, I. (2021) · Nutrients · doi:10.3390/nu13020643 · Cited by 55
The progression of coeliac disease: its neurological and psychiatric implications
Campagna, G., Pesce, M., Tatangelo, R., Rizzuto, A., Fratta, I. L., & Grilli, A. (2016) · Nutrition Research Reviews · doi:10.1017/s0954422416000214 · Cited by 50
Douny, C., Dufourny, S., Brose, F., Verachtert, P., Rondia, P., Lebrun, S., Marzorati, M., Everaert, N., Delcenserie, V., & Scippo, M. (2019) · Journal of Chromatography B · doi:10.1016/j.jchromb.2019.06.013 · Cited by 49
Metadata
- Authors
- Di Cagno, R., De Angelis, M., De Pasquale, I., Ndagijimana, M., Vernocchi, P., Ricciuti, P., Gagliardi, F., Laghi, L., Crecchio, C., Guerzoni, M. E., Gobbetti, M., & Francavilla, R.
- Affiliations
- University of Bologna (IT)
- University of Bari Aldo Moro (IT)
- ORCID
- Venue
- BMC Microbiology
- Published
- 2011-10-04
- Volume
- 11
- Issue
- 1
- Pages
- 219-219
- ISSN
- 1471-2180 (ISSN-L)
- PMC
- PMC3206437
- OpenAlex
- W2048710178
- Cited by
- 317
- References
- 63
- Citations by year
- 2026: 15 · 2025: 19 · 2024: 11 · 2023: 20 · 2022: 24 · 2021: 29 · 2020: 20 · 2019: 28 · 2018: 23 · 2017: 21 · 2016: 31 · 2015: 25 · 2014: 21 · 2013: 19 · 2012: 10
- FWCI
- 6.50
- Type
- journal article
- Language
- en
- Open access
- gold
- doi.org
- Licence
- cc-by
- Locations
- BMC Microbiology (publishedVersion, cc-by)
- Europe PMC (PubMed Central) (publishedVersion, cc-by)
- PubMed Central (publishedVersion, cc-by)
- PubMed (publishedVersion)
- Archivio istituzionale della ricerca (Alma Mater Studiorum Università di Bologna) (submittedVersion, cc-by)
- DOAJ (DOAJ: Directory of Open Access Journals) (submittedVersion, cc-by-sa)
- Open Research (University of Surrey) (submittedVersion)
- Topics
- Life Sciences › Biochemistry, Genetics and Molecular Biology › Molecular Biology › Gut microbiota and health
- Health Sciences › Medicine › Gastroenterology › Celiac Disease Research and Management
- Life Sciences › Agricultural and Biological Sciences › Food Science › Probiotics and Fermented Foods
- Keywords
- celiac disease, pediatric celiac disease, duodenal microbiota, fecal microbiota, gluten-free diet, Lactobacillus, Bifidobacterium, Enterococcus faecium, Lactobacillus plantarum, gut metabolome, urinary metabolites, fecal metabolites, bacterial diversity, Enterobacteriaceae, small intestinal villous atrophy
- MeSH terms
- Bacteria, Celiac Disease, Child, Child, Preschool, Duodenum, Feces, Female, Humans, Male, Phenotype, Phylogeny, Urine, Case-Control Studies, Metagenome, Metabolome, Volatile Organic Compounds
About these checks
Registry, retraction, Cites and statistics results are computed, not judged, with one exception: a printed reference that no index lists is read once by a model before it counts as a citation error. Claims are extracted by a model and kept only when their quote appears verbatim in the text; each cited source is then checked, with a model’s help, for whether it says what the claim relies on. Those verdicts can be wrong — read the claim’s quote and the cited source before relying on one.
Statistics and arithmetic are recomputed, not judged.
Confidence bands are shown only for fields calibrated on our annotated test set. None is calibrated yet, so no band is shown.
What counts as a claim ›How we measure confidence ›How we check this ›
Are you an author, or do you see a problem with this page? Request a review
