

The DOI matches its Crossref record; 72 of the 72 references it cites were found in a registry or an index.
Duodenal microbiota composition and mucosal homeostasis in pediatric celiac disease
Open accessAbstract
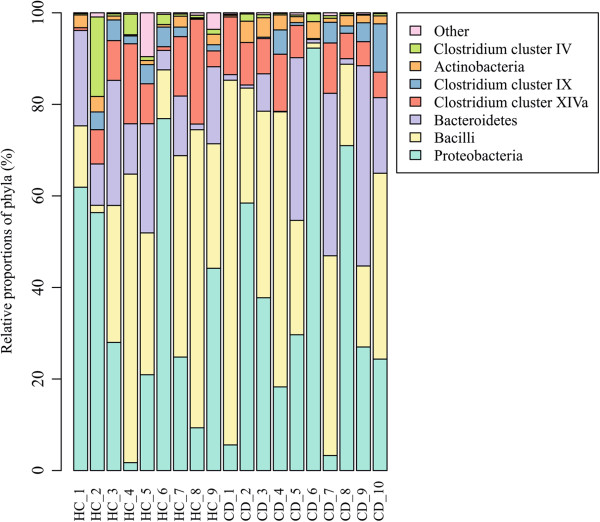
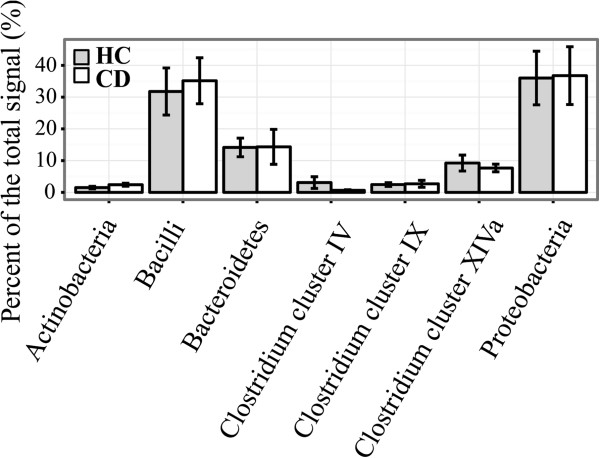
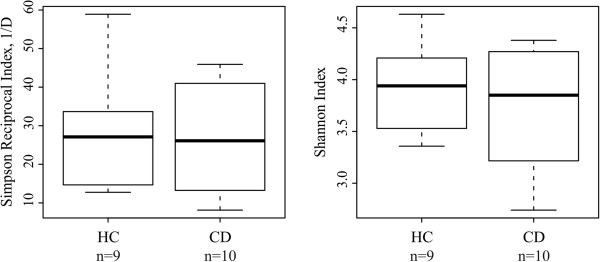
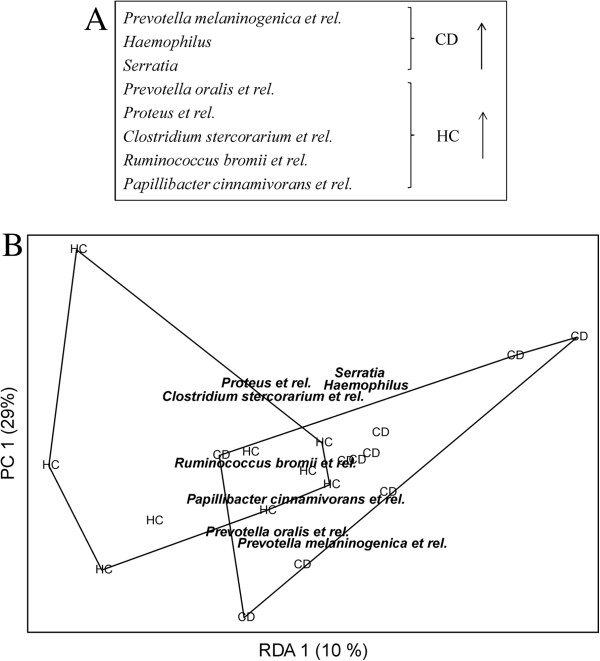
Background: Celiac disease (CD) is an autoimmune disorder of the small intestine which is triggered by dietary gluten in genetically predisposed (HLA-DQ2/DQ8 positive) individuals. Only a fraction of HLA-DQ2/DQ8 positive individuals develop CD indicating that other factors have a role in the disorder. Several studies have addressed intestinal microbiota aberrancies in pediatric CD, but the results are inconsistent. Previously, we demonstrated that pediatric CD patients have lower duodenal expression of TLR2 and higher expression of TLR9 as compared to healthy controls (HC) indicating that microbiota may have a role in CD. Methods: We used bacterial phylogenetic microarray to comprehensively profile the microbiota in duodenal biopsies of CD (n = 10) and HC (n = 9) children. The expression of selected mucosa-associated genes was assessed by qRT-PCR in CD and HC children and in treated CD adults (T-CD, n = 6) on gluten free diet. Results: The overall composition, diversity and the estimated microbe associated molecular pattern (MAMP) content of microbiota were comparable between CD and HC, but a sub-population profile comprising eight genus-like bacterial groups was found to differ significantly between HC and CD. In HC, increased TLR2 expression was positively correlated with the expression of tight junction protein ZO-1. In CD and T-CD, the expression of IL-10, IFN-g and CXCR6 were higher as co5mpared to HC. Conclusions: The results suggest that microbiota and altered expression of mucosal receptors have a role in CD. In CD subjects, the increased expression of IL-10 and IFN-g may have partly resulted from the increased TLR9 expression and signaling.
Overview
The claims and statistics of this paper haven’t been checked yet.
Run the check — free, no account needed. It reads the open-access text and checks the sources it cites.
Integrity signals
Registry
Cites
Statistics
Figures
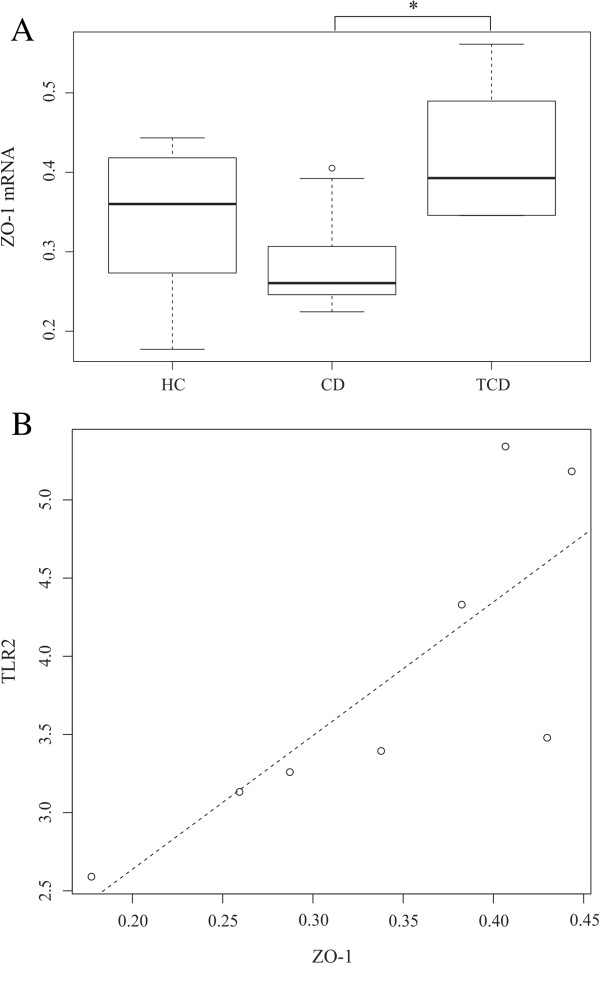
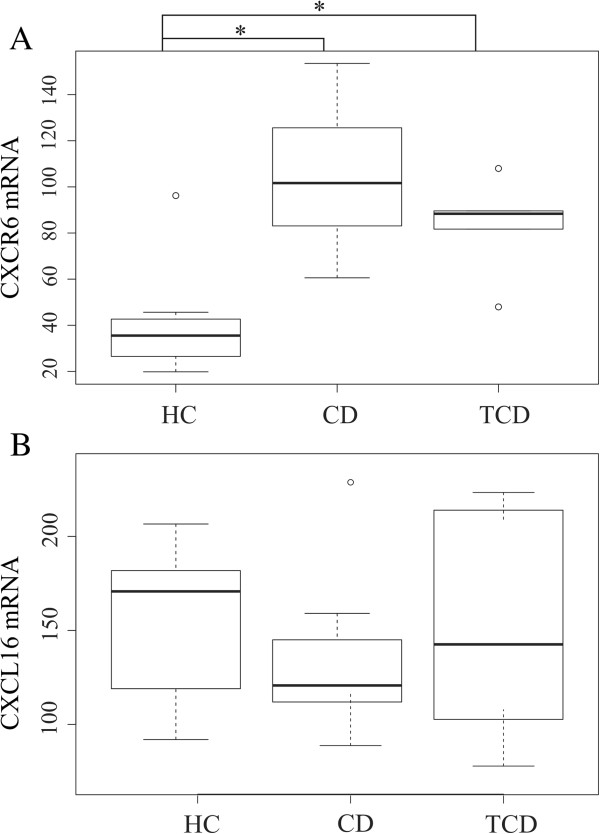
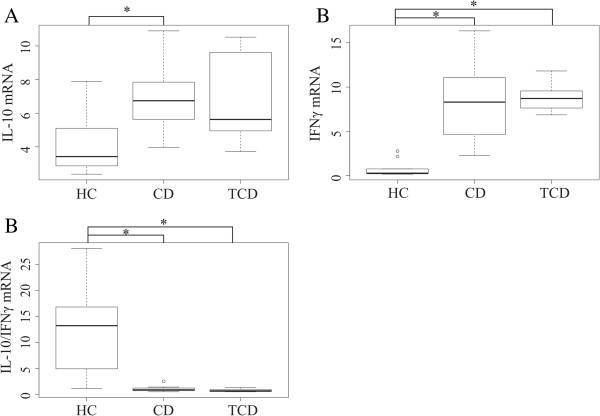
Verification
Claims the paper makes
The claims and statistics of this paper haven’t been checked yet.
Run the check — free, no account needed. It reads the open-access text and checks the sources it cites.
Claims other papers make about this one
Each is checked against this paper’s own text: does it say what the citing paper says it does?
In the citing paper
“Most studies, but not all,48 have found significant differences between healthy children and children with CD in the duodenal49,50 and oral51 microbial populations.”
From The Gut Microbiome and the Brain (2014) · cites this paper as [50]
Self-check
Percentages, sums and reported differences re-computed from the paper’s own numbers.
The self-check needs the paper’s full text.
Citations
Cites
Breiman, L. (2001) · Machine Learning · doi:10.1023/a:1010933404324 · Cited by 133,538
Nonparametric Statistics for the Behavioral Sciences
Guitton, H., & Siegel, S. (1958) · Revue économique · doi:10.2307/3498751 · Cited by 35,279
Data mining: concepts and techniques
Sharma, R., Shah, K., Shirahatti, Y., Patel, S., Sharma, R., Shah, K., Patel, S., Sharma, R., & Han, J. (2012) · Choice Reviews Online · doi:10.5860/choice.49-3305 · Cited by 28,665
Modern Applied Statistics with S
Venables, W. N., & Ripley, B. D. (2002) · Statisctics and computing/Statistics and computing · doi:10.1007/978-0-387-21706-2 · Cited by 25,941
Simpson, E. (1949) · Nature · doi:10.1038/163688a0 · Cited by 14,809
Bolstad, B. M., Irizarry, R. A., Åstrand, M., & Speed, T. P. (2003) · Bioinformatics · doi:10.1093/bioinformatics/19.2.185 · Cited by 8,328
Human gut microbiome viewed across age and geography
Yatsunenko, T., Rey, F. E., Manary, M. J., Trehan, I., Dominguez-Bello, M. G., Contreras, M., Magris, M., Hidalgo, G., Baldassano, R. N., Anokhin, A. P., et al. (2012) · Nature · doi:10.1038/nature11053 · Cited by 7,815
A Toll-like receptor recognizes bacterial DNA
Hemmi, H., Takeuchi, O., Kawai, T., Kaisho, T., Sato, S., Sanjo, H., Matsumoto, M., Hoshino, K., Wagner, H., Takeda, K., et al. (2000) · Nature · doi:10.1038/35047123 · Cited by 6,491 · cited 1×
“In immune cells, TLR9 stimulation is known to trigger Th1 type immune responses [61-63].”
BackgroundDiversity and Evenness: A Unifying Notation and Its Consequences
Hill, M. (1973) · Ecology · doi:10.2307/1934352 · Cited by 6,486
Controlling the false discovery rate in behavior genetics research
Benjamini, Y., Drai, D., Elmer, G., Kafkafi, N., & Golani, I. (2001) · Behavioural Brain Research · doi:10.1016/s0166-4328(01)00297-2 · Cited by 4,146
Development of the Human Infant Intestinal Microbiota
Palmer, C., Bik, E. M., DiGiulio, D. B., Relman, D. A., & Brown, P. O. (2007) · PLoS Biology · doi:10.1371/journal.pbio.0050177 · Cited by 2,877
CpG Motifs in Bacterial DNA and Their Immune Effects
Krieg, A. Μ. (2002) · Annual Review of Immunology · doi:10.1146/annurev.immunol.20.100301.064842 · Cited by 2,598
Green, P. H. R., & Jones, R. (2006) · Cited by 2,453
The role of the gut microbiota in nutrition and health
Flint, H. J., Scott, K. P., Louis, P., & Duncan, S. H. (2012) · Nature Reviews Gastroenterology & Hepatology · doi:10.1038/nrgastro.2012.156 · Cited by 2,283
Chambers, J. M., Hastie, T. J., & Pregibon, D. (1990) · Physica-Verlag eBooks · doi:10.1007/978-3-642-50096-1_48 · Cited by 1,784
Reciprocal interactions of the intestinal microbiota and immune system
Maynard, C. L., Elson, C. O., Hatton, R. D., & Weaver, C. T. (2012) · Nature · doi:10.1038/nature11551 · Cited by 1,598 · cited 2×
“Further, TLR signaling is known to affect epithelial barrier function by having a bearing on the expression of tight junction proteins, mucus protein mucin 2 and antimicrobial peptides such as RegIII-γ [20,21].”
BackgroundThrough Ageing, and Beyond: Gut Microbiota and Inflammatory Status in Seniors and Centenarians
Biagi, E., Nylund, L., Candela, M., Ostan, R., Bucci, L., Pini, E., Nikkïla, J., Monti, D., Satokari, R., Franceschi, C., et al. (2010) · PLoS ONE · doi:10.1371/journal.pone.0010667 · Cited by 1,483
Self-citationAbreu, M. T. (2010) · Nature Reviews Immunology · doi:10.1038/nri2707 · Cited by 1,288
Ruminococcus bromii is a keystone species for the degradation of resistant starch in the human colon
Ze, X., Duncan, S. H., Louis, P., & Flint, H. J. (2012) · The ISME Journal · doi:10.1038/ismej.2012.4 · Cited by 1,060
Trynka, G., PreventCD Study Group, Hunt, K. A., Bockett, N. A., Romanos, J., Mistry, V., Szperl, A., Bakker, S. F., Bardella, M. T., Bhaw, L., et al. (2011) · Nature Genetics · doi:10.1038/ng.998 · Cited by 836
Zoetendal, E. G., Raes, J., van den Bogert, B., Arumugam, M., Booijink, C. C. G. M., Troost, F. J., Bork, P., Wels, M., de Vos, W. M., & Kleerebezem, M. (2012) · The ISME Journal · doi:10.1038/ismej.2011.212 · Cited by 722
Toll-like receptor 2 controls mucosal inflammation by regulating epithelial barrier function
Cario, E., Gerken, G., & Podolsky, D. K. (2007) · Gastroenterology · doi:10.1053/j.gastro.2007.02.056 · Cited by 697
Salonen, A., Nikkilä, J., Jalanka, J., Immonen, O., Rajilić-Stojanović, M. D., Kekkonen, R. A., Palva, A., & de Vos, W. M. (2010) · Journal of Microbiological Methods · doi:10.1016/j.mimet.2010.02.007 · Cited by 606
Self-citationRajilić‐Stojanović, M., Heilig, H. G. H. J., Molenaar, D., Kajander, K., Surakka, A., Smidt, H., & De Vos, W. M. (2009) · Environmental Microbiology · doi:10.1111/j.1462-2920.2009.01900.x · Cited by 484
Self-citationCario, E., Gerken, G., & Podolsky, D. K. (2004) · Gastroenterology · doi:10.1053/j.gastro.2004.04.015 · Cited by 475
Nilsen, E. M., Jahnsen, F. L., Lundin, K. E. A., Johansen, F., FAUSA, O., Sollid, L. M., Jahnsen, J., Scott, H., & Brandtzaeg, P. (1998) · Gastroenterology · doi:10.1016/s0016-5085(98)70134-9 · Cited by 471
Abel, S., Hundhausen, C., Mentlein, R., Schulte, A., Berkhout, T. A., BROADWAY, N. M., Hartmann, D., Sedlacek, R., Dietrich, S., Muetze, B., et al. (2004) · The Journal of Immunology · doi:10.4049/jimmunol.172.10.6362 · Cited by 440
Imbalance in the composition of the duodenal microbiota of children with coeliac disease
Nadal, I., Donant, E., Ribes‐Koninckx, C., Calabuig, M., & Sanz, Y. (2007) · Journal of Medical Microbiology · doi:10.1099/jmm.0.47410-0 · Cited by 396
Specific duodenal and faecal bacterial groups associated with paediatric coeliac disease
Collado, M. C., Donat, E., Ribes-Koninckx, C., Calabuig, M., & Sanz, Y. (2009) · Journal of Clinical Pathology · doi:10.1136/jcp.2008.061366 · Cited by 354
Nilsen, E. M., Lundin, K. E. A., Krajči, P., Scott, H., Sollid, L. M., & Brandtzaeg, P. (1995) · Gut · doi:10.1136/gut.37.6.766 · Cited by 347
Jalanka-Tuovinen, J., Salonen, A., Nikkilä, J., Immonen, O., Kekkonen, R., Lahti, L., Palva, A., & de Vos, W. M. (2011) · PLoS ONE · doi:10.1371/journal.pone.0023035 · Cited by 340
Self-citationDe Palma, G., Nadal, I., Medina, M., Donat, E., Ribes-Koninckx, C., Calabuig, M., & Sanz, Y. (2010) · BMC Microbiology · doi:10.1186/1471-2180-10-63 · Cited by 330
Highlighting new phylogenetic specificities of Crohn's disease microbiota
Mondot, S., Kang, S., Furet, J., de Cárcer, D. A., McSweeney, C., Morrison, M., Marteau, P., Doré, J., & Leclerc, M. (2011) · Inflammatory Bowel Diseases · doi:10.1002/ibd.21436 · Cited by 283
A distinctive 'microbial signature' in celiac pediatric patients
Schippa, S., Iebba, V., Barbato, M., Nardo, G. D., Totino, V., Checchi, M. P., Longhi, C., Maiella, G., Cucchiara, S., & Conte, M. (2010) · BMC Microbiology · doi:10.1186/1471-2180-10-175 · Cited by 259
Sellitto, M., Bai, G., Serena, G., Fricke, W. F., Sturgeon, C., Gajer, P., White, J. R., Koenig, S. S. K., Sakamoto, J. M., Boothe, D. L., et al. (2012) · PLoS ONE · doi:10.1371/journal.pone.0033387 · Cited by 255
Monitoring impact of in situ biostimulation treatment on groundwater bacterial community by DGGE
Iwamoto, T., Tani, K., Nakamura, K., Suzuki, Y., Kitagawa, M., Eguchi, M., & Nasu, M. (2000) · FEMS Microbiology Ecology · doi:10.1111/j.1574-6941.2000.tb00707.x · Cited by 245
Wang, X., Heazlewood, S. P., Krause, D. O., & Florin, T. H. (2003) · Journal of Applied Microbiology · doi:10.1046/j.1365-2672.2003.02005.x · Cited by 235
Nistal, E., Caminero, A., Herrán, A. R., Arias, L., Vivas, S., de Morales, J. M. R., Calleja, S., de Miera, L. E. S., Arroyo, P., & Casqueiro, J. (2012) · Inflammatory Bowel Diseases · doi:10.1002/ibd.21830 · Cited by 187
Forsberg, G., Hernell, O., Melgar, S., Israelsson, A. C. E., Hammarström, S., & Hammarström, M. (2002) · Gastroenterology · doi:10.1053/gast.2002.35355 · Cited by 181
Sanz, Y., Sánchez, E., Marzotto, M., Calabuig, M., Torriani, S., & Dellaglio, F. (2007) · FEMS Immunology & Medical Microbiology · doi:10.1111/j.1574-695x.2007.00337.x · Cited by 173
Ou, G., Hedberg, M., Hörstedt, P., Baranov, V., Forsberg, G., Drobni, M., Sandström, O., Nyunt Wai, S., Johansson, I., Hammarström, M.-L., et al. (2009) · American Journal of Gastroenterology · doi:10.1038/ajg.2009.524 · Cited by 169
Shimaoka, T., Nakayama, T., Kume, N., Takahashi, S., Yamaguchi, J., Minami, M., Hayashida, K., Kita, T., Ohsumi, J., Yoshie, O., et al. (2003) · The Journal of Immunology · doi:10.4049/jimmunol.171.4.1647 · Cited by 157
Nylund, L., Satokari, R. M., Nikkilä, J., Rajilić-Stojanović, M. D., Kalliomäki, M. A., Isolauri, E., Salminen, S., & de Vos, W. M. (2013) · BMC Microbiology · doi:10.1186/1471-2180-13-12 · Cited by 154
Self-citationGreen, P. H. R., & Jabrì, B. (2005) · Annual Review of Medicine · doi:10.1146/annurev.med.57.051804.122404 · Cited by 153
Palma, G. D., Capilla, A., Nova, E., Castillejo, G., Varea, V., Pozo, T., Garrote, J. A., Polanco, I., López, A., Ribes‐Koninckx, C., et al. (2012) · PLoS ONE · doi:10.1371/journal.pone.0030791 · Cited by 150
Salvati, V. M., Mazzarella, G., Gianfrani, C., Levings, M. K., Stefanile, R., Giulio, B. D., Iaquinto, G., Giardullo, N., Auricchio, S., Roncarolo, M., et al. (2004) · Gut · doi:10.1136/gut.2003.023150 · Cited by 142
Gianfrani, C., Levings, M. K., Sartirana, C., Mazzarella, G., Barba, G., Zanzi, D., Camarca, A., Iaquinto, G., Giardullo, N., Auricchio, S., et al. (2006) · The Journal of Immunology · doi:10.4049/jimmunol.177.6.4178 · Cited by 141
A genetic perspective on coeliac disease
Trynka, G., Wijmenga, C., & van Heel, D. A. (2010) · Trends in Molecular Medicine · doi:10.1016/j.molmed.2010.09.003 · Cited by 127
Ey, B., Eyking, A., Gerken, G., Podolsky, D. K., & Cario, E. (2009) · Journal of Biological Chemistry · doi:10.1074/jbc.m901619200 · Cited by 119
Catassi, C., & Fasano, A. (2008) · Elsevier eBooks · doi:10.1016/b978-012373739-7.50003-4 · Cited by 112
Kalliomäki, M. A., Satokari, R. M., Lähteenoja, H., Vähämiko, S., Grönlund, J., Routi, T., & Salminen, S. (2011) · Journal of Pediatric Gastroenterology and Nutrition · doi:10.1097/mpg.0b013e318241cfa8 · Cited by 111
Self-citationHase, K., Murakami, T., Takatsu, H., Shimaoka, T., Iimura, M., Hamura, K., Kawano, K., Ohshima, S., Chihara, R., Itoh, K., et al. (2006) · The Journal of Immunology · doi:10.4049/jimmunol.176.1.43 · Cited by 107
Intestinal Bacteroides species associated with coeliac disease
Sánchez, E., Donat, E., Ribes‐Koninckx, C., Calabuig, M., & Sanz, Y. (2010) · Journal of Clinical Pathology · doi:10.1136/jcp.2010.076950 · Cited by 95
Bossert, W., Pattanaik, P. K., & Xu, Y. (2001) · Érudit documents and data repository (Érudit Consortium, University of Montreal) · Cited by 89
Mukhopadhya, I., Hansen, R., Nicholl, C. E., Alhaidan, Y., Thomson, J., Berry, S., Pattinson, C., Stead, D., Russell, R., El-Omar, E., et al. (2011) · PLoS ONE · doi:10.1371/journal.pone.0027076 · Cited by 87
Papista, C., Gerakopoulos, V., Kourelis, A., Sounidaki, M., Kontana, A., Berthelot, L., Moura, I. C., Monteiro, R. C., & Yiangou, M. (2012) · Laboratory Investigation · doi:10.1038/labinvest.2012.13 · Cited by 82
Pizzuti, D., Bortolami, M., Mazzon, E., Buda, A., Guariso, G., D’Odorico, A., Chiarelli, S. M., Renata D'Incà, Lazzari, F. D., & Martines, D. (2004) · Digestive and Liver Disease · doi:10.1016/j.dld.2004.01.013 · Cited by 75
Potential Celiac Patients: A Model of Celiac Disease Pathogenesis
Sperandeo, M. P., Tosco, A., Izzo, V., Tucci, F., Troncone, R., Auricchio, R., Romanos, J., Trynka, G., Auricchio, S., Jabrì, B., et al. (2011) · PLoS ONE · doi:10.1371/journal.pone.0021281 · Cited by 62
de Kivit, S., van Hoffen, E., Korthagen, N. M., Garssen, J., & Willemsen, L. (2011) · Immunobiology · doi:10.1016/j.imbio.2010.08.005 · Cited by 58
Diegelmann, J., Seiderer, J., Niess, J. H., Haller, D., Göke, B., Reinecker, H., & Brand, S. (2010) · Inflammatory Bowel Diseases · doi:10.1002/ibd.21306 · Cited by 49
Pedersen, R. M., Holt, H. M., & Justesen, U. S. (2011) · Journal of Clinical Microbiology · doi:10.1128/jcm.02525-10 · Cited by 47
Defnoun, S., Labat, M., Ambrosio, M., Garcia, J. L., & Patel, B. K. C. (2000) · INTERNATIONAL JOURNAL OF SYSTEMATIC AND EVOLUTIONARY MICROBIOLOGY · doi:10.1099/00207713-50-3-1221 · Cited by 46
Lee, K., Jung, J., Lee, Y., Kim, T., Choi, S., Park, J., Kim, D., & Kwon, H. (2006) · Molecular Immunology · doi:10.1016/j.molimm.2005.12.004 · Cited by 45
Characterization of Immunostimulatory CpG-Rich Sequences from DifferentBifidobacteriumSpecies
Ménard, O., Gafa, V., Kapel, N., Rodriguez, B., Butel, M., & Waligora‐Dupriet, A. (2010) · Applied and Environmental Microbiology · doi:10.1128/aem.01714-09 · Cited by 44
Celiac disease and its effect on human reproduction: a review.
Soni, S., & Badawy, S. Z. A. (2010) · PubMed · Cited by 42
SR-PSOX/CXCL16 plays a critical role in the progression of colonic inflammation
Uza, N., Nakase, H., Yamamoto, S., Yoshino, T., Takeda, Y., Ueno, S., Inoue, S., Mikami, S., Matsuura, M., Shimaoka, T., et al. (2011) · Gut · doi:10.1136/gut.2010.221879 · Cited by 42
Gut bacterial profile in patients newly diagnosed with treatment-naïve Crohn's disease
Ricanek, P., Vatn, Frye, S. A., Rydning, Tønjum, T., & Lothe (2012) · Clinical and Experimental Gastroenterology · doi:10.2147/ceg.s33858 · Cited by 37
Lahdenperä, A. I., Ludvigsson, J., Fälth‐Magnusson, K., Högberg, L., & Vaarala, O. (2011) · Scandinavian Journal of Gastroenterology · doi:10.3109/00365521.2011.551888 · Cited by 35
The micro-flora of the small bowel in health and disease
Sullivan, Å., Törnblom, H., Lindberg, G., Hammarlund, B., Ac, P., Einarsson, C., & Nord, C. E. (2003) · Anaerobe · doi:10.1016/s1075-9964(03)00060-x · Cited by 32
Prolonged outbreak of Serratia marcescens in Tartu University Hospital: a case–control study
Adamson, V., Mitt, P., Pisarev, H., Metsvaht, T., Telling, K., Naaber, P., & Maimets, M. (2012) · BMC Infectious Diseases · doi:10.1186/1471-2334-12-281 · Cited by 30
Polilli, E., Parruti, G., Fazii, P., D’Antonio, D., Palmieri, D., D’Incecco, C., Mangifesta, A., Garofalo, G., Duca, L., D’Amario, C., et al. (2011) · Eurosurveillance · doi:10.2807/ese.16.24.19892-en · Cited by 29
Agonists of Toll-like Receptor 9 Containing Synthetic Dinucleotide Motifs
Yu, D. S., Putta, M. R., Bhagat, L., Li, Y., Zhu, F., Wang, D., Tang, J. X., Kandimalla, E. R., & Agrawal, S. (2007) · Journal of Medicinal Chemistry · doi:10.1021/jm070881l · Cited by 26
Research works printed but not linked: 2
- Legendre PLL: Numerical Ecology. 1998, Amsterdam, NL: Elservier Science BV
- Siegel S, Castellan NJ: Non parametric statistics for the behavioural sciences. 1988, New York, NY: MacGraw-Hill
Cited by
Sorted by citations
The Gut Microbiome and the Brain
Galland, L. (2014) · Journal of Medicinal Food · doi:10.1089/jmf.2014.7000 · Cited by 648
Commensal bacteria make GPCR ligands that mimic human signalling molecules
Cohen, L. J., Esterhazy, D., Kim, S.-H., Lemetre, C., Aguilar, R. R., Gordon, E. A., Pickard, A. J., Cross, J. R., Emiliano, A. B., Han, S. M., et al. (2017) · Nature · doi:10.1038/nature23874 · Cited by 500
Mucosal Prevalence and Interactions with the Epithelium Indicate Commensalism of Sutterella spp.
Hiippala, K., Kainulainen, V., Kalliomäki, M., Arkkila, P., & Satokari, R. (2016) · Frontiers in Microbiology · doi:10.3389/fmicb.2016.01706 · Cited by 351
Self-citationWest, C. E., Renz, H. E., Jenmalm, M. C., Kozyrskyj, A. L., Allen, K. J., Vuillermin, P., Prescott, S. L., Mackay, C. R., Salminen, S., Wong, G., et al. (2015) · Journal of Allergy and Clinical Immunology · doi:10.1016/j.jaci.2014.11.012 · Cited by 288
De Filippo, C., Di Paola, M., Ramazzotti, M., Albanese, D., Pieraccini, G., Banci, E., Miglietta, F., Cavalieri, D., & Lionetti, P. (2017) · Frontiers in Microbiology · doi:10.3389/fmicb.2017.01979 · Cited by 270
Metadata
- Authors
- Cheng, J., Kalliomäki, M., Heilig, H. G., Palva, A., Lähteenoja, H., de Vos, W. M., Salojärvi, J., & Satokari, R.
- Affiliations
- University of Helsinki (FI)
- University of Turku (FI)
- Wageningen University & Research (NL)
- Turku University Hospital (FI)
- Corresponding author
- Satokari, Reetta
- Venue
- BMC Gastroenterology
- Published
- 2013-07-11
- Volume
- 13
- Issue
- 1
- Pages
- 113-113
- ISSN
- 1471-230X (ISSN-L)
- PMC
- PMC3716955
- OpenAlex
- W1979395260
- Cited by
- 152
- References
- 72
- Citations by year
- 2026: 3 · 2025: 8 · 2024: 8 · 2023: 8 · 2022: 10 · 2021: 21 · 2020: 9 · 2019: 8 · 2018: 12 · 2017: 12 · 2016: 16 · 2015: 16 · 2014: 17 · 2013: 3
- FWCI
- 16.35
- Type
- journal article
- Language
- en
- Open access
- gold
- doi.org
- Licence
- Locations
- BMC Gastroenterology (publishedVersion, cc-by)
- Europe PMC (PubMed Central) (publishedVersion, cc-by)
- PubMed Central (publishedVersion, cc-by)
- PubMed (publishedVersion)
- Socio-Environmental Systems Modeling (acceptedVersion)
- Työväentutkimus Vuosikirja (submittedVersion)
- Data Archiving and Networked Services (DANS) (submittedVersion, other-oa)
- Funders
- Suomen Lääketieteen Säätiö
- Academy of Finland (138902)
- Keliakialiitto
- Varsinais-Suomen Sairaanhoitopiiri
- Topics
- Health Sciences › Medicine › Gastroenterology › Celiac Disease Research and Management
- Life Sciences › Biochemistry, Genetics and Molecular Biology › Molecular Biology › Gut microbiota and health
- Health Sciences › Medicine › Gastroenterology › Gastrointestinal motility and disorders
- Keywords
- pediatric celiac disease, duodenal microbiota, mucosal homeostasis, TLR2, TLR9, tight junctions, ZO-1, IL-10, interferon-gamma, CXCR6, gluten-free diet, HLA-DQ2/DQ8, microbial metabolites
- MeSH terms
- Pancreatitis-Associated Proteins, Chemokine CXCL16, Receptors, CXCR6, Adolescent, Adult, Celiac Disease, Child, Child, Preschool, Duodenum, Female, Homeostasis, Humans, Interferon-gamma, Intestinal Mucosa, Male, Middle Aged, Proteins, Receptors, Virus, Tumor Necrosis Factor-alpha, Signal Transduction, Gene Expression, Case-Control Studies, Interleukin-10, Connexin 43, Receptors, Chemokine, Chemokines, CXC, Receptors, Scavenger, Toll-Like Receptor 2, Toll-Like Receptor 9, Metagenome, Mucin-2, Zonula Occludens-1 Protein
About these checks
Registry, retraction, Cites and statistics results are computed, not judged, with one exception: a printed reference that no index lists is read once by a model before it counts as a citation error. Claims are extracted by a model and kept only when their quote appears verbatim in the text; each cited source is then checked, with a model’s help, for whether it says what the claim relies on. Those verdicts can be wrong — read the claim’s quote and the cited source before relying on one.
Statistics and arithmetic are recomputed, not judged.
Confidence bands are shown only for fields calibrated on our annotated test set. None is calibrated yet, so no band is shown.
What counts as a claim ›How we measure confidence ›How we check this ›
Are you an author, or do you see a problem with this page? Request a review
