

The DOI matches its Crossref record; 60 of the 60 references it cites were found in a registry or an index.
TGFβ signalling plays an important role in IL4-induced alternative activation of microglia
Open accessAbstract
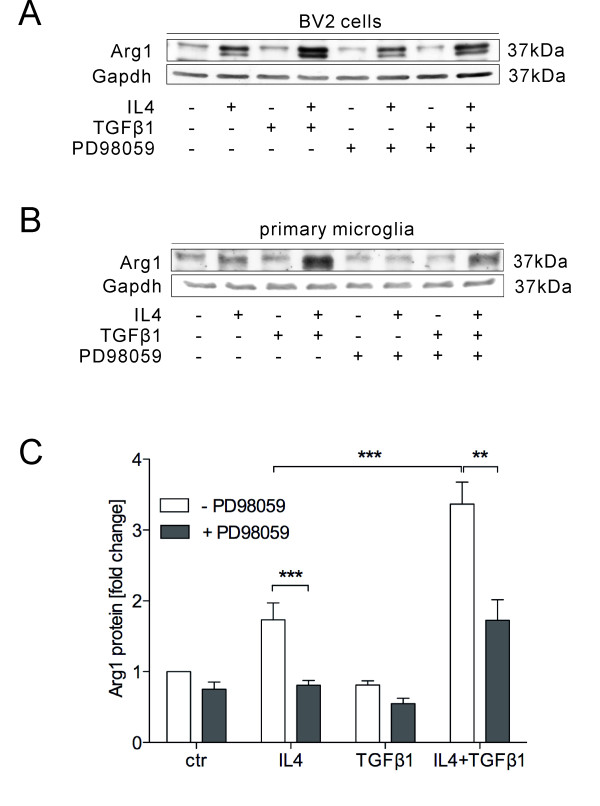
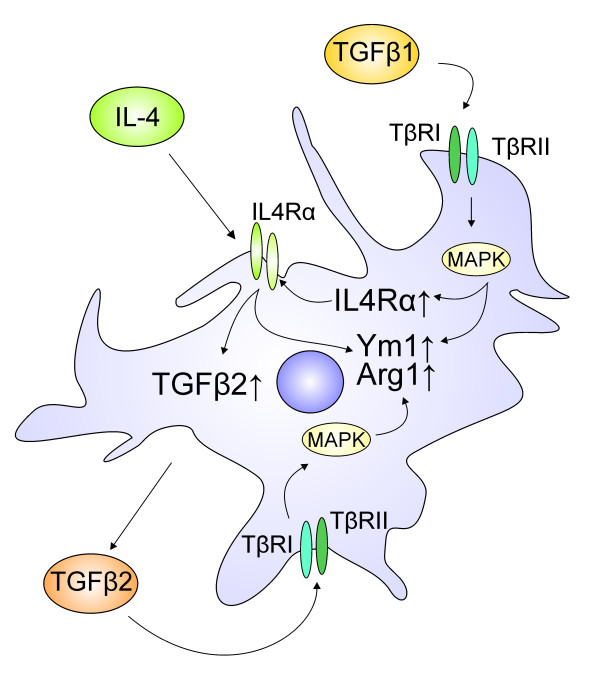
BACKGROUND: Microglia are the resident immune cells of the central nervous system and are accepted to be involved in a variety of neurodegenerative diseases. Several studies have demonstrated that microglia, like peripheral macrophages, exhibit two entirely different functional activation states, referred to as classical (M1) and alternative (M2) activation. TGFβ is one of the most important anti-inflammatory cytokines and its effect on inhibiting microglia or macrophage classical activation has been extensively studied. However, the role of TGFβ during alternative activation of microglia has not been described yet. METHODS: To investigate the role of TGFβ in IL4-induced microglia alternative activation, both, BV2 as well as primary microglia from new born C57BL/6 mice were used. Quantitative RT-PCR and western blots were performed to detect mRNA and protein levels of the alternative activation markers Arginase1 (Arg1) and Chitinase 3-like 3 (Ym1) after treatment with IL4, TGFβ or both. Endogenous TGFβ release after IL4 treatment was evaluated using the mink lung epithelial cell (MLEC) assay and a direct TGFβ2 ELISA. TGFβ receptor type I inhibitor and MAPK inhibitor were applied to address the involvement of TGFβ signalling and MAPK signalling in IL4-induced alternative activation of microglia. RESULTS: TGFβ enhances IL4-induced microglia alternative activation by strongly increasing the expression of Arg1 and Ym1. This synergistic effect on Arg1 induction is almost completely blocked by the application of the MAPK inhibitor, PD98059. Further, treatment of primary microglia with IL4 increased the expression and secretion of TGFβ2, suggesting an involvement of endogenous TGFβ in IL4-mediated microglia activation process. Moreover, IL4-mediated induction of Arg1 and Ym1 is impaired after blocking the TGFβ receptor I indicating that IL4-induced microglia alternative activation is dependent on active TGFβ signalling. Interestingly, treatment of primary microglia with TGFβ alone results in up regulation of the IL4 receptor alpha, indicating that TGFβ increases the sensitivity of microglia for IL4 signals. CONCLUSIONS: Taken together, our data reveal a new role for TGFβ during IL4-induced alternative activation of microglia and consolidate the essential functions of TGFβ as an anti-inflammatory molecule and immunoregulatory factor for microglia.
Overview
The claims and statistics of this paper haven’t been checked yet.
Run the check — free, no account needed. It reads the open-access text and checks the sources it cites.
Integrity signals
Registry
Cites
Statistics
Figures
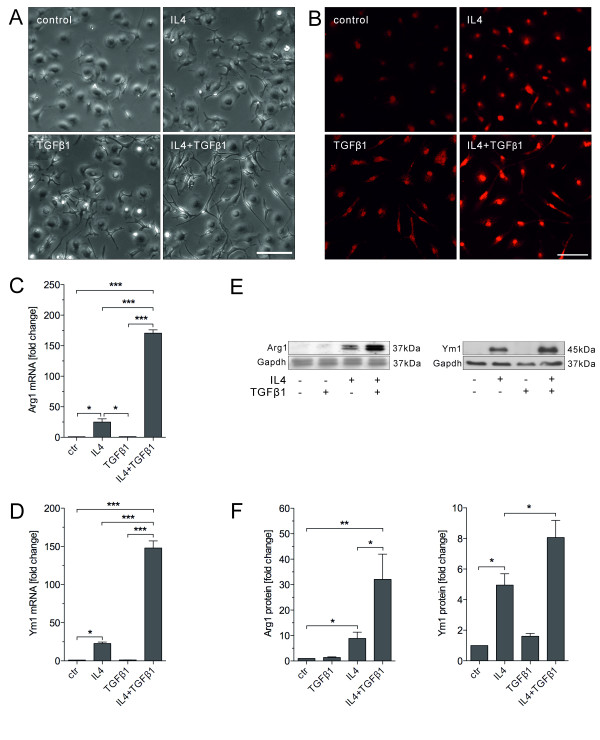
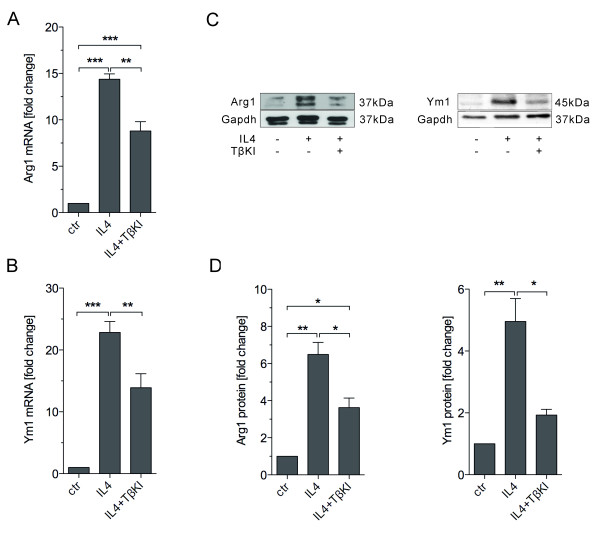
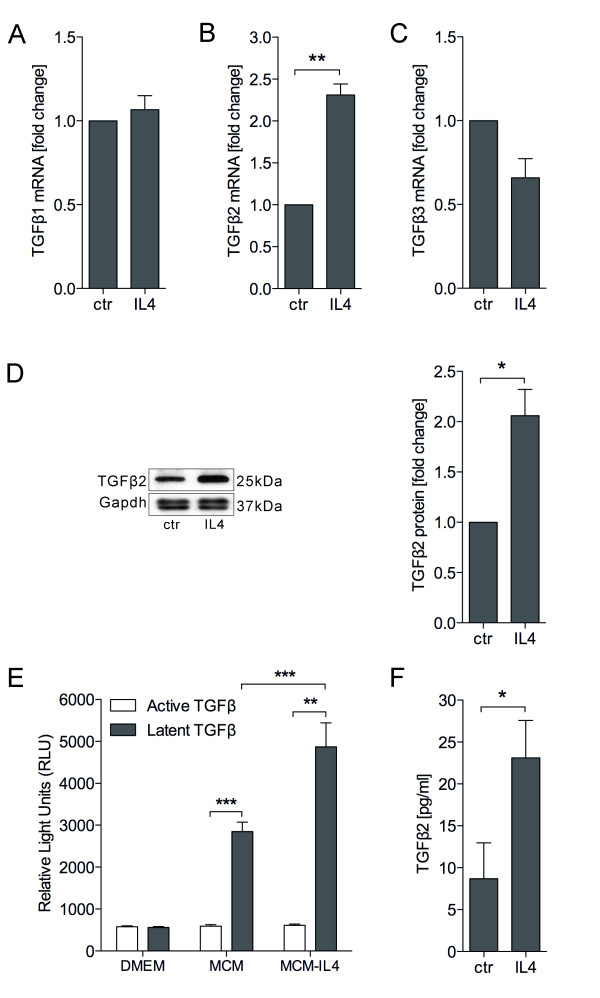
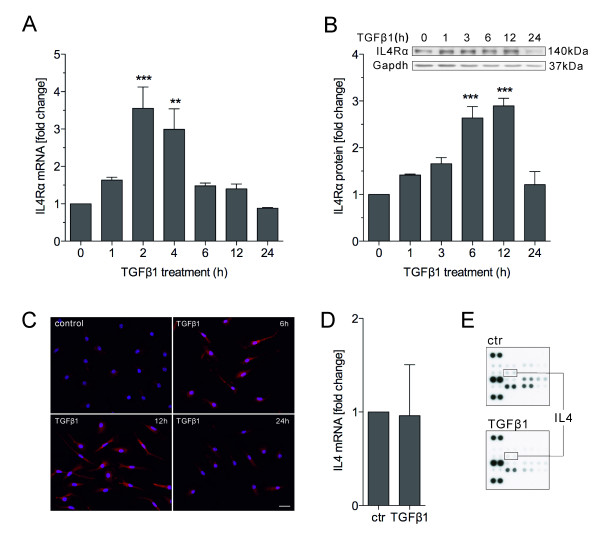
Verification
Claims the paper makes
The claims and statistics of this paper haven’t been checked yet.
Run the check — free, no account needed. It reads the open-access text and checks the sources it cites.
Claims other papers make about this one
Each is checked against this paper’s own text: does it say what the citing paper says it does?
In the citing paper
“it was observed in AD brains the presence of activated microglia and astrocytes around Aβ plaques, with the release of inflammatory cytokines, such as IL-1 and IL-6, TNF-α and transforming growth factor-β (TNF-β; Wyss-Coray, 2006; Zhou et al., 2012).”
From The impact of microglial activation on blood-brain barrier in brain diseases (2014) · cites this paper as Zhou et al., 2012
In the citing paper
“The upregulation of miR-124 in microglia may be due to direct transfer of miR-124 from neurons to microglia via exosomal vesicles, direct cell-to-cell contacts between microglia and neurons, and production of anti-inflammatory factors, including TGF-β and CX3CL1 by neurons (Zhou et al. 2012; Ponomarev et al. 2013).”
From MiR-124 and MiR-155 as Therapeutic Targets in Microglia-Mediated Inflammation in Multiple Sclerosis (2025) · cites this paper as Zhou et al. 2012
Self-check
Percentages, sums and reported differences re-computed from the paper’s own numbers.
The self-check needs the paper’s full text.
Citations
Cites
Exploring the full spectrum of macrophage activation
Mosser, D. M., & Edwards, J. P. (2008) · Nature Reviews Immunology · doi:10.1038/nri2448 · Cited by 9,144
Alternative activation of macrophages
Gordon, S. (2003) · Nature Reviews Immunology · doi:10.1038/nri978 · Cited by 6,189
Monocyte and macrophage heterogeneity
Gordon, S., & Taylor, P. R. (2005) · Nature Reviews Immunology · doi:10.1038/nri1733 · Cited by 5,190
Obesity induces a phenotypic switch in adipose tissue macrophage polarization
Lumeng, C. N., Bodzin, J. L., & Saltiel, A. R. (2007) · Journal of Clinical Investigation · doi:10.1172/jci29881 · Cited by 4,664
Microglia-mediated neurotoxicity: uncovering the molecular mechanisms
Block, M. L., Zecca, L., & Hong, J.-S. (2007) · Nature Reviews Neuroscience · doi:10.1038/nrn2038 · Cited by 4,110
Fadok, V. A., Bratton, D. L., Konowal, A., Freed, P. W., Westcott, J. Y., & Henson, P. M. (1998) · Journal of Clinical Investigation · doi:10.1172/jci1112 · Cited by 3,166 · cited 2×
“Whereas TGFβ induces acquired deactivation, the acquired deactivation macrophages also produce TGFβ in an autocrine manner [3,24,25].”
BackgroundAlternative Activation of Macrophages: An Immunologic Functional Perspective
Martinez, F. O., Helming, L., & Gordon, S. (2009) · Annual Review of Immunology · doi:10.1146/annurev.immunol.021908.132532 · Cited by 2,745
Role of Transforming Growth Factor β in Human Disease
Blobe, G. C., Schiemann, W. P., & Lodish, H. F. (2000) · New England Journal of Medicine · doi:10.1056/nejm200005043421807 · Cited by 2,453
TRANSFORMING GROWTH FACTOR-β REGULATION OF IMMUNE RESPONSES
Li, M. O., Wan, Y. Y., Sanjabi, S., Robertson, A.-K. L., & Flavell, R. A. (2005) · Annual Review of Immunology · doi:10.1146/annurev.immunol.24.021605.090737 · Cited by 2,264
The many faces of macrophage activation
Mosser, D. M. (2003) · Journal of Leukocyte Biology · doi:10.1189/jlb.0602325 · Cited by 1,902
SPECIFICITY AND VERSATILITY IN TGF-β SIGNALING THROUGH SMADS
Feng, X.-H., & Derynck, R. (2005) · Annual Review of Cell and Developmental Biology · doi:10.1146/annurev.cellbio.21.022404.142018 · Cited by 1,869
Fibrotic disease and the TH1/TH2 paradigm
Wynn, T. A. (2004) · Nature Reviews Immunology · doi:10.1038/nri1412 · Cited by 1,765
Macrophage deactivation by interleukin 10.
Bogdan, C., Yoram Vodovotz, B., & Nathan, C. (1991) · The Journal of Experimental Medicine · doi:10.1084/jem.174.6.1549 · Cited by 1,236
Heterogeneity of Microglial Activation in the Innate Immune Response in the Brain
Colton, C. A. (2009) · Journal of Neuroimmune Pharmacology · doi:10.1007/s11481-009-9164-4 · Cited by 916
Why neurodegenerative diseases are progressive: uncontrolled inflammation drives disease progression
Gao, H., & Hong, J. (2008) · Trends in Immunology · doi:10.1016/j.it.2008.05.002 · Cited by 852
Ponomarev, E. D., Veremeyko, T., Barteneva, N., Krichevsky, A. M., & Weiner, H. L. (2011) · Nature Medicine · doi:10.1038/nm.2266 · Cited by 787
Abe, M., Harpel, J. G., Metz, C. N., Nunes, I., Loskutoff, D. J., & Rifkin, D. B. (1994) · Analytical Biochemistry · doi:10.1006/abio.1994.1042 · Cited by 757
Massagué, J., & Gomis, R. R. (2006) · FEBS Letters · doi:10.1016/j.febslet.2006.04.033 · Cited by 741
Hesse, M., Modolell, M., Flamme, A. C. L., Schito, M. L., Fuentes, J. M., Cheever, A. W., Pearce, E. J., & Wynn, T. A. (2001) · The Journal of Immunology · doi:10.4049/jimmunol.167.11.6533 · Cited by 723
Munder, M., Eichmann, K., & Modolell, M. (1998) · The Journal of Immunology · doi:10.4049/jimmunol.160.11.5347 · Cited by 647
Shaping Gene Expression in Activated and Resting Primary Macrophages by IL-10
Lang, R., Patel, D. H., Morris, J. J., Rutschman, R., & Murray, P. J. (2002) · The Journal of Immunology · doi:10.4049/jimmunol.169.5.2253 · Cited by 621
Inside, outside, upside down: damage-associated molecular-pattern molecules (DAMPs) and redox
Rubartelli, A., & Lotze, M. T. (2007) · Trends in Immunology · doi:10.1016/j.it.2007.08.004 · Cited by 614
Interdependent SMAD and JNK Signaling in Transforming Growth Factor-β-mediated Transcription
Engel, M. E., McDonnell, M. A., Law, B. K., & Moses, H. L. (1999) · Journal of Biological Chemistry · doi:10.1074/jbc.274.52.37413 · Cited by 538
Ameboid microglia as effectors of inflammation in the central nervous system
Giulian, D. (1987) · Journal of Neuroscience Research · doi:10.1002/jnr.490180123 · Cited by 482
The microglial "activation" continuum: from innate to adaptive responses
Town, T., Nikolic, V., & Tan, J. (2005) · Journal of Neuroinflammation · doi:10.1186/1742-2094-2-24 · Cited by 467
Assessing Activation States in Microglia
Colton, C. A., & Wilcock, D. M. (2010) · CNS & Neurological Disorders - Drug Targets · doi:10.2174/187152710791012053 · Cited by 430
Blocking TGF-β–Smad2/3 innate immune signaling mitigates Alzheimer-like pathology
Town, T., Laouar, Y., Pittenger, C., Mori, T., Szekely, C. A., Tan, J., Duman, R. S., & Flavell, R. A. (2008) · Nature Medicine · doi:10.1038/nm1781 · Cited by 422
Amyloidogenic role of cytokine TGF-β1 in transgenic mice and in Alzheimer's disease
Wyss-Coray, T., Masliah, E., Mallory, M., McConlogue, L., Johnson-Wood, K., Lin, C., & Mucke, L. (1997) · Nature · doi:10.1038/39321 · Cited by 417
Ponomarev, E. D., Maresz, K., Tan, Y., & Dittel, B. N. (2007) · The Journal of Neuroscience · doi:10.1523/jneurosci.1922-07.2007 · Cited by 396
Expression profiles for macrophage alternative activation genes in AD and in mouse models of AD.
(2006) · Journal of Neuroinflammation · doi:10.1186/1742-2094-3-27 · Cited by 393
Nrf2 regulates microglial dynamics and neuroinflammation in experimental Parkinson's disease
Rojo, A. I., Innamorato, N. G., Martín-Moreno, A. M., CEBALLOS, M. L. D., Yamamoto, M. P., & Cuadrado, A. (2009) · Glia · doi:10.1002/glia.20947 · Cited by 390
Enzymes of Arginine Metabolism
Morris, S. M. (2004) · Journal of Nutrition · doi:10.1093/jn/134.10.2743s · Cited by 361
Transforming growth factor-beta suppresses activation and proliferation of microglia in vitro.
Suzumura, A., Sawada, M., Yamamoto, H., & Marunouchi, T. (1993) · The Journal of Immunology · doi:10.4049/jimmunol.151.4.2150 · Cited by 305
Vaughan, D. W., & Peters, A. (1974) · Journal of Neurocytology · doi:10.1007/bf01098730 · Cited by 301
The macrophage and the apoptotic cell: an innate immune interaction viewed simplistically?
Gregory, C. D., & Devitt, A. (2004) · Immunology · doi:10.1111/j.1365-2567.2004.01959.x · Cited by 293
Loke, P., Gallagher, I., Nair, M. G., Zang, X., Brombacher, F., Mohrs, M., Allison, J. P., & Allen, J. E. (2007) · The Journal of Immunology · doi:10.4049/jimmunol.179.6.3926 · Cited by 274
Investigational therapeutics targeting the IL-4/IL-13/STAT-6 pathway for the treatment of asthma
Oh, C. K., Geba, G. P., & Molfino, N. A. (2010) · European Respiratory Review · doi:10.1183/09059180.00007609 · Cited by 263
Enhancer-Mediated Control of Macrophage-Specific Arginase I Expression
Pauleau, A., Rutschman, R., Lang, R., Pernis, A. B., Watowich, S. S., & Murray, P. J. (2004) · The Journal of Immunology · doi:10.4049/jimmunol.172.12.7565 · Cited by 247
A Macrophage Protein, Ym1, Transiently Expressed during Inflammation Is a Novel Mammalian Lectin
Chang, N.-C. A., Chung, W., Hwa, K., Kato, I., Chen, J.-E., Liu, C.-H., & Chang, A. C. (2001) · Journal of Biological Chemistry · doi:10.1074/jbc.m010417200 · Cited by 245
Gotoh, T., Sonoki, T., Nagasaki, A., Terada, K., Takiguchi, M., & Mori, M. (1996) · FEBS Letters · doi:10.1016/0014-5793(96)01015-0 · Cited by 236
Differential regulation of macrophage arginine metabolism: a proposed role in wound healing
Shearer, J. D., Richards, J. R., Mills, C. D., & Caldwell, M. D. (1997) · American Journal of Physiology-Endocrinology and Metabolism · doi:10.1152/ajpendo.1997.272.2.e181 · Cited by 229
Boutard, V., Havouis, R., Fouqueray, B. L., Philippe, C., Moulinoux, J.-P., & Baud, L. (1995) · The Journal of Immunology · doi:10.4049/jimmunol.155.4.2077 · Cited by 186
IL-4-Induced Selective Clearance of Oligomeric β-Amyloid Peptide1–42 by Rat Primary Type 2 Microglia
Shimizu, E., Kawahara, K., Kajizono, M., Sawada, M., & Nakayama, H. (2008) · The Journal of Immunology · doi:10.4049/jimmunol.181.9.6503 · Cited by 143
Griffiths, M., Gasque, P., & Neal, J. (2009) · Journal of Neuropathology & Experimental Neurology · doi:10.1097/nen.0b013e3181996688 · Cited by 130
Loane, D. J., Stoica, B. A., Pajoohesh‐Ganji, A., Byrnes, K. R., & Faden, A. I. (2009) · Journal of Biological Chemistry · doi:10.1074/jbc.m806139200 · Cited by 121
IL-10 expression profiling in human monocytes
Williams, L. M., Járai, G., Smith, A. J., & Finan, P. M. (2002) · Journal of Leukocyte Biology · doi:10.1189/jlb.72.4.800 · Cited by 113
Transforming Growth Factor-β: A Neuroprotective Factor in Cerebral Ischemia
Dhandapani, K. M., & Brann, D. W. (2003) · Cell Biochemistry and Biophysics · doi:10.1385/cbb:39:1:13 · Cited by 113
Functional role and species-specific contribution of arginases in pulmonary fibrosis
Kitowska, K., Zakrzewicz, D., Königshoff, M., Chrobak, I., Grimminger, F., Seeger, W., Bulau, P., & Eickelberg, O. (2007) · American Journal of Physiology-Lung Cellular and Molecular Physiology · doi:10.1152/ajplung.00007.2007 · Cited by 99
Basu, A., Krady, J. K., Enterline, J. R., & Levison, S. W. (2002) · Glia · doi:10.1002/glia.10118 · Cited by 83
Ma, T. C., Campana, A., Lange, P. S., Lee, H., Banerjee, K., Bryson, J. B., Mahishi, L., Alam, S., Giger, R. J., Barnes, S., et al. (2010) · Journal of Neuroscience · doi:10.1523/jneurosci.5266-09.2010 · Cited by 79
Herrera‐Molina, R., & Rommy von Bernhardi, M. (2005) · Neurobiology of Disease · doi:10.1016/j.nbd.2005.01.003 · Cited by 74
Upregulation of Arginase Expression in Wound-Derived Fibroblasts
Witte, M. B., Barbul, A., Schick, M. A., Vogt, N., & Becker, H. D. (2002) · Journal of Surgical Research · doi:10.1006/jsre.2002.6443 · Cited by 73
Nio‐Kobayashi, J., Fujimoto, W., Konno, A., Kon, Y., Owhashi, M., & Iwanaga, T. (2004) · Histochemistry and Cell Biology · doi:10.1007/s00418-004-0654-4 · Cited by 65
TGF-β1 Disrupts Endotoxin Signaling in Microglial Cells through Smad3 and MAPK Pathways
Le, Y., Iribarren, P., Gong, W., Cui, Y., Zhang, X., & Wang, J. M. (2004) · The Journal of Immunology · doi:10.4049/jimmunol.173.2.962 · Cited by 58
Alternative Aβ Immunotherapy Approaches for Alzheimers Disease
Town, T. (2009) · CNS & Neurological Disorders - Drug Targets · doi:10.2174/187152709787847306 · Cited by 42
Inflammation in Parkinson's disease: an update.
Smith, P. F. (2008) · PubMed · Cited by 41
Accumulation of Ym1/2 protein in the mouse olfactory epithelium during regeneration and aging
Giannetti, N., Moyse, E., Ducray, A., Bondier, J., Jourdan, F., Propper, A. Y., & Kästner, A. (2003) · Neuroscience · doi:10.1016/j.neuroscience.2003.09.024 · Cited by 37
Determination of Mammalian Arginase Activity
Kepka‐Lenhart, D., Ash, D. E., & Morris, S. M. (2008) · Methods in enzymology on CD-ROM/Methods in enzymology · doi:10.1016/s0076-6879(07)00813-0 · Cited by 32
TGF-β2reduces nitric oxide synthase mRNA through a ROCK-dependent pathway in airway epithelial cells
Jiang, J., & George, S. C. (2011) · American Journal of Physiology-Lung Cellular and Molecular Physiology · doi:10.1152/ajplung.00464.2010 · Cited by 22
Hiraga, S., Arita, N., Ohnishi, T., Izumoto, S., Taki, T., Higuchi, M., Iwaisako, K., Sakoda, S., Yamamoto, Y., & Hayakawa, T. (1996) · Glia · doi:10.1002/(sici)1098-1136(199611)18:3 · Cited by 5
Cited by
Sorted by citations
Differential Roles of M1 and M2 Microglia in Neurodegenerative Diseases
Tang, Y., & Le, W. (2016) · Molecular Neurobiology · doi:10.1007/s12035-014-9070-5 · Cited by 2,190
Peripheral inflammation and blood–brain barrier disruption: effects and mechanisms
Huang, X., Hussain, B., & Chang, J. (2020) · CNS Neuroscience & Therapeutics · doi:10.1111/cns.13569 · Cited by 759
The biphasic function of microglia in ischemic stroke
Ma, Y., Wang, J., Wang, Y., & Yang, G.-Y. (2017) · Progress in Neurobiology · doi:10.1016/j.pneurobio.2016.01.005 · Cited by 655
Alternatively activated microglia and macrophages in the central nervous system
Franco, R., & Fernández‐Suárez, D. (2015) · Progress in Neurobiology · doi:10.1016/j.pneurobio.2015.05.003 · Cited by 674
The impact of microglial activation on blood-brain barrier in brain diseases
da Fonseca, A. C. C., Matias, D., Garcia, C., Amaral, R., Geraldo, L. H., Freitas, C., & Lima, F. R. S. (2014) · Frontiers in Cellular Neuroscience · doi:10.3389/fncel.2014.00362 · Cited by 572
Metadata
- Authors
- Zhou, X., Spittau, B., & Krieglstein, K.
- Affiliations
- University of Freiburg (DE)
- Corresponding author
- Spittau, Björn
- Krieglstein, Kerstin
- Venue
- Journal of Neuroinflammation
- Published
- 2012-09-04
- Volume
- 9
- Issue
- 1
- Pages
- 210-210
- ISSN
- 1742-2094 (ISSN-L)
- PMC
- PMC3488564
- OpenAlex
- W2128215483
- Cited by
- 159
- References
- 60
- Citations by year
- 2026: 3 · 2025: 12 · 2024: 16 · 2023: 13 · 2022: 11 · 2021: 14 · 2020: 10 · 2019: 10 · 2018: 13 · 2017: 6 · 2016: 16 · 2015: 14 · 2014: 12 · 2013: 9
- FWCI
- 5.63
- Type
- journal article
- Language
- en
- Open access
- gold
- doi.org
- Locations
- Journal of Neuroinflammation (publishedVersion, cc-by)
- Europe PMC (PubMed Central) (publishedVersion, cc-by)
- PubMed Central (publishedVersion, cc-by)
- PubMed (publishedVersion)
- DOAJ (DOAJ: Directory of Open Access Journals) (submittedVersion)
- FreiDok plus (Universitätsbibliothek Freiburg) (submittedVersion)
- Funders
- Deutsche Forschungsgemeinschaft (Kr1477/10-3)
- Topics
- Life Sciences › Neuroscience › Neurology › Neuroinflammation and Neurodegeneration Mechanisms
- Life Sciences › Biochemistry, Genetics and Molecular Biology › Molecular Biology › TGF-β signaling in diseases
- Life Sciences › Immunology and Microbiology › Immunology › Immune cells in cancer
- Keywords
- microglia, alternative activation, M2 microglia, IL-4, Ym1, MAPK signaling, anti-inflammatory cytokines, neuroinflammation, neurodegenerative diseases
- MeSH terms
- Analysis of Variance, Animals, Animals, Newborn, Arginase, beta-N-Acetylhexosaminidases, Brain, Cells, Cultured, Enzyme Inhibitors, Enzyme-Linked Immunosorbent Assay, Mice, Inbred C57BL, Receptors, Cell Surface, RNA, Messenger, Signal Transduction, Interleukin-4, Up-Regulation, Cytokines, Transforming Growth Factor beta, Microglia, Mitogen-Activated Protein Kinases, Lectins, Mice, Interleukin-4 Receptor alpha Subunit
About these checks
Registry, retraction, Cites and statistics results are computed, not judged, with one exception: a printed reference that no index lists is read once by a model before it counts as a citation error. Claims are extracted by a model and kept only when their quote appears verbatim in the text; each cited source is then checked, with a model’s help, for whether it says what the claim relies on. Those verdicts can be wrong — read the claim’s quote and the cited source before relying on one.
Statistics and arithmetic are recomputed, not judged.
Confidence bands are shown only for fields calibrated on our annotated test set. None is calibrated yet, so no band is shown.
What counts as a claim ›How we measure confidence ›How we check this ›
Are you an author, or do you see a problem with this page? Request a review
