

The DOI matches its Crossref record; 32 of the 33 references it cites were found in a registry or an index, and 1 are not checked yet.
GLP-1 secretion by microglial cells and decreased CNS expression in obesity
Open accessAbstract
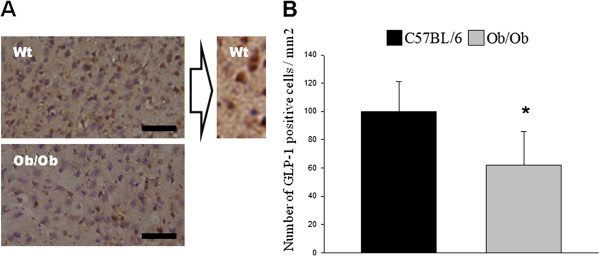
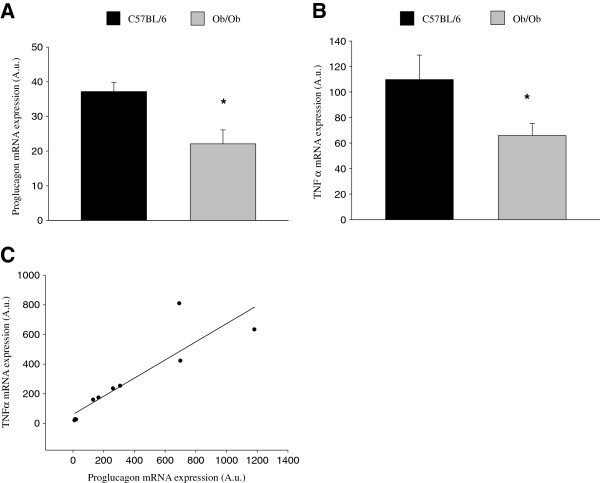
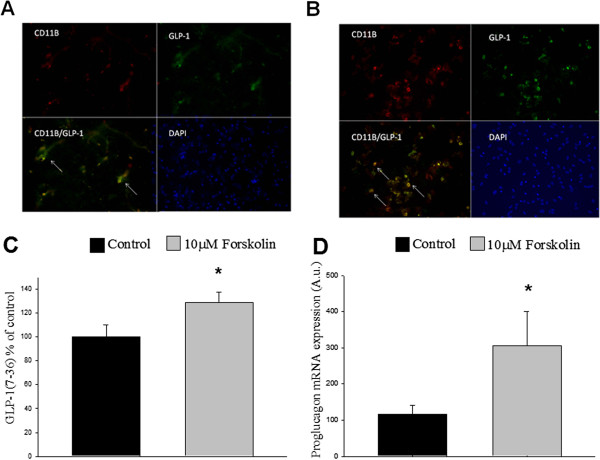
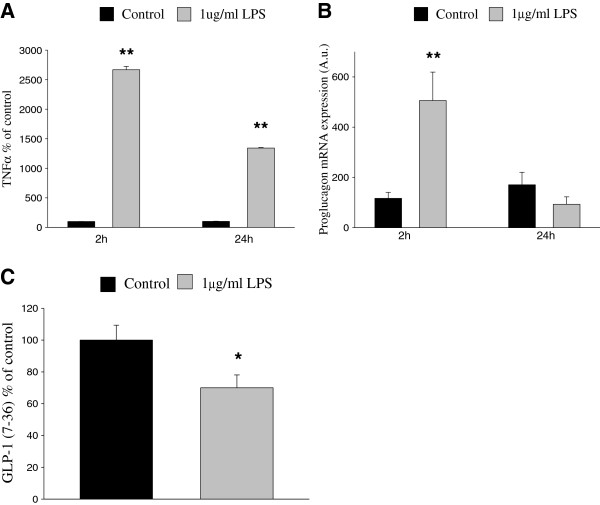
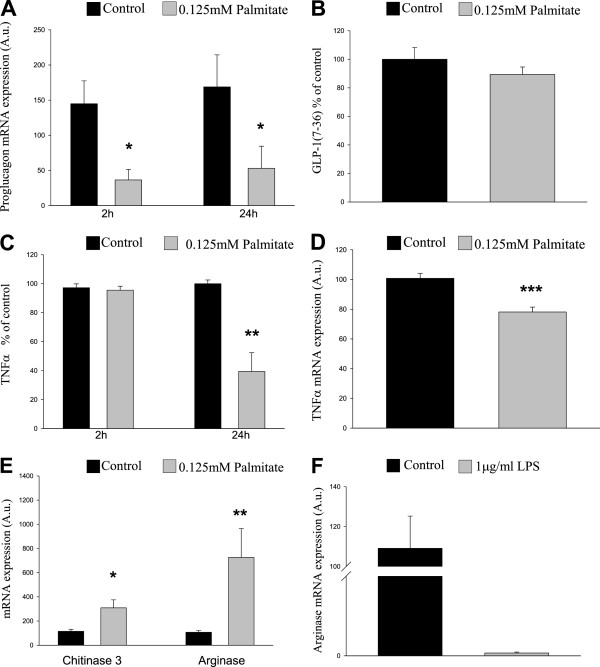
BACKGROUND: Type 2 diabetes (T2D) is a strong risk factor for developing neurodegenerative pathologies. T2D patients have a deficiency in the intestinal incretin hormone GLP-1, which has been shown to exert neuroprotective and anti-inflammatory properties in the brain. METHODS: Here we investigate potential sources of GLP-1 in the CNS and the effect of diabetic conditions on the proglucagon mRNA expression in the CNS. The obese mouse model ob/ob, characterized by its high levels of free fatty acids, and the microglia cell line BV-2 were used as models. mRNA expression and protein secretion were analyzed by qPCR, immunofluorescence and ELISA. RESULTS: We show evidence for microglia as a central source of GLP-1 secretion. Furthermore, we observed that expression and secretion are stimulated by cAMP and dependent on microglial activation state. We also show that insulin-resistant conditions reduce the central mRNA expression of proglucagon. CONCLUSION: The findings that microglial mRNA expression of proglucagon and GLP-1 protein expression are affected by high levels of free fatty acids and that both mRNA expression levels of proglucagon and secretion levels of GLP-1 are affected by inflammatory stimuli could be of pathogenic importance for the premature neurodegeneration and cognitive decline commonly seen in T2D patients, and they may also be harnessed to advantage in therapeutic efforts to prevent or treat such disorders.
Overview
The claims and statistics of this paper haven’t been checked yet.
Run the check — free, no account needed. It reads the open-access text and checks the sources it cites.
Integrity signals
Registry
Cites
Statistics
Figures
Verification
Claims the paper makes
The claims and statistics of this paper haven’t been checked yet.
Run the check — free, no account needed. It reads the open-access text and checks the sources it cites.
Claims other papers make about this one
Each is checked against this paper’s own text: does it say what the citing paper says it does?
The cited source says what the claim attributes to it.
In the citing paper
“GLP-1 is known to be produced in the brain [79] and has many functions including neuroprotection [80–82].”
From Anti-Inflammatory Effects of GLP-1-Based Therapies beyond Glucose Control (2016) · cites this paper as [79]
Self-check
Percentages, sums and reported differences re-computed from the paper’s own numbers.
The self-check needs the paper’s full text.
Citations
Cites
Obese and diabetes: Two mutant genes causing diabetes-obesity syndromes in mice
Coleman, D. L. (1978) · Diabetologia · doi:10.1007/bf00429772 · Cited by 1,307
Repertoire of microglial and macrophage responses after spinal cord injury
David, S., & Kroner, A. (2011) · Nature Reviews Neuroscience · doi:10.1038/nrn3053 · Cited by 1,297
Glucagon-like peptide-1 receptor is involved in learning and neuroprotection
During, M. J., Cao, L., Zuzga, D. S., Francis, J. S., Fitzsimons, H. L., Jiao, X., Bland, R. J., Klugmann, M., Banks, W. A., Drucker, D. J., et al. (2003) · Nature Medicine · doi:10.1038/nm919 · Cited by 851
The role of gut hormones in glucose homeostasis
Drucker, D. J. (2007) · Journal of Clinical Investigation · doi:10.1172/jci30076 · Cited by 628
Expression profiles for macrophage alternative activation genes in AD and in mouse models of AD.
(2006) · Journal of Neuroinflammation · doi:10.1186/1742-2094-3-27 · Cited by 393
Bertilsson, G., Patrone, C., Zachrisson, O., Andersson, A., Dannaeus, K., Heidrich, J., Kortesmaa, J., Mercer, A., Nielsen, E., Rönnholm, H., et al. (2008) · Journal of Neuroscience Research · doi:10.1002/jnr.21483 · Cited by 345
Self-citationLi, Y., Duffy, K. B., Ottinger, M. A., Ray, B., Bailey, J. A., Holloway, H. W., Tweedie, D., Perry, T., Mattson, M. P., Kapogiannis, D., et al. (2010) · Journal of Alzheimer s Disease · doi:10.3233/jad-2010-1314 · Cited by 323
Endothelial inflammation in insulin resistance
SJOHOLM, A., & NYSTROM, T. (2005) · The Lancet · doi:10.1016/s0140-6736(05)70804-7 · Cited by 278
Self-citationThe relationship between Alzheimer's disease and diabetes: Type 3 diabetes?
Kroner, Z. (2009) · PubMed · Cited by 246
Glucagon-like peptide-1 inhibits LPS-induced IL-1β production in cultured rat astrocytes
Iwai, T., Ito, S., Tanimitsu, K., Udagawa, S., & Oka, J.-I. (2006) · Neuroscience Research · doi:10.1016/j.neures.2006.04.008 · Cited by 207
Increased Brain Fatty Acid Uptake in Metabolic Syndrome
Karmi, A., Iozzo, P., Viljanen, A. P. M., Hirvonen, J., Fielding, B. A., Virtanen, K. A., Oikonen, V., Kemppainen, J., Viljanen, T., Guiducci, L., et al. (2010) · Diabetes · doi:10.2337/db09-0138 · Cited by 204
Shafrir, E. (1958) · Journal of Clinical Investigation · doi:10.1172/jci103770 · Cited by 184
Perry, T., Holloway, H. W., Weerasuriya, A., Mouton, P. R., Duffy, K. B., Mattison, J. A., & Greig, N. H. (2006) · Experimental Neurology · doi:10.1016/j.expneurol.2006.09.028 · Cited by 183
BRUBAKER, P. L., Schloos, J., & Drucker, D. J. (1998) · Endocrinology · doi:10.1210/endo.139.10.6228 · Cited by 168
Persson, M., Brantefjord, M., Hansson, E., & Rönnbäck, L. (2005) · Glia · doi:10.1002/glia.20191 · Cited by 154
Isacson, R., Nielsen, E. I., Dannaeus, K., Bertilsson, G., Patrone, C., Zachrisson, O., & Wikström, L. (2010) · European Journal of Pharmacology · doi:10.1016/j.ejphar.2010.10.008 · Cited by 153
Self-citationVrang, N., Hansen, M. B., Larsen, P. J., & Tang‐Christensen, M. (2007) · Brain Research · doi:10.1016/j.brainres.2007.02.043 · Cited by 152
Li, Y., Tweedie, D., Mattson, M. P., Holloway, H. W., & Greig, N. H. (2010) · Journal of Neurochemistry · doi:10.1111/j.1471-4159.2010.06731.x · Cited by 150
Laakso, M., Zilinskaite, J., Hansen, T. F., Boesgaard, T. W., Vänttinen, M., Stančáková, A., Jansson, P., Pellmé, F., Holst, J. J., Kuulasmaa, T., et al. (2007) · Diabetologia · doi:10.1007/s00125-007-0899-2 · Cited by 146
Impairment of Dendritic Cell Functionality and Steady-State Number in Obese Mice
Macia, L., Delacre, M., Abboud, G., Ouk, T., Delanoye, A., Verwaerde, C., Saule, P., & Wolowczuk, I. (2006) · The Journal of Immunology · doi:10.4049/jimmunol.177.9.5997 · Cited by 142
Darsalia, V., Mansouri, S., Ortsäter, H., Olverling, A., Nozadze, N., Krizhanovskii, C., Iverfeldt, K., Tracy, L. M., Grankvist, N., Sjöholm, Å., et al. (2011) · Clinical Science · doi:10.1042/cs20110374 · Cited by 130
Self-citationNishina, P. M., Lowe, S., Wang, J., & Paigen, B. J. (1994) · Metabolism · doi:10.1016/0026-0495(94)90194-5 · Cited by 124
Incidence and Risk Factors for Stroke in Type 2 Diabetic Patients
Giorda, C. B., Avogaro, A., Maggini, M., Lombardo, F. L., Mannucci, E., Turco, S., Alegiani, S. S., Raschetti, R., Velussi, M., Ferrannini, E., et al. (2007) · Stroke · doi:10.1161/01.str.0000260100.71665.2f · Cited by 117
Increases in serum unbound free fatty acid levels following coronary angioplasty
Kleinfeld, A. M., Prothro, D., Brown, D., Davis, R. C., Richieri, G. V., & DeMaria, A. N. (1996) · The American Journal of Cardiology · doi:10.1016/s0002-9149(96)00651-0 · Cited by 111
Williams, D. L. (2009) · Endocrinology · doi:10.1210/en.2009-0220 · Cited by 98
Palmitate and insulin synergistically induce IL-6 expression in human monocytes
Bunn, R. C., Cockrell, G. E., Ou, Y., Thrailkill, K. M., Lumpkin, C. K., & Fowlkes, J. L. (2010) · Cardiovascular Diabetology · doi:10.1186/1475-2840-9-73 · Cited by 86
Krogh‐Madsen, R., Plomgaard, P., Akerstrom, T. C. A., Møller, K., Schmitz, O., & Pedersen, B. K. (2007) · American Journal of Physiology-Endocrinology and Metabolism · doi:10.1152/ajpendo.00507.2007 · Cited by 80
Samokhvalov, V., Bilan, P. J., Schertzer, J. D., Antonescu, C. N., & Klip, A. (2008) · American Journal of Physiology-Endocrinology and Metabolism · doi:10.1152/ajpendo.90667.2008 · Cited by 69
Little, J. P., Madeira, J. M., & Klegeris, A. (2012) · Journal of Alzheimer s Disease · doi:10.3233/jad-2011-111262 · Cited by 45
Ramberg, V., Tracy, L. M., Samuelsson, M., Nilsson, L. N. G., & Iverfeldt, K. (2011) · Journal of Neuroinflammation · doi:10.1186/1742-2094-8-34 · Cited by 33
Self-citationBrubaker, P. L. (1998) · Endocrinology · doi:10.1210/en.139.10.4108 · Cited by 26
Merchenthaler (1999) · doi:10.1002/(sici)1096-9861(19990111)403:2
Cited by
Sorted by citations
Anti-Inflammatory Effects of GLP-1-Based Therapies beyond Glucose Control
Lee, Y.-S., & Jun, H.-S. (2016) · Mediators of Inflammation · doi:10.1155/2016/3094642 · Cited by 530
“GLP-1 is known to be produced in the brain [79] and has many functions including neuroprotection [80–82].”
BackgroundAthauda, D., & Foltynie, T. (2016) · Drug Discovery Today · doi:10.1016/j.drudis.2016.01.013 · Cited by 383
Insulin resistance and Parkinson’s disease: A new target for disease modification?
Athauda, D. S., & Foltynie, T. (2016) · Progress in Neurobiology · doi:10.1016/j.pneurobio.2016.10.001 · Cited by 340
Insulin, IGF-1 and GLP-1 signaling in neurodegenerative disorders: Targets for disease modification?
Bassil, F., Fernagut, P., Bézard, E., & Meissner, W. G. (2014) · Progress in Neurobiology · doi:10.1016/j.pneurobio.2014.02.005 · Cited by 323
GLP-1 and weight loss: unraveling the diverse neural circuitry
Kanoski, S. E., Hayes, M. R., & Skibicka, K. P. (2016) · American Journal of Physiology-Regulatory, Integrative and Comparative Physiology · doi:10.1152/ajpregu.00520.2015 · Cited by 290
Metadata
- Authors
- Kappe, C., Tracy, L. M., Patrone, C., Iverfeldt, K., & Sjöholm, Å.
- Affiliations
- Stockholm University (SE)
- Karolinska Institutet (SE)
- Corresponding author
- Tracy, Linda M
- Iverfeldt, Kerstin
- Sjöholm, Åke
- Venue
- Journal of Neuroinflammation
- Published
- 2012-12
- Volume
- 9
- Issue
- 1
- Pages
- 276-276
- ISSN
- 1742-2094 (ISSN-L)
- PMC
- PMC3546916
- OpenAlex
- W2112292567
- Cited by
- 107
- References
- 32
- Citations by year
- 2026: 6 · 2025: 10 · 2024: 5 · 2023: 9 · 2022: 9 · 2021: 7 · 2020: 11 · 2019: 9 · 2018: 9 · 2017: 10 · 2016: 9 · 2015: 7 · 2014: 3 · 2013: 3
- FWCI
- 2.09
- Type
- journal article
- Language
- en
- Open access
- gold
- doi.org
- Locations
- Journal of Neuroinflammation (publishedVersion, cc-by)
- Europe PMC (PubMed Central) (publishedVersion, cc-by)
- PubMed Central (publishedVersion, cc-by)
- PubMed (publishedVersion)
- DOAJ (DOAJ: Directory of Open Access Journals) (submittedVersion)
- Funders
- Gun och Bertil Stohnes Stiftelse
- AFA Försäkring
- Karolinska Institutet
- Stockholms Läns Landsting
- Topics
- Life Sciences › Neuroscience › Neurology › Neuroinflammation and Neurodegeneration Mechanisms
- Health Sciences › Medicine › Endocrinology, Diabetes and Metabolism › Diabetes Treatment and Management
- Health Sciences › Medicine › Endocrinology, Diabetes and Metabolism › Adipokines, Inflammation, and Metabolic Diseases
- Keywords
- glucagon-like peptide-1, proglucagon, microglia, obesity, type 2 diabetes, neurodegeneration, insulin resistance, free fatty acids, cAMP signaling, microglial activation, neuroinflammation, cognitive decline
- MeSH terms
- Cyclic AMP, Animals, Arginase, Cell Line, Transformed, Central Nervous System, Chitinases, Disease Models, Animal, Gene Expression Regulation, Insulin Resistance, Male, Mice, Inbred C57BL, Mice, Obese, Obesity, Palmitates, Plant Proteins, Polysaccharides, RNA, Messenger, Transfection, Tumor Necrosis Factor-alpha, Microglia, Statistics, Nonparametric, CD11b Antigen, Mice, Glucagon-Like Peptide 1, Proglucagon
About these checks
Registry, retraction, Cites and statistics results are computed, not judged, with one exception: a printed reference that no index lists is read once by a model before it counts as a citation error. Claims are extracted by a model and kept only when their quote appears verbatim in the text; each cited source is then checked, with a model’s help, for whether it says what the claim relies on. Those verdicts can be wrong — read the claim’s quote and the cited source before relying on one.
Statistics and arithmetic are recomputed, not judged.
Confidence bands are shown only for fields calibrated on our annotated test set. None is calibrated yet, so no band is shown.
What counts as a claim ›How we measure confidence ›How we check this ›
Are you an author, or do you see a problem with this page? Request a review
