

The DOI matches its Crossref record; 70 of the 70 references it cites were found in a registry or an index.
Neuroprotective function for ramified microglia in hippocampal excitotoxicity
Open accessAbstract
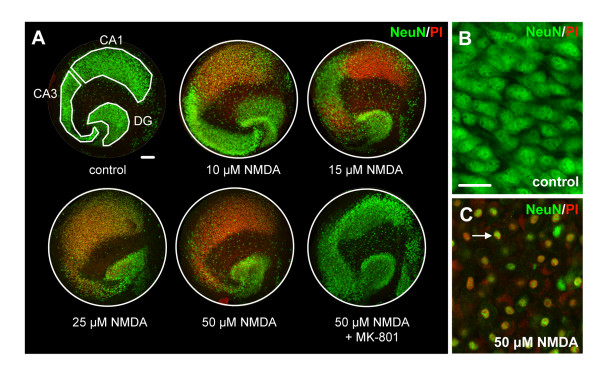
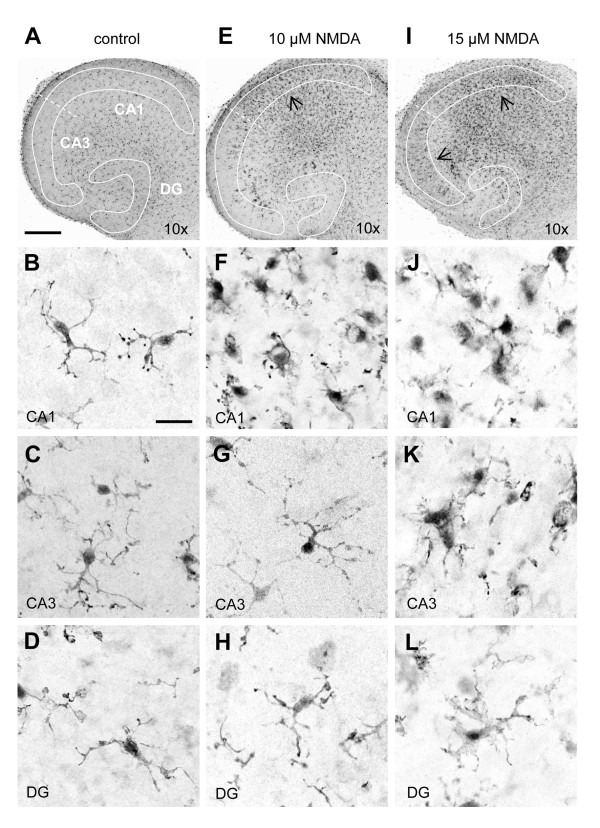
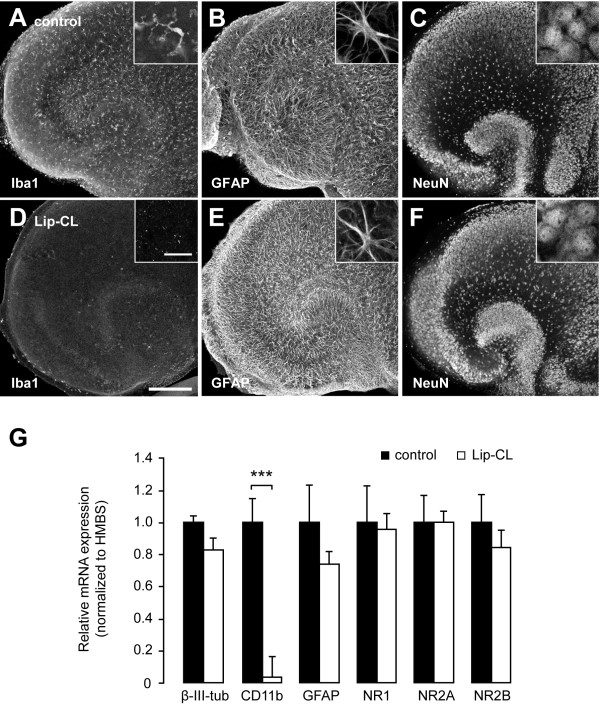
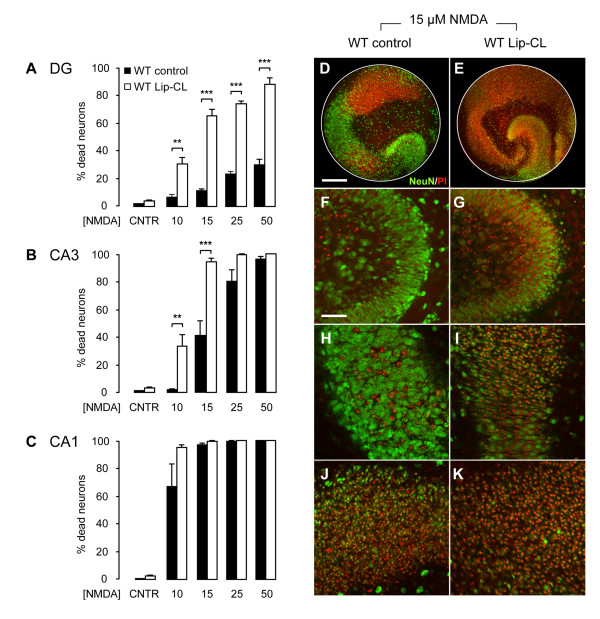
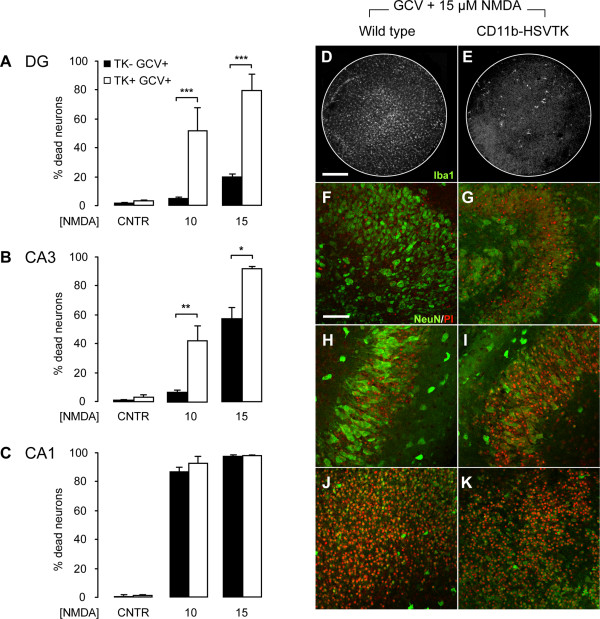
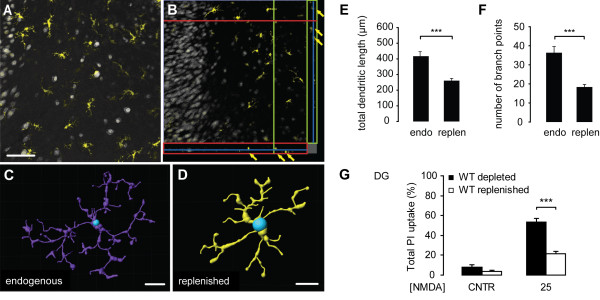
Background: Most of the known functions of microglia, including neurotoxic and neuroprotective properties, are attributed to morphologically-activated microglia. Resting, ramified microglia are suggested to primarily monitor their environment including synapses. Here, we show an active protective role of ramified microglia in excitotoxicity-induced neurodegeneration. Methods: Mouse organotypic hippocampal slice cultures were treated with N-methyl-D-aspartic acid (NMDA) to induce excitotoxic neuronal cell death. This procedure was performed in slices containing resting microglia or slices that were chemically or genetically depleted of their endogenous microglia. Results: Treatment of mouse organotypic hippocampal slice cultures with 10-50 μM N-methyl-D-aspartic acid (NMDA) induced region-specific excitotoxic neuronal cell death with CA1 neurons being most vulnerable, whereas CA3 and DG neurons were affected less. Ablation of ramified microglia severely enhanced NMDA-induced neuronal cell death in the CA3 and DG region rendering them almost as sensitive as CA1 neurons. Replenishment of microglia-free slices with microglia restored the original resistance of CA3 and DG neurons towards NMDA. Conclusions: Our data strongly suggest that ramified microglia not only screen their microenvironment but additionally protect hippocampal neurons under pathological conditions. Morphological activation of ramified microglia is thus not required to influence neuronal survival.
Overview
The claims and statistics of this paper haven’t been checked yet.
Run the check — free, no account needed. It reads the open-access text and checks the sources it cites.
Integrity signals
Registry
Cites
Statistics
Figures
Verification
Claims the paper makes
The claims and statistics of this paper haven’t been checked yet.
Run the check — free, no account needed. It reads the open-access text and checks the sources it cites.
Claims other papers make about this one
Each is checked against this paper’s own text: does it say what the citing paper says it does?
The cited source says what the claim attributes to it.
In the citing paper
“Organotypic hippocampal slice cultures are known to undergo key developmental steps similar to those observed in vivo, including synapse maturation28–31, and have been previously used to study ramified microglia function32.”
From Microglia remodel synapses by presynaptic trogocytosis and spine head filopodia induction (2018) · cites this paper as [32]
Self-check
Percentages, sums and reported differences re-computed from the paper’s own numbers.
The self-check needs the paper’s full text.
Citations
Cites
Analysis of Relative Gene Expression Data Using Real-Time Quantitative PCR and the 2−ΔΔCT Method
Livak, K. J., & Schmittgen, T. D. (2001) · Methods · doi:10.1006/meth.2001.1262 · Cited by 180,860
Resting microglial cells are highly dynamic surveillants of brain parenchyma in vivo
Nimmerjahn, A., Kirchhoff, F., & Helmchen, F. (2005) · Science · doi:10.1126/science.1110647 · Cited by 5,827 · cited 3×
“It is now clear that ramified microglia in vivo continuously scan their environment for homeostatic irregularities [6-8].”
BackgroundMicroglia: a sensor for pathological events in the CNS
Kreutzberg, G. W. (1996) · Trends in Neurosciences · doi:10.1016/0166-2236(96)10049-7 · Cited by 4,396 · cited 2×
“This microglia response has long been defined as microglia activation and based on morphological findings, microglia activation was originally described as a stereotypic and graded process [2,5].”
BackgroundATP mediates rapid microglial response to local brain injury in vivo
Davalos, D., Grutzendler, J., Yang, G., Kim, J. V., Zuo, Y., Jung, S., Littman, D. R., Dustin, M. L., & Gan, W.-B. (2005) · Nature Neuroscience · doi:10.1038/nn1472 · Cited by 3,913 · cited 3×
“It is now clear that ramified microglia in vivo continuously scan their environment for homeostatic irregularities [6-8].”
BackgroundMicroglia: Active sensor and versatile effector cells in the normal and pathologic brain
Hanisch, U.-K., & Kettenmann, H. (2007) · Nature Neuroscience · doi:10.1038/nn1997 · Cited by 3,676 · cited 3×
“This view of microglia function has been challenged in the last years [4].”
BackgroundA simple method for organotypic cultures of nervous tissue
Stoppini, L., Buchs, P., & Muller, D. (1991) · Journal of Neuroscience Methods · doi:10.1016/0165-0270(91)90128-m · Cited by 3,096 · cited 1×
“Organotypic hippocampal slice cultures were prepared as described previously [27] with minor modifications.”
van Rooijen, N., & Sanders, A. (1994) · Journal of Immunological Methods · doi:10.1016/0022-1759(94)90012-4 · Cited by 1,763 · cited 1×
“Multi-lamellar CL2MDP (clodronate)-liposomes (Lip-CL) were obtained from the Department of Molecular Cell Biology of the Free University of Amsterdam, The Netherlands (for an extensive preparation protocol see [26]).”
MethodMicroglia as a source and target of cytokines
Hanisch, U. (2002) · Glia · doi:10.1002/glia.10161 · Cited by 1,645
Onset and Progression in Inherited ALS Determined by Motor Neurons and Microglia
Boillée, S., Yamanaka, K., Lobsiger, C. S., Copeland, N. G., Jenkins, N. A., Kassiotis, G., Kollias, G., & Cleveland, D. W. (2006) · Science · doi:10.1126/science.1123511 · Cited by 1,623 · cited 2×
“However, microglial neurotoxicity can occur in case of overshooting and uncontrolled stimulation of microglia [3,17] or when microglia function is impaired [15,18,19].”
BackgroundMicroglial interactions with synapses are modulated by visual experience
Tremblay, M.-È., Lowery, R. L., & Majewska, A. K. (2010) · PLoS Biology · doi:10.1371/journal.pbio.1000527 · Cited by 1,542 · cited 1×
“The more recent findings that ramified microglia contact active synapses [20,21], suggests a cell-cell interaction between ramified microglia and neurons, which however, is not yet understood.”
Background
Cited by
Sorted by citations
Microglia emerge from erythromyeloid precursors via Pu.1- and Irf8-dependent pathways
Kierdorf, K., Erny, D., Goldmann, T., Sander, V., Schulz, C., Perdiguero, E. G., Wieghofer, P., Heinrich, A., Riemke, P., Hölscher, C., et al. (2013) · Nature Neuroscience · doi:10.1038/nn.3318 · Cited by 1,457
Self-citationMicroglia remodel synapses by presynaptic trogocytosis and spine head filopodia induction
Weinhard, L., di Bartolomei, G., Bolasco, G., Machado, P., Schieber, N. L., Neniskyte, U., Exiga, M., Vadisiute, A., Raggioli, A., Schertel, A., et al. (2018) · Nature Communications · doi:10.1038/s41467-018-03566-5 · Cited by 790
Neuroinflammation: The role and consequences
Lyman, M., Lloyd, D. G., Ji, X., Vizcaychipi, M. P., & Ma, D. (2013) · Neuroscience Research · doi:10.1016/j.neures.2013.10.004 · Cited by 776
Filipello, F., Morini, R., Corradini, I., Zerbi, V., Canzi, A., Michalski, B., Erreni, M., Markicevic, M., Starvaggi-Cucuzza, C., Otero, K., et al. (2018) · Immunity · doi:10.1016/j.immuni.2018.04.016 · Cited by 695
Valdearcos, M., Robblee, M. M., Benjamin, D. I., Nomura, D. K., Xu, A. W., & Koliwad, S. K. (2014) · Cell Reports · doi:10.1016/j.celrep.2014.11.018 · Cited by 629
“Depleting Microglia from Hypothalamic Slice Cultures Microglia were depleted from hypothalamic slice cultures without altering other cell types by modifying prior approaches (Okamura et al., 2012; Vinet et al., 2012).”
Szalay, G., Martinecz, B., Lénárt, N., Környei, Z., Orsolits, B., Judák, L., Császár, E., Fekete, R., West, B. L., Katona, G., et al. (2016) · Nature Communications · doi:10.1038/ncomms11499 · Cited by 573
Quantitating the subtleties of microglial morphology with fractal analysis
Karperien, A., Ahammer, H., & Jelinek, H. F. (2013) · Frontiers in Cellular Neuroscience · doi:10.3389/fncel.2013.00003 · Cited by 541
“Microglia are presumed to reside in all mammals and have been found in several other vertebrates and invertebrates (e.g., birds, frogs, fish, snails, and leeches) (Dowding et al., 1991; Dowding and Scholes, 1993; Sonetti et al., 1994; Magazine et al., 1996; Dobrenis, 1998; Bernhardi and Nicholls, 1999; McMenamin, 1999…”
BackgroundInfluentialEyo, U. B., Peng, J., Swiatkowski, P., Mukherjee, A., Bispo, A., & Wu, L.-J. (2014) · Journal of Neuroscience · doi:10.1523/jneurosci.0416-14.2014 · Cited by 509
“induced delayed neurotoxicity evidence by propidium iodide uptake (albeit after prolonged periods of exposure) in organotypic hippocampal slices (Vinet et al., 2012).”
BackgroundMorales, I., Guzmán-MartÃnez, L., Cerda-Troncoso, C., FarÃas, G. A., & Maccioni, R. B. (2014) · Frontiers in Cellular Neuroscience · doi:10.3389/fncel.2014.00112 · Cited by 490
“Furthermore, in their resting form they also are involved in other functions such as neurogenesis, neuroprotection and synaptic pruning, which has been found to be complement dependent (Sierra et al., 2010; Vinet et al., 2012).”
BackgroundMicroglia morphophysiological diversity and its implications for the CNS
Vidal-Itriago, A., Radford, R. A. W., Aramideh, J. A., Maurel, C., Scherer, N. M., Don, E. K., Lee, A., Chung, R. S., Graeber, M. B., & Morsch, M. (2022) · Frontiers in Immunology · doi:10.3389/fimmu.2022.997786 · Cited by 451
“Another study used mouse organotypic hippocampal slice cultures and showed that ramified microglia exert neuroprotective effects upon neurons during NMDA-induced excitotoxicity (111).”
BackgroundValproic Acid and Epilepsy: From Molecular Mechanisms to Clinical Evidences
Romoli, M., Mazzocchetti, P., D’Alonzo, R., Siliquini, S., Rinaldi, V. E., Verrotti, A., Calabresi, P., & Costa, C. (2018) · Current Neuropharmacology · doi:10.2174/1570159x17666181227165722 · Cited by 390
Myeloid Cells in the Central Nervous System
Herz, J., Filiano, A. J., Wiltbank, A. T., Yogev, N., & Kipnis, J. (2017) · Immunity · doi:10.1016/j.immuni.2017.06.007 · Cited by 345
Inflammation and the neural diathesis-stress hypothesis of schizophrenia: a reconceptualization
Howes, O. D., & McCutcheon, R. (2017) · Translational Psychiatry · doi:10.1038/tp.2016.278 · Cited by 288
Activation of Neuronal NMDA Receptors Triggers Transient ATP-Mediated Microglial Process Outgrowth
Dissing-Olesen, L., LeDue, J. M., Rungta, R. L., Hefendehl, J. K., Choi, H. B., & MacVicar, B. A. (2014) · Journal of Neuroscience · doi:10.1523/jneurosci.0405-14.2014 · Cited by 286
“Microglia-derived neurotrophins have been reported to promote synapse formation (Parkhurst et al., 2013) and ramified microglia limit neuronal degeneration following excessive NMDAR stimulation (Vinet et al., 2012).”
BackgroundHellwig, S., Brioschi, S., Dieni, S., Frings, L., Masuch, A., Blank, T., & Biber, K. (2016) · Brain, Behavior, and Immunity · doi:10.1016/j.bbi.2015.11.008 · Cited by 252
“Three-dimensional (3D)-reconstructions were performed using IMARIS Filament Tracer (www.bitplane.com), as previously described (Vinet et al., 2012).”
MethodSelf-citationMast cells, glia and neuroinflammation: partners in crime?
Skaper, S. D., Facci, L., & Giusti, P. (2013) · Immunology · doi:10.1111/imm.12170 · Cited by 257
Goshi, N., Morgan, R. K., Lein, P. J., & Şeker, E. (2020) · Journal of Neuroinflammation · doi:10.1186/s12974-020-01819-z · Cited by 248
Wang, X., Zhao, L., Zhang, J., Fariss, R. N., Ma, W., Kretschmer, F., Wang, M., Qian, H., Badea, T. C., Diamond, J. S., et al. (2016) · Journal of Neuroscience · doi:10.1523/jneurosci.3575-15.2016 · Cited by 249
“, 2013) and provide safeguards against neural injury in a number of in vitro (Montero et al., 2009; Vinet et al., 2012) and in vivo (Lalancette-Hébert et al.”
BackgroundThe Ischemic Environment Drives Microglia and Macrophage Function
Fumagalli, S., Perego, C., Pischiutta, F., Zanier, E. R., & Simoni, M. G. D. (2015) · Frontiers in Neurology · doi:10.3389/fneur.2015.00081 · Cited by 261
Reber, S. O., Siebler, P. H., Donner, N. C., Morton, J. T., Smith, D. G., Kopelman, J. M., Lowe, K. R., Wheeler, K. J., Fox, J. H., Hassell, J. E., et al. (2016) · Proceedings of the National Academy of Sciences · doi:10.1073/pnas.1600324113 · Cited by 233
“vaccae immunization altered the number or morphological properties of microglia within the brain, we performed immunohistochemical staining of ionized calcium-binding adapter molecule 1 (Iba1), a 17-kDa actin-binding protein specifically and constitutively expressed in microglia (35, 36) that is an immunohistochemical…”
Microglia and mast cells: two tracks on the road to neuroinflammation
Skaper, S. D., Giusti, P., & Facci, L. (2012) · The FASEB Journal · doi:10.1096/fj.11-197194 · Cited by 235
“hippocampal neurons from excitotoxicity (139).”
Morphology of Microglia Across Contexts of Health and Disease
Savage, J. C., Carrier, M., & Tremblay, M.-È. (2019) · Methods in Molecular Biology · doi:10.1007/978-1-4939-9658-2_2 · Cited by 232
Microglial aging in the healthy CNS: phenotypes, drivers, and rejuvenation
Wong, W. T. (2013) · Frontiers in Cellular Neuroscience · doi:10.3389/fncel.2013.00022 · Cited by 241
“With regards to the latter function, the presence of ramified microglia have been associated with the provision of trophic support for neurons; neuronal cell death in injury models increases with maneuvers that result in the depletion of microglia (Montero et al., 2009; Vinet et al., 2012).”
BackgroundBenarroch, E. E. (2013) · Neurology · doi:10.1212/wnl.0b013e3182a4a577 · Cited by 232
“In case of a small disturbance, microglia may provide trophic support and reduce risk of excitotoxic damage to neurons; depletion of microglia increases neuronal cell death in several models of excitotoxicity.(27,28) These neuroprotective effects may involve microglial production of growth factors such as GDNF(29) and…”
Natrajan, M. S., de la Fuente, A. G., Crawford, A. H., Linehan, E., Núñez, V., Johnson, K. R., Wu, T., Fitzgerald, D. C., Ricote, M., Bielekova, B., et al. (2015) · Brain · doi:10.1093/brain/awv289 · Cited by 225
TLR4-activated microglia require IFN-γ to induce severe neuronal dysfunction and death in situ
Papageorgiou, I. E., Lewen, A., Galow, L. V., Cesetti, T., Scheffel, J., Regen, T., Hanisch, U., & Kann, O. (2015) · Proceedings of the National Academy of Sciences · doi:10.1073/pnas.1513853113 · Cited by 225
“These experiments demonstrate that slice cultures are a reliable model for effective tissue exposure and induction of diverse reactive microglial phenotypes (33, 34).”
BackgroundMethodMicroglia regulate blood clearance in subarachnoid hemorrhage by heme oxygenase-1
Schallner, N., Pandit, R., LeBlanc, R. H., Thomas, A. J., Ogilvy, C. S., Zuckerbraun, B. S., Gallo, D. J., Otterbein, L. E., & Hanafy, K. A. (2015) · Journal of Clinical Investigation · doi:10.1172/jci78443 · Cited by 214
Microglial PGC-1α protects against ischemic brain injury by suppressing neuroinflammation
Han, B., Jiang, W., Cui, P., Zheng, K., Dang, C., Wang, J., Li, H., Chen, L., Zhang, R., Wang, Q. M., et al. (2021) · Genome Medicine · doi:10.1186/s13073-021-00863-5 · Cited by 211
“In contrast, ramified microglia could promote neuronal survival after hippocampal excitotoxicity [41].”
BackgroundInnate Immunity and Neuroinflammation
Shastri, A., Bonifati, D. M., & Kishore, U. (2013) · Mediators of Inflammation · doi:10.1155/2013/342931 · Cited by 207
“The microglial cells in resting form have been shown to be involved in other functions such as neurogenesis [5], neuroprotection [6] and synaptic pruning [7], which has been found to be”
BackgroundNemes-Baran, A. D., White, D. R., & DeSilva, T. M. (2020) · Cell Reports · doi:10.1016/j.celrep.2020.108047 · Cited by 196
“Recent literature highlights their importance in performing surveillance and neuroprotective functions (Ueno et al., 2013; Vinet et al., 2012; Davalos et al., 2005; Nimmerjahn et al., 2005).”
BackgroundAhmad, M. H., Fatima, M., & Mondal, A. C. (2018) · Journal of Clinical Neuroscience · doi:10.1016/j.jocn.2018.10.034 · Cited by 201
Hovens, I. B., Nyakas, C. J., & Schoemaker, R. (2014) · Neuroimmunology and Neuroinflammation · doi:10.4103/2347-8659.139719 · Cited by 186
“widely employed as an immunohistochemical marker for both ramified and activated microglia.[9,10] IBA-1”
BackgroundMethodAbiega, O., Beccari, S., Díaz‐Aparicio, I., Nadjar, A., Layé, S., Leyrolle, Q., Gómez‐Nicola, D., Domercq, M., Pérez‐Samartín, A., Sánchez-Zafra, V., et al. (2016) · PLoS Biology · doi:10.1371/journal.pbio.1002466 · Cited by 190
“Organotypic hippocampal slice cultures were prepared as described previously [83] with minor modifications.”
MethodCX3CR1 deficiency induces an early protective inflammatory environment in ischemic mice
Fumagalli, S., Perego, C., Ortolano, F., & Simoni, M. G. D. (2013) · Glia · doi:10.1002/glia.22474 · Cited by 189
Young microglia restore amyloid plaque clearance of aged microglia
Daria, A., Colombo, A., Llovera, G., Hampel, H., Willem, M., Liesz, A., Haass, C., & Tahirovic, S. (2017) · The EMBO Journal · doi:10.15252/embj.201694591 · Cited by 174
“…analyze the contribution of microglial cells in amyloid plaque clearance, we pharmacologically depleted either young or old microglia with the macrophage toxin clodronate using established protocols (Kohl et al , 2003; Kreutz et al , 2009; Vinet et al , 2012; Ji et al , 2013; Hellwig et al , 2015).”
Neurotransmitter signaling in the pathophysiology of microglia
Domercq, M., Vázquez‐Villoldo, N., & Matute, C. (2013) · Frontiers in Cellular Neuroscience · doi:10.3389/fncel.2013.00049 · Cited by 174
“However, ablation of ramified microglia in the latter two areas exacerbates neuronal cell death, suggesting a protective role of surveying microglia in these Frontiers in Cellular Neuroscience www.frontiersin.org April 2013 | Volume 7 | Article 49 | 10 areas (Vinet et al., 2012).”
BackgroundTodd, L. J., Palazzo, I., Suarez, L., Liu, X., Volkov, L. I., Hoang, T. V., Campbell, W. A., Blackshaw, S., Quan, N., & Fischer, A. J. (2019) · Journal of Neuroinflammation · doi:10.1186/s12974-019-1505-5 · Cited by 164
Neuron–Microglia Interactions in Mental Health Disorders: “For Better, and For Worse”
Wohleb, E. S. (2016) · Frontiers in Immunology · doi:10.3389/fimmu.2016.00544 · Cited by 170
“In separate studies microglia were shown to play a neuroprotective role during excitotoxic injury, with microglia depletion leading to enhanced susceptibility to neuronal death (114).”
BackgroundGirard, S., Brough, D., López‐Castejón, G., Giles, J. A., Rothwell, N. J., & Allan, S. M. (2013) · Glia · doi:10.1002/glia.22478 · Cited by 162
Ryan, K. J., White, C. C., Patel, K. R., Xu, J., Olah, M., Replogle, J. M., Frangieh, M., Cimpean, M., Winn, P. A., McHenry, A., et al. (2017) · Science Translational Medicine · doi:10.1126/scitranslmed.aai7635 · Cited by 159
Priming of microglia with IFN-γ slows neuronal gamma oscillations in situ
Ta, T., Dikmen, H. O., Schilling, S., Chausse, B., Lewen, A., Hollnagel, J., & Kann, O. (2019) · Proceedings of the National Academy of Sciences · doi:10.1073/pnas.1813562116 · Cited by 157
Microglia after Seizures and in Epilepsy
Hiragi, T., Ikegaya, Y., & Koyama, R. (2018) · Cells · doi:10.3390/cells7040026 · Cited by 165
“It has been suggested that short-term microglial activation is beneficial [85,86] whereas chronic microglial activation is detrimental [87] for the pathogenesis of epilepsy.”
BackgroundChew, L.-J., Fusar-Poli, P., & Schmitz, T. (2013) · Developmental Neuroscience · doi:10.1159/000346157 · Cited by 154
Sabogal-Guáqueta, A. M., Hobbie, F., Keerthi, A., Oun, A., Kortholt, A., Boddeke, E., & Dolga, A. (2019) · Biomedicine & Pharmacotherapy · doi:10.1016/j.biopha.2019.109295 · Cited by 154
“Organotypic hippocampal slice cultures and Maintenance Organotypic hippocampal slice cultures (OHSC) were prepared from P0-3 mouse pups according to the mentioned protocol with slight modifications [32].”
MethodCellular and Molecular Characterization of Microglia: A Unique Immune Cell Population
Sousa, C., Biber, K. P. H., & Michelucci, A. (2017) · Frontiers in Immunology · doi:10.3389/fimmu.2017.00198 · Cited by 159
“Taking advantage of the OHSC model, the laboratory of Knut Biber in Freiburg expanded their use and implemented this culture system to study adult microglia physiology (114, 115).”
MethodSelf-citationMicroglia and Monocyte-Derived Macrophages in Stroke
Kim, E., & Cho, S. (2016) · Neurotherapeutics · doi:10.1007/s13311-016-0463-1 · Cited by 159
“cose deprivation-induced neuronal cell death [61, 62].”
Dourado, N. S., Souza, C. D. S., de Almeida, M. M. A., da Silva, A. B., dos Santos, B. L., da Silva, V. D. A., de Assis, A. M., da Silva, J. S., Souza, D. O., Costa, M. D. F. D., et al. (2020) · Frontiers in Aging Neuroscience · doi:10.3389/fnagi.2020.00119 · Cited by 159
Zanier, E. R., Fumagalli, S., Perego, C., Pischiutta, F., & De Simoni, M.-G. (2015) · Intensive Care Medicine Experimental · doi:10.1186/s40635-015-0039-0 · Cited by 147
“Notably, morphological features provide information on the functional commitment of M/M [11-13].”
BackgroundHernández‐Rabaza, V., Cabrera‐Pastor, A., Taoro‐González, L., Malaguarnera, M., Agustí, A., Llansola, M., & Felipo, V. (2016) · Journal of Neuroinflammation · doi:10.1186/s12974-016-0505-y · Cited by 144
Ma, T., Gong, K., Ao, Q., Yan, Y., Song, B., Huang, H., Zhang, X., & Gong, Y. (2013) · Cell Transplantation · doi:10.3727/096368913x672181 · Cited by 146
“Besides, in an excitotoxicity-induced neurodegenerative model, ramified microglia exerted beneficial effects in providing neuronal resistance toward excitotoxic insults (46).”
BackgroundWhat is microglia neurotoxicity (Not)?
Biber, K. P. H., Owens, T., & Boddeke, E. (2014) · Glia · doi:10.1002/glia.22654 · Cited by 146
Self-citationLannes, N., Eppler, E., Etemad, S., Yotovski, P., & Filgueira, L. (2017) · Oncotarget · doi:10.18632/oncotarget.23106 · Cited by 155
“Under physiological conditions, ramified, resting microglia provides a neuroprotective environment [211, 212].”
BackgroundAlzheimer's Disease: The Role of Microglia in Brain Homeostasis and Proteopathy
Clayton, K. A., Enoo, A. A. V., & Ikezu, T. (2017) · Frontiers in Neuroscience · doi:10.3389/fnins.2017.00680 · Cited by 137
“However, this was not fully reproduced in clinical trials (Vlad et al., 2008; Imbimbo et al., 2010; Breitner et al., 2011).”
BackgroundMicroglial Contact Prevents Excess Depolarization and Rescues Neurons from Excitotoxicity
Kato, G., Inada, H., Wake, H., Akiyoshi, R., Miyamoto, A., Eto, K., Ishikawa, T., Moorhouse, A. J., Strassman, A. M., & Nabekura, J. (2016) · eNeuro · doi:10.1523/eneuro.0004-16.2016 · Cited by 128
“…protective in brain pathologies (Biber et al., 2014), and, indeed, pre-conditioned activated microglia may in fact reduce seizure threshold (Mirrione et al., 2010) while nonactivated ramified microglia can also be protective against excitotoxicity in cultured neuronal models (Vinet et al., 2012).”
BackgroundSkaper, S. D., Facci, L., & Giusti, P. (2013) · Molecular Neurobiology · doi:10.1007/s12035-013-8487-6 · Cited by 130
“Microglia may also protect hippocampal neurons from excitotoxicity [86].”
BackgroundThe brain’s best friend: microglial neurotoxicity revisited
Hellwig, S., Heinrich, A., & Biber, K. (2013) · Frontiers in Cellular Neuroscience · doi:10.3389/fncel.2013.00071 · Cited by 126
“These findings convincingly show not only that microglia have a neuroprotective capacity, but also that this property applies to ramified microglia (Vinet et al., 2012).”
BackgroundMethodResultInfluentialSkaper, S. D., & Facci, L. (2012) · Philosophical Transactions of the Royal Society B Biological Sciences · doi:10.1098/rstb.2011.0391 · Cited by 121
Early activation of microglia and astrocytes in mouse models of spinocerebellar ataxia type 1
Cvetanović, M., Ingram, M., Orr, H. T., & Opal, P. (2015) · Neuroscience · doi:10.1016/j.neuroscience.2015.01.003 · Cited by 117
Hovens, I. B., van Leeuwen, B. L., Nyakas, C. J., Heineman, E., van der Zee, E. A., & Schoemaker, R. G. (2014) · Neurobiology of Learning and Memory · doi:10.1016/j.nlm.2014.11.009 · Cited by 113
“This approach may lead to incomplete assumptions, since regional differences in microglial reactivity and vulnerability to inflammatory signaling exist throughout the brain (Olah et al., 2011; Vinet et al., 2012; Yirmiya and Goshen, 2011).”
Ma, W., Cojocaru, R. I., Gotoh, N., Gieser, L. M., Villasmil, R., Cogliati, T., Swaroop, A., & Wong, W. T. (2013) · Neurobiology of Aging · doi:10.1016/j.neurobiolaging.2013.03.022 · Cited by 108
“These dynamic and repeated cell-cell contacts are thought to subserve constitutive functions of synapse regulation and neuronal support (Paolicelli et al. 2011; Schafer et al. 2012b; Vinet et al. 2012).”
BackgroundMicroglia trigger astrocyte-mediated neuroprotection via purinergic gliotransmission
Shinozaki, Y., Nomura, M., Iwatsuki, K., Moriyama, Y., Gachet, C., & Koizumi, S. (2014) · Scientific Reports · doi:10.1038/srep04329 · Cited by 104
The role of microglia in brain maintenance: implications for Rett syndrome
Derecki, N. C., Cronk, J. C., & Kipnis, J. (2012) · Trends in Immunology · doi:10.1016/j.it.2012.10.002 · Cited by 106
Neuroinflammation in Sepsis: Molecular Pathways of Microglia Activation
Moraes, C. A., Zaverucha-do-Valle, C., Fleurance, R., Sharshar, T., Bozza, F. A., & d’Avila, J. C. (2021) · Pharmaceuticals · doi:10.3390/ph14050416 · Cited by 105
Punicalagin inhibits neuroinflammation in LPS‐activated rat primary microglia
Olajide, O. A., Kumar, A., Velagapudi, R., Okorji, U. P., & Fiebich, B. L. (2014) · Molecular Nutrition & Food Research · doi:10.1002/mnfr.201400163 · Cited by 94
“Organotypic hippocampal slice cultures were prepared as described previously [9].”
MethodA2E accumulation influences retinal microglial activation and complement regulation
Ma, W., Coon, S., Zhao, L., Fariss, R. N., & Wong, W. T. (2013) · Neurobiology of Aging · doi:10.1016/j.neurobiolaging.2012.06.010 · Cited by 92
“…ability of microglia to provide neuroprotection to neurons has been previously documented in the number of injury/disease contexts such as metabolic impairment (Park et al. 2001), nitric oxide-induced injury (Toku et al. 1998), ischemia (Madinier et al. 2009) and excitotoxicity (Vinet et al. 2012).”
BackgroundColeman, L. G., Zou, J., & Crews, F. T. (2020) · Journal of Neuroinflammation · doi:10.1186/s12974-019-1678-y · Cited by 90
Schilling, S., Chausse, B., Dikmen, H. O., Almouhanna, F., Hollnagel, J., Lewen, A., & Kann, O. (2021) · Brain Behavior and Immunity · doi:10.1016/j.bbi.2021.05.013 · Cited by 91
Hellwig, S., Masuch, A., Nestel, S., Katzmarski, N., Meyer-Luehmann, M., & Biber, K. (2015) · Scientific Reports · doi:10.1038/srep14624 · Cited by 91
Self-citationA survey of neuroimmune changes in pregnant and postpartum female rats
Haim, A., Julian, D. L., Albin-Brooks, C., Brothers, H. M., Lenz, K. M., & Leuner, B. (2016) · Brain Behavior and Immunity · doi:10.1016/j.bbi.2016.09.026 · Cited by 86
“Microglia with long, ramified processes are thought to be actively surveying the environment for debris, dying cells and pathogens (Nimmerjahn et al., 2005; Vinet et al., 2012; Wake et al., 2013).”
Pusic, K. M., Pusic, A. D., Kemme, J., & Kraig, R. P. (2014) · Glia · doi:10.1002/glia.22672 · Cited by 85
“Clodronate, a drug that initiates apoptosis when present in sufficiently high concentrations within a cell, was packaged into artificially prepared bilipid vesicles (liposomes) to allow ample uptake by phagocytic cells (van Rooijen, 1989; Vinet et al., 2012).”
InfluentialMechanism of microglia neuroprotection: Involvement of P2X 7,TNF α, and valproic acid
Masuch, A., Shieh, C., van Rooijen, N., van Calker, D., & Biber, K. (2016) · Glia · doi:10.1002/glia.22904 · Cited by 81
“Indeed, we recently demonstrated a neuroprotective function of ramified microglia in OHSC using microglia free and replenished OHSC (Vinet et al., 2012).”
BackgroundMethodInfluentialSelf-citationRéus, G. Z., da Silva, R. H., de Moura, A. B., Presa, J. F., Abelaira, H. M., Abatti, M. R., Vieira, A. A. D. S., Pescador, B., Michels, M., Ignácio, Z. M., et al. (2018) · Molecular Neurobiology · doi:10.1007/s12035-018-1161-2 · Cited by 82
Ratnayake, U., Quinn, T. A., Castillo-Melendez, M., Dickinson, H., & Walker, D. W. (2012) · Brain Behavior and Immunity · doi:10.1016/j.bbi.2012.08.011 · Cited by 75
“In particular, it has been shown that ramified microglia are essential in protecting hippocampus neurons under pathological conditions (Vinet et al., 2012).”
BackgroundChausse, B., Lewen, A., Poschet, G., & Kann, O. (2020) · Brain Behavior and Immunity · doi:10.1016/j.bbi.2020.05.052 · Cited by 74
Kaur, T., Clayman, A. C., Nash, A. J., Schrader, A. D., Warchol, M. E., & Ohlemiller, K. K. (2019) · Frontiers in Neuroscience · doi:10.3389/fnins.2019.00620 · Cited by 73
Delbridge, A. R. D., Huh, D., Brickelmaier, M., Burns, J. C., Roberts, C., Challa, R., Raymond, N., Cullen, P., Carlile, T. M., Ennis, K. A., et al. (2020) · Frontiers in Cellular Neuroscience · doi:10.3389/fncel.2020.592005 · Cited by 72
The role of inflammation in epileptogenesis
Meng, F., & Yao, L. (2020) · Acta Epileptologica · doi:10.1186/s42494-020-00024-y · Cited by 75
“It has been indicated that acute activation of microglia will play a neuroprotective role [126], while chronicallyactivated microglia might be neurotoxic.”
BackgroundPeña‐Altamira, E., Prati, F., Massenzio, F., Virgili, M., Contestabile, A., Bolognesi, M. L., & Monti, B. (2015) · Expert Opinion on Therapeutic Targets · doi:10.1517/14728222.2016.1121237 · Cited by 70
“additionally protect hippocampal neurons under these pathological conditions.[18] The novel understanding of microglial morphology and functions obviously ren-”
BackgroundSystemic immune activation shapes stroke outcome
Murray, K. N., Buggey, H., Dénes, Á., & Allan, S. M. (2012) · Molecular and Cellular Neuroscience · doi:10.1016/j.mcn.2012.09.004 · Cited by 70
Dikmen, H. O., Hemmerich, M., Lewen, A., Hollnagel, J., Chausse, B., & Kann, O. (2020) · Journal of Neuroinflammation · doi:10.1186/s12974-020-01903-4 · Cited by 69
“To finally assess the role of microglia, we exposed slice cultures to liposome-encapsulated clodronate [31].”
Liu, L., Xu, Y., Dai, H., Tan, S., Mao, X., & Chen, Z. (2020) · Cell & Bioscience · doi:10.1186/s13578-020-00387-2 · Cited by 68
Fractal, Multifractal, and Lacunarity Analysis of Microglia in Tissue Engineering
Karperien, A., & Jelinek, H. F. (2015) · Frontiers in Bioengineering and Biotechnology · doi:10.3389/fbioe.2015.00051 · Cited by 66
“…in virtually everything that goes on in the brain, from mediating behavioral effects of emotional stress (Hinwood et al., 2013) to autism (Maezawa www.frontiersin.org April 2015 | Volume 3 | Article 51 | 1 et al., 2011; Morgan et al., 2012) to cleaning up after a stroke (Vinet et al., 2012).”
BackgroundSurgery-induced behavioral changes in aged rats
Hovens, I. B., Schoemaker, R. G., van der Zee, E. A., Heineman, E., Nyakas, C. J., & van Leeuwen, B. L. (2013) · Experimental Gerontology · doi:10.1016/j.exger.2013.07.011 · Cited by 66
“In accordance with our findings, Vinet et al. (2012) 109 CHAPTER 5 recently reported increased microglia activation in the CA1, but not CA3 or DG, in a model of NMDA toxicity in mice.”
ResultLiu, B., Huang, B., Hu, G., He, D., Li, Y., Ran, X., Du, J., Fu, S., & Liu, D. (2019) · Frontiers in Immunology · doi:10.3389/fimmu.2019.02650 · Cited by 66
“Approximately 12% of adult brain cells are ramified microglia (3).”
BackgroundTsunekawa, T., Banno, R., Mizoguchi, A., Sugiyama, M., Tominaga, T., Onoue, T., Hagiwara, D., Ito, Y., Iwama, S., Goto, M., et al. (2017) · EBioMedicine · doi:10.1016/j.ebiom.2017.01.007 · Cited by 63
“0mg/mL of liposomal clodronate (Clo), which reportedly depleted microglial cells without altering other cell types (Vinet et al., 2012; Valdearcos et al., 2014), or with control liposomes (Lip) (Cosmobio, Tokyo, Japan) for 24 h.”
BackgroundMethodThrane, V. R., Thrane, A. S., CHANAG, J., Alleluia, V., Nagelhus, E. A., & Nedergaard, M. (2012) · Neuroscience · doi:10.1016/j.neuroscience.2012.06.022 · Cited by 64
“Microglia have a unique role in the central nervous system (CNS); being resident immune cells that have both beneficial and harmful effects (Fuhrmann et al., 2010; Ransohoff and Cardona, 2010; Kettenmann et al., 2011; Vinet et al., 2012).”
Saliba, S. W., Marcotegui, A. R., Fortwängler, E., Ditrich, J., Perazzo, J. C., Muñoz, E., de Oliveira, A. C. P., & Fiebich, B. L. (2017) · Journal of Neuroinflammation · doi:10.1186/s12974-017-1014-3 · Cited by 62
“Then, slices were rinsed in DPBS at 35 °C and cultured in standard culture medium for another 6 days [22].”
InfluentialSabogal-Guáqueta, A. M., Marmolejo-Garza, A., de Pádua, V. P., Eggen, B. J. L., Boddeke, E., & Dolga, A. M. (2020) · Progress in Neurobiology · doi:10.1016/j.pneurobio.2020.101805 · Cited by 65
“, 2000), paving the way for microglial depletion in brain slices (Hellwig et al., 2015; Ji et al., 2013; Kohl et al., 2003; Vinet et al., 2012).”
The secretome signature of reactive glial cells and its pathological implications
Jha, M. K., Seo, M., Kim, J., Kim, B., Cho, J., & Suk, K. (2012) · Biochimica et Biophysica Acta (BBA) - Proteins and Proteomics · doi:10.1016/j.bbapap.2012.12.006 · Cited by 56
Cabrera‐Pastor, A., Balzano, T., Hernández‐Rabaza, V., Malaguarnera, M., Llansola, M., & Felipo, V. (2017) · Brain Behavior and Immunity · doi:10.1016/j.bbi.2017.12.013 · Cited by 59
“Microglia activation was assessed by measuring the cells perimeter in 8 randomly selected areas (0.45 mm2) per section according to Vinet et al. (2012).”
InfluentialOrsini, F., Chrysanthou, E., Dudler, T., Cummings, W. J., Takahashi, M., Fujita, T., Demopulos, G. A., Simoni, M. G. D., & Schwaeble, W. (2016) · Journal of Neuroinflammation · doi:10.1186/s12974-016-0684-6 · Cited by 54
“Overall, the CD11b morphological analysis revealed that, in the absence of MASP-2 functional activity, microglial cells within the ischemic areas primarily present as ramified microglia suggestive of an anti-inflammatory polarization state [41–43] as opposed to the hypertrophic microglial morphology associated with ph…”
BackgroundScheffold, A., Holtman, I. R., Dieni, S., Brouwer, N., Katz, S.-F., Jebaraj, B. M. C., Kahle, P. J., Hengerer, B., Lechel, A., Stilgenbauer, S., et al. (2016) · Acta Neuropathologica Communications · doi:10.1186/s40478-016-0364-x · Cited by 53
“Three-dimensional (3D)-reconstructions were performed using IMARIS Filament Tracer (www.bitplane.com), as previously described [23].”
BackgroundMethodSelf-citationPasetto, L., Pozzi, S., Castelnovo, M., Basso, M., Estévez, Á. G., Fumagalli, S., Simoni, M. G. D., Castellaneta, V., Bigini, P., Restelli, E., et al. (2016) · Journal of Neuroscience · doi:10.1523/jneurosci.2462-16.2016 · Cited by 52
“Consistent with this, MM218 treatment induced a morphological and phenotypical switch of microglia that may be associated with debris clearing and tissue remodeling (Vinet et al., 2012; Hong and Stevens, 2016).”
BackgroundAnti-Inflammatory Strategy for M2 Microglial Polarization Using Retinoic Acid-Loaded Nanoparticles
Machado‐Pereira, M., Santos, T., Ferreira, L., Bernardino, L. I., & Ferreira, R. (2017) · Mediators of Inflammation · doi:10.1155/2017/6742427 · Cited by 55
“After injury, these native tissue macrophages represent the first line of defense and quickly change their phenotype to secrete a large and diverse range of molecules that mediate inflammation [3, 4].”
BackgroundMicroglia: Lifelong modulator of neural circuits
Ikegami, A., Haruwaka, K., & Wake, H. (2019) · Neuropathology · doi:10.1111/neup.12560 · Cited by 49
“Not only of CA1 neurons but death of CA3 and DG neurons were also significantly increased, indicating enhanced NMDA-induced neurotoxicity in the slice.(66) Ji et al.”
BackgroundThe flavonoid rutin modulates microglial/macrophage activation to a CD150/CD206 M2 phenotype
da Silva, A. B., Coelho, P. L. C., Amparo, J. A. O., de Almeida, M. M. A., Borges, J. M. P., Souza, C. D. S., Costa, M. D. F. D., Mecha, M., Rodriguez, C. G., da Silva, V. D. A., et al. (2017) · Chemico-Biological Interactions · doi:10.1016/j.cbi.2017.07.004 · Cited by 52
Carbon Monoxide Preserves Circadian Rhythm to Reduce the Severity of Subarachnoid Hemorrhage in Mice
Schallner, N., Lieberum, J.-L., Gallo, D. J., LeBlanc, R. H., Fuller, P. M., Hanafy, K. A., & Otterbein, L. E. (2017) · Stroke · doi:10.1161/strokeaha.116.016165 · Cited by 52
“The role of microglia in neuronal injury is 2-sided in that they can induce neuronal apoptosis via neuroinflammation,(13) but they can also impart neuroprotection.(33) The neuronal response to activated microglia most likely depends on the cause and degree of neuronal injury.”
Gargouri, B., Yousif, N. M., Bouchard, M., Fetoui, H., & Fiebich, B. L. (2018) · Journal of Neuroinflammation · doi:10.1186/s12974-018-1198-1 · Cited by 48
“[31], who demonstrated that depletion of microglia resulted in severe neuronal loss following NMDA excitotoxicity.”
BackgroundLucchi, C., Curia, G., Vinet, J., Gualtieri, F., Bresciani, E., Locatelli, V., Torsello, A., & Biagini, G. (2013) · PLoS ONE · doi:10.1371/journal.pone.0072716 · Cited by 48
“Although NeuN is universally used as a marker for the evaluation of neuronal cell damage in different brain lesion models [38,45–46], NeuN immunopositivity has been reported also in dying cells [58].”
Self-citationVallarola, A., Sironi, F. M., Tortarolo, M., Gatto, N., Gioia, R. D., Pasetto, L., Paola, M. D., Mariani, A., Ghosh, S., Watson, R. L., et al. (2018) · Journal of Neuroinflammation · doi:10.1186/s12974-018-1101-0 · Cited by 50
“The neuroprotective role of M2 microglia is still debated but it seems that an increase of macrophagic activity in a specific phase of the disease may be associated with debris clearing and tissue remodeling [62, 63].”
Background
Metadata
- Authors
- Vinet, J., van Weering, H. R., Heinrich, A., Kälin, R. E., Wegner, A., Brouwer, N., Heppner, F. L., van Rooijen, N., Boddeke, H. W., & Biber, K.
- Affiliations
- University Medical Center Groningen (NL)
- University of Freiburg (DE)
- Charité – Universitätsmedizin Berlin (DE)
- Corresponding author
- Vinet, Jonathan
- Biber, Knut
- Venue
- Journal of Neuroinflammation
- Published
- 2012-01-31
- Volume
- 9
- Issue
- 1
- Pages
- 27-27
- ISSN
- 1742-2094 (ISSN-L)
- PMC
- PMC3292937
- OpenAlex
- W1963696719
- Cited by
- 274
- References
- 70
- Citations by year
- 2026: 11 · 2025: 6 · 2024: 18 · 2023: 16 · 2022: 14 · 2021: 20 · 2020: 22 · 2019: 20 · 2018: 18 · 2017: 28 · 2016: 24 · 2015: 18 · 2014: 24 · 2013: 26 · 2012: 9
- FWCI
- 12.38
- Type
- journal article
- Language
- en
- Open access
- gold
- doi.org
- Locations
- Journal of Neuroinflammation (publishedVersion, cc-by)
- Europe PMC (PubMed Central) (publishedVersion, cc-by)
- PubMed Central (publishedVersion, cc-by)
- PubMed (publishedVersion)
- Pure Amsterdam UMC (publishedVersion, other-oa)
- Amsterdam UMC (VU Amsterdam) - Institutional Repository (publishedVersion, other-oa)
- University of Groningen research database (University of Groningen / Centre for Information Technology) (publishedVersion, cc-by)
- Digital Academic REpository of VU University Amsterdam (Vrije Universiteit Amsterdam) (submittedVersion)
- DOAJ (DOAJ: Directory of Open Access Journals) (submittedVersion)
- UCL Discovery (University College London) (submittedVersion)
- IRIS UNIMORE (University of Modena and Reggio Emilia) (submittedVersion, cc-by)
- University of Groningen research database (University of Groningen / Centre for Information Technology) (submittedVersion, cc-by)
- Data Archiving and Networked Services (DANS) (submittedVersion, other-oa)
- Funders
- Deutsche Forschungsgemeinschaft (SFB TRR 43, NeuroCure EXC257, EXC257, FOR1336, TRR-43)
- Nederlandse Organisatie voor Wetenschappelijk Onderzoek
- Topics
- Life Sciences › Neuroscience › Neurology › Neuroinflammation and Neurodegeneration Mechanisms
- Life Sciences › Neuroscience › Cellular and Molecular Neuroscience › Neuroscience and Neuropharmacology Research
- Life Sciences › Neuroscience › Neurology › Neurological Disease Mechanisms and Treatments
- Keywords
- ramified microglia, neuroprotection, microglia depletion, organotypic hippocampal slice cultures, CA1 neurons, excitotoxic neurodegeneration
- MeSH terms
- Animals, Clodronic Acid, Dose-Response Relationship, Drug, Glial Fibrillary Acidic Protein, Hippocampus, Mice, Inbred C57BL, Mice, Transgenic, Nerve Degeneration, Neurons, Neurotoxins, Organ Culture Techniques, Phosphopyruvate Hydratase, N-Methylaspartate, Cell Death, Microglia, CD11b Antigen, Mice
About these checks
Registry, retraction, Cites and statistics results are computed, not judged, with one exception: a printed reference that no index lists is read once by a model before it counts as a citation error. Claims are extracted by a model and kept only when their quote appears verbatim in the text; each cited source is then checked, with a model’s help, for whether it says what the claim relies on. Those verdicts can be wrong — read the claim’s quote and the cited source before relying on one.
Statistics and arithmetic are recomputed, not judged.
Confidence bands are shown only for fields calibrated on our annotated test set. None is calibrated yet, so no band is shown.
What counts as a claim ›How we measure confidence ›How we check this ›
Are you an author, or do you see a problem with this page? Request a review
