

The DOI matches its Crossref record; 55 of the 55 references it cites were found in a registry or an index.
Effects of prenatal exposure to diesel exhaust particles on postnatal development, behavior, genotoxicity and inflammation in mice
Open accessAbstract
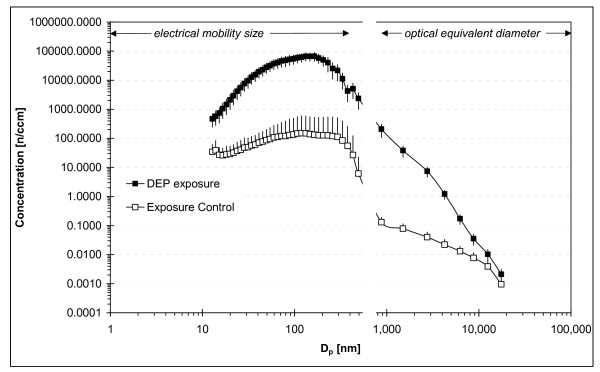
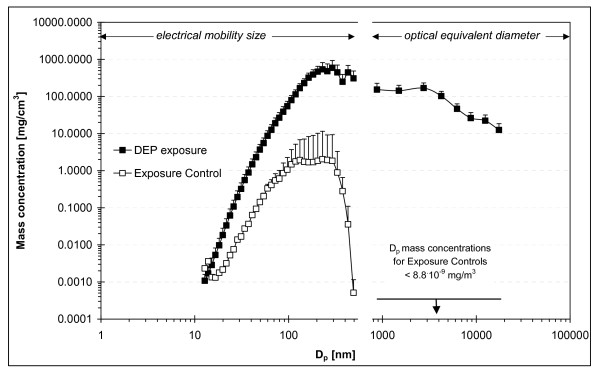
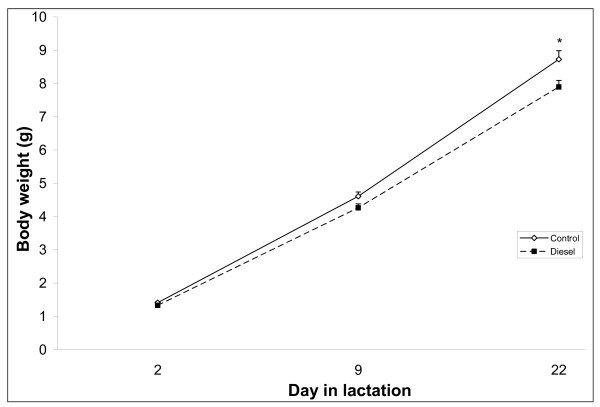
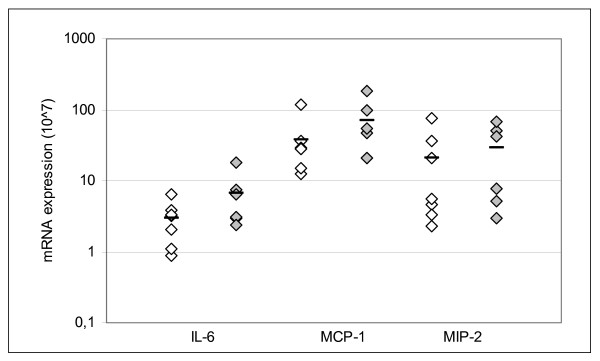
BACKGROUND: Results from epidemiological studies indicate that particulate air pollution constitutes a hazard for human health. Recent studies suggest that diesel exhaust possesses endocrine activity and therefore may affect reproductive outcome. This study in mice aimed to investigate whether exposure to diesel exhaust particles (DEP; NIST 2975) would affect gestation, postnatal development, activity, learning and memory, and biomarkers of transplacental toxicity. Pregnant mice (C57BL/6; BomTac) were exposed to 19 mg/m3 DEP (~1.106 particles/cm3; mass median diameter congruent with 240 nm) on gestational days 9-19, for 1 h/day. RESULTS: Gestational parameters were similar in control and diesel groups. Shortly after birth, body weights of DEP offspring were slightly lower than in controls. This difference increased during lactation, so by weaning the DEP exposed offspring weighed significantly less than the control progeny. Only slight effects of exposure were observed on cognitive function in female DEP offspring and on biomarkers of exposure to particles or genotoxic substances. CONCLUSION: In utero exposure to DEP decreased weight gain during lactation. Cognitive function and levels of biomarkers of exposure to particles or to genotoxic substances were generally similar in exposed and control offspring. The particle size and chemical composition of the DEP and differences in exposure methods (fresh, whole exhaust versus aged, resuspended DEP) may play a significant role on the biological effects observed in this compared to other studies.
Overview
The claims and statistics of this paper haven’t been checked yet.
Run the check — free, no account needed. It reads the open-access text and checks the sources it cites.
Integrity signals
Registry
Cites
Statistics
Figures
Verification
Claims the paper makes
The claims and statistics of this paper haven’t been checked yet.
Run the check — free, no account needed. It reads the open-access text and checks the sources it cites.
Claims other papers make about this one
Each is checked against this paper’s own text: does it say what the citing paper says it does?
The source backs part of the claim, not all of it — or backs it for a different population, condition or comparison.
In the citing paper
“Other studies have confirmed early reductions in offspring birth weight following prenatal diesel exhaust particle exposure, which were sustained throughout lactation [81].”
From Air pollution and children’s health—a review of adverse effects associated with prenatal exposure from fine to ultrafine particulate matter (2021) · cites this paper as [81]
Experimental — accuracy not yet measured
Self-check
Percentages, sums and reported differences re-computed from the paper’s own numbers.
The self-check needs the paper’s full text.
Citations
Cites
Lung cancer, cardiopulmonary mortality, and long-term exposure to fine particulate air pollution
Pope III, C. A. (2002) · JAMA · doi:10.1001/jama.287.9.1132 · Cited by 8,447
Nanotoxicology: An Emerging Discipline Evolving from Studies of Ultrafine Particles
Oberdörster, G., Oberdörster, E., & Oberdörster, J. (2005) · Environmental Health Perspectives · doi:10.1289/ehp.7339 · Cited by 7,891
Kittelson, D. B. (1998) · Journal of Aerosol Science · doi:10.1016/s0021-8502(97)10037-4 · Cited by 2,289
In utero programming of chronic disease
BARKER, D. J. P. (1998) · Clinical Science · doi:10.1042/cs0950115 · Cited by 1,765
Ambient Air Pollution and Pregnancy Outcomes: A Review of the Literature
Šrám, R. J., Binková, B., Dejmek, J., & Bobák, M. (2005) · Environmental Health Perspectives · doi:10.1289/ehp.6362 · Cited by 685
The comet assay: what can it really tell us?
Collins, A. R., Dobson, V. L., Dušinská, M., Kennedy, G., & Štětina, R. (1997) · Mutation research. Fundamental and molecular mechanisms of mutagenesis · doi:10.1016/s0027-5107(97)00013-4 · Cited by 667
Inhaled particles and lung cancer. Part A: Mechanisms
Knaapen, A. M., Borm, P. J. A., Albrecht, C., & Schins, R. P. F. (2004) · International Journal of Cancer · doi:10.1002/ijc.11708 · Cited by 606
Lessons learned from perinatal exposure to diethylstilbestrol
Newbold, R. R. (2004) · Toxicology and Applied Pharmacology · doi:10.1016/j.taap.2003.11.033 · Cited by 301
Goldey, E. S., Kehn, L. S., Lau, C. S., Rehnberg, G. L., & Crofton, K. M. (1995) · Toxicology and Applied Pharmacology · doi:10.1006/taap.1995.1210 · Cited by 289
Raabe, O. G., AL-BAYATI, M. A., Teague, S. V., & RASOLT, A. (1988) · Elsevier eBooks · doi:10.1016/b978-0-08-034185-9.50011-5 · Cited by 277
Cited by
Sorted by citations
Traffic-Related Air Pollution, Particulate Matter, and Autism
Volk, H. E., Lurmann, F., Penfold, B., Hertz-Picciotto, I., & McConnell, R. (2013) · JAMA Psychiatry · doi:10.1001/jamapsychiatry.2013.266 · Cited by 638
Costa, L. G., Cole, T. B., Dao, K., Chang, Y. C., Coburn, J. L., & Garrick, J. M. (2020) · Pharmacology & Therapeutics · doi:10.1016/j.pharmthera.2020.107523 · Cited by 511
Neurotoxicity of traffic-related air pollution
Costa, L. G., Cole, T. B., Coburn, J. L., Chang, Y., Dao, K., & Roqué, P. J. (2015) · NeuroToxicology · doi:10.1016/j.neuro.2015.11.008 · Cited by 416
Residential Proximity to Freeways and Autism in the CHARGE Study
Volk, H. E., Hertz-Picciotto, I., Delwiche, L., Lurmann, F., & McConnell, R. (2011) · Environmental Health Perspectives · doi:10.1289/ehp.1002835 · Cited by 347
Johnson, N. M., Hoffmann, A. R., Behlen, J. C., Lau, C., Pendleton, D., Harvey, N., Shore, R., Li, Y., Chen, J., Tian, Y., et al. (2021) · Environmental Health and Preventive Medicine · doi:10.1186/s12199-021-00995-5 · Cited by 339
Chiu, Y.-H. M., Hsu, H. L., Coull, B. A., Bellinger, D. C., Kloog, I., Schwartz, J. D., Wright, R. O., & Wright, R. J. (2015) · Environment International · doi:10.1016/j.envint.2015.11.010 · Cited by 267
Toxicity of Nanoparticles on the Reproductive System in Animal Models: A Review
Dad, R., Wang, L., Talpur, H. S., Wu, D., Khan, F. A., Bhattarai, D., Rehman, Z. U., Farmanullah, F., & Huo, L. (2017) · Frontiers in Pharmacology · doi:10.3389/fphar.2017.00606 · Cited by 297
Hougaard, K. S., Jackson, P., Jensen, K. A., Sloth, J. J., Löschner, K., Larsen, E. H., Birkedal, R. K., Vibenholt, A., Boisen, A.-M. Z., Wallin, H., et al. (2010) · Particle and Fibre Toxicology · doi:10.1186/1743-8977-7-16 · Cited by 191
Self-citationAir Pollution During Pregnancy and Childhood Cognitive and Psychomotor Development
Guxens, M., García‐Esteban, R., Giorgis-Allemand, L., Forns, J., Badaloní, C., Ballester, F., Beelen, R. M. J., Cesaroni, G., Chatzi, L., Agostini, M. D., et al. (2014) · Epidemiology · doi:10.1097/ede.0000000000000133 · Cited by 236
Costa, L. G., Cole, T. B., Coburn, J. L., Chang, Y.-C., Dao, K., & Roqué, P. J. (2014) · BioMed Research International · doi:10.1155/2014/736385 · Cited by 211
The Physiological Effects of Air Pollution: Particulate Matter, Physiology and Disease
Pryor, J. T., Cowley, L. O., & Simonds, S. E. (2022) · Frontiers in Public Health · doi:10.3389/fpubh.2022.882569 · Cited by 215
Reproductive and developmental toxicity of carbon-based nanomaterials: A literature review
Ema, M., Hougaard, K. S., Kishimoto, A., & Honda, K. (2015) · Nanotoxicology · doi:10.3109/17435390.2015.1073811 · Cited by 189
Self-citationA perspective on the developmental toxicity of inhaled nanoparticles
Hougaard, K. S., Campagnolo, L., Chavatte-Palmer, P., Tarrade, A., Rousseau-Ralliard, D., Valentino, S., Park, M. V. D. Z., de Jong, W. H., Wolterink, G., Piersma, A. H., et al. (2015) · Reproductive Toxicology · doi:10.1016/j.reprotox.2015.05.015 · Cited by 171
Self-citationHalappanavar, S. S., Jackson, P., Williams, A., Jensen, K. A., Hougaard, K. S., Vogel, U. B., Yauk, C. L., & Wallin, H. (2011) · Environmental and Molecular Mutagenesis · doi:10.1002/em.20639 · Cited by 169
Self-citationJackson, P., Hougaard, K. S., Boisen, A. M. Z., Jacobsen, N. R., Jensen, K. A., Möller, P., Brunborg, G., Gützkow, K. B., Andersen, O., Loft, S. H., et al. (2011) · Nanotoxicology · doi:10.3109/17435390.2011.587902 · Cited by 167
Self-citationDevelopmental impact of air pollution on brain function
Costa, L. G., Cole, T. B., Dao, K., Chang, Y. C., & Garrick, J. M. (2019) · Neurochemistry International · doi:10.1016/j.neuint.2019.104580 · Cited by 180
Flores-Pajot, M.-C., Ofner, M., Do, M. T., Lavigne, E., & Villeneuve, P. J. (2016) · Environmental Research · doi:10.1016/j.envres.2016.07.030 · Cited by 157
Early Life Exposure to Air Pollution: How Bad Is It?
Backes, C., Nelin, T. D., Gorr, M., & Wold, L. (2012) · Toxicology Letters · doi:10.1016/j.toxlet.2012.11.007 · Cited by 162
Chen, G., Jin, Z., Li, S., Jin, X., Tong, S., Liu, S., Yang, Y., Huang, H., & Guo, Y. (2018) · Environment International · doi:10.1016/j.envint.2018.10.026 · Cited by 132
Jackson, P., Hougaard, K. S., Vogel, U., Wu, D., Casavant, L., Williams, A., Wade, M., Yauk, C. L., Wallin, H., & Halappanavar, S. (2012) · Mutation Research/Genetic Toxicology and Environmental Mutagenesis · doi:10.1016/j.mrgentox.2011.09.018 · Cited by 96
Self-citationSaber, A. T., Jacobsen, N. R., Jackson, P., Poulsen, S. S., Kyjovska, Z. O., Halappanavar, S. S., Yauk, C. L., Wallin, H., & Vogel, U. B. (2014) · Wiley Interdisciplinary Reviews Nanomedicine and Nanobiotechnology · doi:10.1002/wnan.1279 · Cited by 130
Self-citationDavis, D. A., Bortolato, M., Godar, S. C., Sander, T. K., Iwata, N., Pakbin, P., Shih, J. C., Berhane, K., McConnell, R., Sioutas, C., et al. (2013) · PLoS ONE · doi:10.1371/journal.pone.0064128 · Cited by 123
Cognitive Effects of Air Pollution Exposures and Potential Mechanistic Underpinnings
Allen, J. L., Klocke, C. R., Morris‐Schaffer, K., Conrad, K., Sobolewski, M., & Cory‐Slechta, D. A. (2017) · Current Environmental Health Reports · doi:10.1007/s40572-017-0134-3 · Cited by 124
Effects of Nanotoxicity on Female Reproductivity and Fetal Development in Animal Models
Jianling, S., Zhang, Q., Wang, Z., & Yan, B. (2013) · International Journal of Molecular Sciences · doi:10.3390/ijms14059319 · Cited by 104
Air pollution and autism in Denmark
Ritz, B. R., Liew, Z., Yan, Q. J., Cuia, X., Virk, J., Ketzel, M., & Raaschou‐Nielsen, O. (2018) · Environmental Epidemiology · doi:10.1097/ee9.0000000000000028 · Cited by 103
Daily sperm production: Application in studies of prenatal exposure to nanoparticles in mice
Kyjovska, Z. O., Boisen, A. M. Z., Jackson, P., Wallin, H., Vogel, U. B., & Hougaard, K. S. (2013) · Reproductive Toxicology · doi:10.1016/j.reprotox.2012.12.005 · Cited by 103
Self-citationMaternal serum metabolome and traffic-related air pollution exposure in pregnancy
Yan, Q., Liew, Z., Uppal, K., Cui, X., Ling, C., Heck, J. E., von Ehrenstein, O. S., Wu, J., Walker, D. I., Jones, D. P., et al. (2019) · Environment International · doi:10.1016/j.envint.2019.05.066 · Cited by 91
Developmental Neurotoxicity of Traffic-Related Air Pollution: Focus on Autism
Costa, L. G., Chang, Y. C., & Cole, T. B. (2017) · Current Environmental Health Reports · doi:10.1007/s40572-017-0135-2 · Cited by 94
Familari, M., Nääv, Å., Erlandsson, L., de Iongh, R. U., Isaxon, C., Strandberg, B., Lundh, T., Hansson, S. R., & Malmqvist, E. (2019) · PLoS ONE · doi:10.1371/journal.pone.0218799 · Cited by 89
Umezawa, M., Onoda, A., Korshunova, I., Jensen, A. C. Ø., Koponen, I. K., Jensen, K. A., Khodosevich, K., Vogel, U., & Hougaard, K. S. (2018) · Particle and Fibre Toxicology · doi:10.1186/s12989-018-0272-2 · Cited by 74
Self-citationBendtsen, K. M., Gren, L., Malmborg, V., Shukla, P. C., Tunér, M., Essig, Y. J., Krais, A. M., Clausen, P. A., Berthing, T., Loeschner, K., et al. (2020) · Particle and Fibre Toxicology · doi:10.1186/s12989-020-00369-9 · Cited by 85
Self-citationEarly life exposure to air pollution induces adult cardiac dysfunction
Gorr, M. W., Velten, M., Nelin, T. D., Youtz, D. J., Sun, Q., & Wold, L. E. (2014) · American Journal of Physiology-Heart and Circulatory Physiology · doi:10.1152/ajpheart.00526.2014 · Cited by 84
Developmental toxicity of diesel exhaust: A review of studies in experimental animals
Ema, M., Naya, M., Horimoto, M., & Kato, H. (2013) · Reproductive Toxicology · doi:10.1016/j.reprotox.2013.06.074 · Cited by 84
Yokota, S., Moriya, N., Iwata, M., Umezawa, M., Oshio, S., & Takeda, K. (2013) · The Journal of Toxicological Sciences · doi:10.2131/jts.38.13 · Cited by 75
Effects of lung exposure to carbon nanotubes on female fertility and pregnancy. A study in mice
Hougaard, K. S., Jackson, P., Kyjovska, Z. O., Birkedal, R. K., Temmerman, P.-J. D., Brunelli, A., Verleysen, E., Madsen, A. M., Saber, A. T., Pojana, G., et al. (2013) · Reproductive Toxicology · doi:10.1016/j.reprotox.2013.05.006 · Cited by 75
Self-citationJackson, P., Vogel, U., Wallin, H., & Hougaard, K. S. (2011) · Basic & Clinical Pharmacology & Toxicology · doi:10.1111/j.1742-7843.2011.00745.x · Cited by 62
Self-citationJackson, P., Halappanavar, S. S., Hougaard, K. S., Williams, A., Madsen, A. M., Lamson, J. S., Andersen, O., Yauk, C. L., Wallin, H., & Vogel, U. B. (2011) · Nanotoxicology · doi:10.3109/17435390.2011.633715 · Cited by 74
Self-citationEffects of fine particulate matter (PM2.5) on ovarian function and embryo quality in mice
Liao, B., Liu, C.-B., Xie, S., Liu, Y., Deng, Y., He, S., Fu, X., Fu, B.-B., Wang, Y., Chen, M., et al. (2019) · Environment International · doi:10.1016/j.envint.2019.105338 · Cited by 72
An Experimental Protocol for Maternal Pulmonary Exposure in Developmental Toxicology
Jackson, P., Lund, S. P., Kristiansen, G., Andersen, O., Vogel, U. B., Wallin, H., & Hougaard, K. S. (2010) · Basic & Clinical Pharmacology & Toxicology · doi:10.1111/j.1742-7843.2010.00644.x · Cited by 71
Self-citationInoue, K., Yan, Q. J., Arah, O. A., Paul, K. C., Walker, D. I., Jones, D. P., & Ritz, B. R. (2020) · Current Environmental Health Reports · doi:10.1007/s40572-020-00284-3 · Cited by 66
Morris‐Schaffer, K., Merrill, A. K., Wong, C., Jew, K., Sobolewski, M., & Cory‐Slechta, D. A. (2019) · Particle and Fibre Toxicology · doi:10.1186/s12989-018-0287-8 · Cited by 66
Bendtsen, K. M., Brostrøm, A., Koivisto, A. J., Koponen, I. K., Berthing, T., Bertram, N., Kling, K. I., Maso, M. D., Kangasniemi, O., Poikkimäki, M., et al. (2019) · Particle and Fibre Toxicology · doi:10.1186/s12989-019-0305-5 · Cited by 64
Self-citationMorales-Rubio, R. A., Alvarado-Cruz, I., Manzano-León, N., Andrade-Oliva, M.-D.-L.-A., Uribe-Ramirez, M., Quintanilla-Vega, B., Osornio-Vargas, Á., & De Vizcaya-Ruiz, A. (2019) · Particle and Fibre Toxicology · doi:10.1186/s12989-019-0289-1 · Cited by 62
Ghaderi, S., Tabatabaei, S. R. F., Varzi, H. N., & Rashno, M. (2015) · The Journal of Toxicological Sciences · doi:10.2131/jts.40.263 · Cited by 61
Yokota, S., Oshio, S., Moriya, N., & Takeda, K. (2016) · PLOS ONE · doi:10.1371/journal.pone.0149737 · Cited by 58
El-Sayed, Y. S., Shimizu, R., Onoda, A., Takeda, K., & Umezawa, M. (2015) · Toxicology · doi:10.1016/j.tox.2014.11.005 · Cited by 63
Cory-Slechta, D. A., Allen, J. L., Conrad, K., Marvin, E., & Sobolewski, M. (2018) · NeuroToxicology · doi:10.1016/j.neuro.2017.12.003 · Cited by 63
Fennell, T. R., Mortensen, N. P., Black, S. R., Snyder, R. W., Levine, K. E., Poitras, E. P., Harrington, J. M., Wingard, C. J., Holland, N. A., Pathmasiri, W., et al. (2016) · Journal of Applied Toxicology · doi:10.1002/jat.3387 · Cited by 53
Wang, M., Nie, Y., Liu, Y., Dai, H., Wang, J., Si, B., Yang, Z., Cheng, L., Liu, Y., Chen, S., et al. (2018) · Ecotoxicology and Environmental Safety · doi:10.1016/j.ecoenv.2018.12.027 · Cited by 52
Air pollution and childhood obesity
Seo, M. Y., Kim, S.-H., & Park, M. J. (2020) · Korean Journal of Pediatrics · doi:10.3345/cep.2020.00010 · Cited by 51
Non-protein-bound iron and 4-hydroxynonenal protein adducts in classic autism
Pecorelli, A., Leoncini, S., Felice, C. D., Signorini, C., Cerrone, C., Valacchi, G., Ciccoli, L., & Hayek, J. (2012) · Brain and Development · doi:10.1016/j.braindev.2012.03.011 · Cited by 49
Chen, M., Liang, S., Zhou, H., Xu, Y., Qin, X., Hu, Z., Wang, X., Qiu, L., Wang, W., Zhang, Y., et al. (2017) · Particle and Fibre Toxicology · doi:10.1186/s12989-017-0183-7 · Cited by 48
Traffic-related air pollution and brain development
Woodward, N., Davis School of Gerontology and the Dornsife College, D. O. B. S., E. Finch, C., & E. Morgan, T. (2015) · AIMS Environmental Science · doi:10.3934/environsci.2015.2.353 · Cited by 43
Kyjovska, Z. O., Jacobsen, N. R., Saber, A. T., Bengtson, S., Jackson, P., Wallin, H., & Vogel, U. B. (2015) · Mutagenesis · doi:10.1093/mutage/gev009 · Cited by 47
Self-citationJanuário, D. A. N. F., Perin, P. M., Maluf, M., Lichtenfels, A. J. F. C., & Saldiva, P. H. N. (2010) · Toxicological Sciences · doi:10.1093/toxsci/kfq165 · Cited by 46
Neurobehavioral Consequences of Traffic-Related Air Pollution
Salvi, A., & Salim, S. (2019) · Frontiers in Neuroscience · doi:10.3389/fnins.2019.01232 · Cited by 47
Transgenerational Effects of NMs
Poma, A. M., Colafarina, S., Fontecchio, G., & Chichiriccò, G. (2014) · Advances in experimental medicine and biology · doi:10.1007/978-94-017-8739-0_12 · Cited by 45
Thirtamara Rajamani, K., Doherty‐Lyons, S., Bolden, C., Willis, D., Hoffman, C., Zelikoff, J., Chen, L., & Gu, H. (2013) · Autism Research · doi:10.1002/aur.1287 · Cited by 42
Snyder, R. W., Fennell, T. R., Wingard, C. J., Mortensen, N. P., Holland, N. A., Shannahan, J. H., Pathmasiri, W., Lewin, A. H., & Sumner, S. (2015) · Journal of Applied Toxicology · doi:10.1002/jat.3177 · Cited by 42
Chuang, H., Cheng, Y.-L., Lei, Y.-C., Chang, H.-H., & Cheng, T. (2012) · Toxicology and Applied Pharmacology · doi:10.1016/j.taap.2012.12.004 · Cited by 41
Ritz, C., Ruminski, W., Hougaard, K. S., Wallin, H., Vogel, U. B., & Yauk, C. L. (2011) · Mutation research. Fundamental and molecular mechanisms of mutagenesis · doi:10.1016/j.mrfmmm.2011.04.007 · Cited by 40
Self-citationEffects of Silver Nanoparticle on the Developing Liver of Rat Pups after Maternal Exposure.
Fatemi, M., Moshtaghian, J., Ghaedi, K., Dinani, N. J., & Naderi, G. (2017) · Europe PMC (PubMed Central) · Cited by 38
Bernal-Meléndez, E., Lacroix, M.-C., Krémarik, P., Callebert, J., Olivier, B., Persuy, M., Durieux, D., Rousseau‐Ralliard, D., Aı̈oun, J., Cassee, F. R., et al. (2019) · Particle and Fibre Toxicology · doi:10.1186/s12989-018-0288-7 · Cited by 40
NanoTIO2 (UV-Titan) does not induce ESTR mutations in the germline of prenatally exposed female mice
Boisen, A. M. Z., Shipley, T., Jackson, P., Hougaard, K. S., Wallin, H., Yauk, C. L., & Vogel, U. B. (2012) · Particle and Fibre Toxicology · doi:10.1186/1743-8977-9-19 · Cited by 37
Self-citationSharkhuu, T., Doerfler, D. L., Krantz, Q. T., Luebke, R. W., Linak, W. P., & Gilmour, M. I. (2010) · Toxicology Letters · doi:10.1016/j.toxlet.2010.03.017 · Cited by 39
Child serum metabolome and traffic-related air pollution exposure in pregnancy
Ritz, B. R., Yan, Q. J., He, D., Wu, J. Y., Walker, D. I., Uppal, K., Jones, D. P., & Heck, J. E. (2021) · Environmental Research · doi:10.1016/j.envres.2021.111907 · Cited by 36
Developmental toxicity of engineered nanoparticles
Hougaard, K. S., Fadeel, B., Gulumian, M., Kagan, V. E., & Savolainen, K. (2011) · Elsevier eBooks · doi:10.1016/b978-0-12-382032-7.10021-9 · Cited by 34
Self-citationPrenatal exposure to diesel exhaust particles and effect on the male reproductive system in mice
Hemmingsen, J. G., Hougaard, K. S., Talsness, C. E., Wellejus, A., Loft, S. H., Wallin, H., & Möller, P. (2009) · Toxicology · doi:10.1016/j.tox.2009.07.012 · Cited by 34
Self-citationJohansson, H. K. L., Hansen, J. S., Elfving, B., Lund, S. P., Kyjovska, Z. O., Loft, S. H., Barfod, K. K., Jackson, P., Vogel, U. B., & Hougaard, K. S. (2017) · Particle and Fibre Toxicology · doi:10.1186/s12989-017-0197-1 · Cited by 32
Self-citationPerinatal exposure to diesel exhaust affects gene expression in mouse cerebrum
Tsukue, N., Watanabe, M., Kumamoto, T., Takano, H., & Takeda, K. (2009) · Archives of Toxicology · doi:10.1007/s00204-009-0459-2 · Cited by 33
Zanini, M. J., Domínguez, C., Fernández-Oliva, T., Sánchez, O., Toda, M. T., Foraster, M., Dadvand, P., & Llurba, E. (2020) · Current Hypertension Reports · doi:10.1007/s11906-020-01088-4 · Cited by 29
Neurodevelopmental toxicity induced by airborne particulate matter
Shang, M., Tang, M. X., & Xue, Y. (2022) · Journal of Applied Toxicology · doi:10.1002/jat.4382 · Cited by 30
Xie, P., Zhao, C., Huang, W., Yong, T., Chung, A. C. K., He, K., Chen, X., & Cai, Z. (2019) · Science of The Total Environment · doi:10.1016/j.scitotenv.2018.12.007 · Cited by 28
Amnuaylojaroen, T., Parasin, N., & Saokaew, S. (2024) · Reproductive Toxicology · doi:10.1016/j.reprotox.2024.108582 · Cited by 27
Diesel Exhaust Particles: Effects on Neurofunction in Female Mice
Hougaard, K. S., Saber, A. T., Jensen, K. A., Vogel, U. B., & Wallin, H. (2009) · Basic & Clinical Pharmacology & Toxicology · doi:10.1111/j.1742-7843.2009.00407.x · Cited by 26
Self-citationPrenatal Exposure to Ambient Air Pollution and Cerebral Palsy
Zhang, Y., Hu, Y., Talarico, R., Qiu, X.-Y., Schwartz, J., Fell, D., Oskoui, M., Lavigne, É., & Messerlian, C. (2024) · JAMA Network Open · doi:10.1001/jamanetworkopen.2024.20717 · Cited by 25
Singh, S. K., Goel, I., Tripathi, S., Ahirwar, A. K., Kumar, M., Rana, A., Dhar, R., & Karmakar, S. (2024) · Environmental Science and Pollution Research · doi:10.1007/s11356-024-35016-9 · Cited by 26
Bai, K., Chuang, K.-J., Wu, S., Chang, L.-T., Chang, T.-Y., Ho, K., & Chuang, H. (2018) · Environmental Toxicology and Pharmacology · doi:10.1016/j.etap.2018.06.007 · Cited by 22
Zhang, X., Spear, E. A., Gennings, C., Curtin, P. C. P., Just, A. C., Bragg, J. B., & Stroustrup, A. (2020) · Environmental Research · doi:10.1016/j.envres.2020.109204 · Cited by 22
Chiang, L.-L., Chen, H.-C., Lee, C.-N., Chuang, K.-J., Chen, T.-T., Yeh, C., Wang, L.-S., Lee, W.-H., Lin, L., Tseng, H.-E., et al. (2013) · Chemico-Biological Interactions · doi:10.1016/j.cbi.2013.10.013 · Cited by 22
Lauvås, A. J., Skovmand, A., Poulsen, M. S., Kyjovska, Z. O., Roursgaard, M., Goericke‐Pesch, S., Vogel, U. B., & Hougaard, K. S. (2019) · Reproductive Toxicology · doi:10.1016/j.reprotox.2019.07.023 · Cited by 21
Self-citationMaternal exposure to ambient air pollution and risk of congenital heart defects in Suzhou, China
Sun, L., Wu, Q., Wang, H., Liu, J., Shao, Y., Xu, R., Gong, T., Xiaoju, P., & Zhang, B. (2023) · Frontiers in Public Health · doi:10.3389/fpubh.2022.1017644 · Cited by 20
Toxicity of exhaust nanoparticles
Mohan, D. (2013) · African Journal of Pharmacy and Pharmacology · doi:10.5897/ajppx12.005 · Cited by 20
Neurotoxicity of Diesel Exhaust Particles
Shkirkova, K., Lamorie‐Foote, K., Zhang, N., Li, A., Diaz, A., Liu, Q., Thorwald, M. A., Godoy-Lugo, J. A., Ge, B. B., D’Agostino, C., et al. (2022) · Journal of Alzheimer s Disease · doi:10.3233/jad-220493 · Cited by 19
Yang, S., Hong, F., Li, S., Han, X., Li, J., Wang, X., Chen, L., Zhang, X., Tan, X., Xu, J., et al. (2023) · Environmental Research · doi:10.1016/j.envres.2023.116228 · Cited by 20
A two-equation soot-in-flamelet modeling approach applied under Spray A conditions
Pachano, L., Xu, C., García-Oliver, J. M., Pastor, J. M., Novella, R., & Kundu, P. (2021) · Combustion and Flame · doi:10.1016/j.combustflame.2021.111488 · Cited by 15
Win‐Shwe, T., Kyi‐Tha‐Thu, C., Fujitani, Y., Tsukahara, S., & Hirano, S. (2021) · International Journal of Molecular Sciences · doi:10.3390/ijms22020538 · Cited by 16
Park, J.-R., Ramachandran, G., Raynor, P. C., & Kim, S. W. (2011) · Journal of Nanoparticle Research · doi:10.1007/s11051-011-0469-x · Cited by 14
Lynch, H. N., Loftus, C. T., Cohen, J. M., Kerper, L. E., Kennedy, E. M., & Goodman, J. E. (2016) · Regulatory Toxicology and Pharmacology · doi:10.1016/j.yrtph.2016.10.006 · Cited by 15
Inhaled Environmental Allergens and Toxicants as Determinants of the Asthma Phenotype
Sokol, K. C., Sur, S., & Ameredes, B. T. (2013) · Advances in experimental medicine and biology · doi:10.1007/978-1-4614-8603-9_4 · Cited by 12
Rossides, M., Kampitsi, C., Talbäck, M., Mogensen, H., Wiebert, P., Feychting, M., & Tettamanti, G. (2022) · Environmental Health Perspectives · doi:10.1289/ehp11035 · Cited by 13
Aminuddin, M., Sargowo, D., Sardjono, T. W., & Widjiati, W. (2023) · Open Veterinary Journal · doi:10.5455/ovj.2023.v13.i1.2 · Cited by 12
Costa, L. G. (2017) · Advances in neurotoxicology · doi:10.1016/bs.ant.2017.07.001 · Cited by 12
Campagnolo, L., & Hougaard, K. S. (2017) · Elsevier eBooks · doi:10.1016/b978-0-12-809199-9.00017-3 · Cited by 11
Self-citationPeng, X., Maltz, M. R., Botthoff, J. K., Aronson, E. L., Nordgren, T. M., Lo, D. D., & Cocker, D. R. (2019) · Review of Scientific Instruments · doi:10.1063/1.5042097 · Cited by 11
Cohn, C. A., Lemieux, C. L., Long, A. S., Kystol, J., Vogel, U. B., White, P. A., & Madsen, A. M. (2010) · Environmental and Molecular Mutagenesis · doi:10.1002/em.20628 · Cited by 11
Self-citationHsu, H. L., Lane, J. M., Schnaas, L., Coull, B. A., Osorio-Valencia, E., Chiu, Y.-H. M., Wilson, A., Just, A. C., Kloog, I., Bellinger, D. C., et al. (2024) · Environmental Epidemiology · doi:10.1097/ee9.0000000000000291 · Cited by 10
Circulating Interleukin-6 Mediates PM 2.5 -Induced Ovarian Injury by Suppressing the PPARγ Pathway
Chen, Y., Zhang, J., Zhang, T., Wu, Y., Xi, Y., Wu, T., Li, M., Li, Y., Zhou, S., Wu, M., et al. (2024) · Research · doi:10.34133/research.0538 · Cited by 10
Neurotoxicity of air pollution: Role of neuroinflammation
Costa, L. G., Cole, T. B., Dao, K., Chang, Y. C., Coburn, J. L., & Garrick, J. M. (2018) · Advances in neurotoxicology · doi:10.1016/bs.ant.2018.10.007 · Cited by 11
Modélisation de la formation et de l'oxydation des suies dans un moteur automobile
Marchal, C. (2008) · HAL · Cited by 10
Metadata
- Authors
- Hougaard, K. S., Jensen, K. A., Nordly, P., Taxvig, C., Vogel, U., Saber, A. T., & Wallin, H.
- Affiliations
- National Research Centre for the Working Environment (DK)
- University of Copenhagen (DK)
- Technical University of Denmark (DK)
- Venue
- Particle and Fibre Toxicology
- Published
- 2008
- Volume
- 5
- Issue
- 1
- Pages
- 3
- ISSN
- 1743-8977 (ISSN-L)
- PMC
- PMC2323399
- OpenAlex
- W2102523805
- Cited by
- 132
- References
- 54
- Citations by year
- 2026: 1 · 2025: 4 · 2024: 5 · 2023: 4 · 2022: 8 · 2021: 5 · 2020: 7 · 2019: 13 · 2018: 10 · 2017: 11 · 2016: 5 · 2015: 11 · 2014: 6 · 2013: 10 · 2012: 7
- FWCI
- 5.76
- Type
- journal article
- Language
- en
- Open access
- gold
- doi.org
- Licence
- cc-by
- Locations
- Particle and Fibre Toxicology (publishedVersion, cc-by)
- PubMed Central (publishedVersion, cc-by)
- PubMed (publishedVersion)
- DOAJ (DOAJ: Directory of Open Access Journals) (submittedVersion, cc-by-sa)
- Research at the University of Copenhagen (University of Copenhagen) (submittedVersion)
- Technical University of Denmark, DTU Orbit (Technical University of Denmark, DTU) (submittedVersion, other-oa)
- Topics
- Physical Sciences › Environmental Science › Health, Toxicology and Mutagenesis › Air Quality and Health Impacts
- Physical Sciences › Environmental Science › Health, Toxicology and Mutagenesis › Toxic Organic Pollutants Impact
- Life Sciences › Biochemistry, Genetics and Molecular Biology › Cancer Research › Carcinogens and Genotoxicity Assessment
- Keywords
- diesel exhaust particles, prenatal exposure, postnatal development, weight gain, lactation, cognitive function, learning and memory, genotoxicity, inflammation, particulate matter pollution, endocrine activity, gestation, mice
About these checks
Registry, retraction, Cites and statistics results are computed, not judged, with one exception: a printed reference that no index lists is read once by a model before it counts as a citation error. Claims are extracted by a model and kept only when their quote appears verbatim in the text; each cited source is then checked, with a model’s help, for whether it says what the claim relies on. Those verdicts can be wrong — read the claim’s quote and the cited source before relying on one.
Statistics and arithmetic are recomputed, not judged.
Confidence bands are shown only for fields calibrated on our annotated test set. None is calibrated yet, so no band is shown.
What counts as a claim ›How we measure confidence ›How we check this ›
Are you an author, or do you see a problem with this page? Request a review
