

The DOI matches its Crossref record; 29 of the 29 references it cites were found in a registry or an index; 1 of the 14 sources its claims cite were checked for support.
Land-use change and greenhouse gas emissions from corn and cellulosic ethanol
Open accessAbstract
BACKGROUND: The greenhouse gas (GHG) emissions that may accompany land-use change (LUC) from increased biofuel feedstock production are a source of debate in the discussion of drawbacks and advantages of biofuels. Estimates of LUC GHG emissions focus mainly on corn ethanol and vary widely. Increasing the understanding of LUC GHG impacts associated with both corn and cellulosic ethanol will inform the on-going debate concerning their magnitudes and sources of variability. RESULTS: In our study, we estimate LUC GHG emissions for ethanol from four feedstocks: corn, corn stover, switchgrass, and miscanthus. We use new computable general equilibrium (CGE) results for worldwide LUC. U.S. domestic carbon emission factors are from state-level modelling with a surrogate CENTURY model and U.S. Forest Service data. This paper investigates the effect of several key domestic lands carbon content modelling parameters on LUC GHG emissions. International carbon emission factors are from the Woods Hole Research Center. LUC GHG emissions are calculated from these LUCs and carbon content data with Argonne National Laboratory's Carbon Calculator for Land Use Change from Biofuels Production (CCLUB) model. Our results indicate that miscanthus and corn ethanol have the lowest (-10 g CO2e/MJ) and highest (7.6 g CO2e/MJ) LUC GHG emissions under base case modelling assumptions. The results for corn ethanol are lower than corresponding results from previous studies. Switchgrass ethanol base case results (2.8 g CO2e/MJ) were the most influenced by assumptions regarding converted forestlands and the fate of carbon in harvested wood products. They are greater than miscanthus LUC GHG emissions because switchgrass is a lower-yielding crop. Finally, LUC GHG emissions for corn stover are essentially negligible and insensitive to changes in model assumptions. CONCLUSIONS: This research provides new insight into the influence of key carbon content modelling variables on LUC GHG emissions associated with the four bioethanol pathways we examined. Our results indicate that LUC GHG emissions may have a smaller contribution to the overall biofuel life cycle than previously thought. Additionally, they highlight the need for future advances in LUC GHG emissions estimation including improvements to CGE models and aboveground and belowground carbon content data.
Overview
AI snapshot
Written from the paper’s full text.
TL;DR
This study estimates land-use change (LUC) greenhouse gas (GHG) emissions for ethanol from corn, corn stover, switchgrass, and miscanthus using GTAP CGE results and Argonne’s CCLUB/GREET models. It finds corn ethanol has the highest base-case LUC GHG emissions (7.6 g CO2e/MJ), miscanthus the lowest (−10 g CO2e/MJ), and corn stover essentially negligible.
Key findings
- Base-case LUC GHG emissions were 7.6 g CO2e/MJ for corn ethanol, 2.8 g CO2e/MJ for switchgrass ethanol, −10 g CO2e/MJ for miscanthus ethanol, and essentially negligible for corn stover.
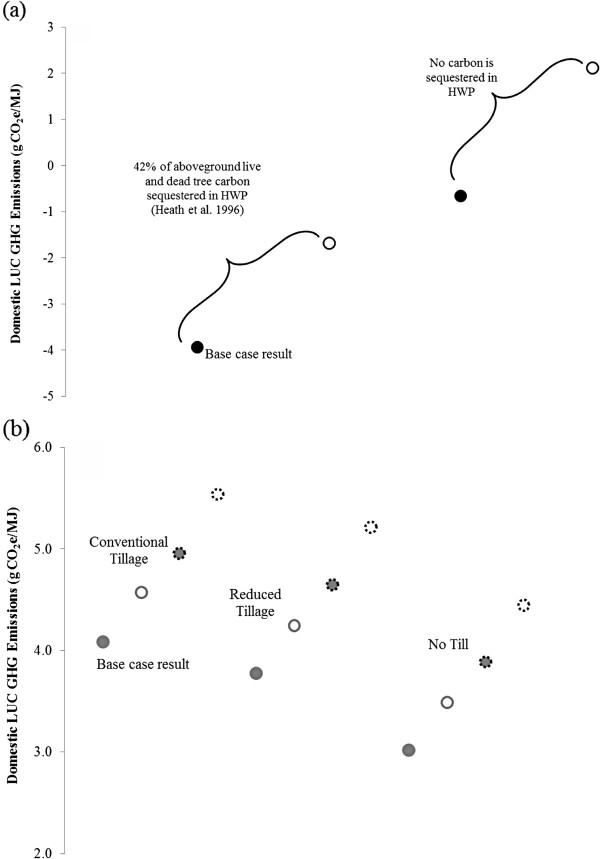
- Across all modelled parameter combinations, LUC GHG emissions ranged from 4.7 to 11 g CO2e/MJ for corn, 2.7 to 19 g CO2e/MJ for switchgrass, −10 to −2.1 g CO2e/MJ for miscanthus, and −1.21 g CO2e/MJ for corn stover.
- Switchgrass results were most sensitive to assumptions about converted forestlands and harvested wood product (HWP) carbon fate; accounting for HWP sequestration reduced switchgrass LUC GHG emissions by 3–4 g CO2e/MJ, and applying the forest proration factor (FPF) reduced them by 2–3 g CO2e/MJ.
- Corn ethanol LUC GHG emissions were lower than in previous studies, and at most contributed 20% of life-cycle GHG emissions for corn ethanol.
Methods
- Used worldwide LUC results from Purdue University’s GTAP computable general equilibrium model for four scenarios: corn ethanol expansion to 57 BL, plus corn stover (+35 BL), miscanthus (+27 BL), or switchgrass (+27 BL).
- Combined GTAP land transitions with domestic state-level soil organic carbon emission factors from a surrogate CENTURY model and U.S. Forest Service data, international carbon emission factors from Woods Hole Research Center, and aboveground forest carbon data from USDA Forest Service/NCASI COLE.
- Calculated LUC GHG emissions with Argonne National Laboratory’s CCLUB model and placed results in a life-cycle context using GREET; sensitivity analyses varied surrogate CENTURY parameters (soil cultivation coefficient, crop yield increase, erosion) and CCLUB parameters (HWP fate, FPF, tillage).
Limitations
- The paper states that addressing CGE model assumptions and their impact on LUC GHG emissions is outside its scope, and it used only one set of GTAP results; it notes that uncertainty associated with GTAP and similar models is large and difficult to estimate.
- The paper states that future advances are needed in CGE models and aboveground/belowground carbon content data, including global SOC data and further calibration of CENTURY parameters.
- The text makes evident that direct and indirect LUC could not be distinguished in GTAP results, and the forest proration factor was applied to reconcile forest land area differences among GTAP, the National Land Cover Dataset, and U.S. Forest Service data.
Model-written summary. Check it against the paper before relying on it.
Integrity signals
Registry
Cites
Statistics
Figures
Verification
Claims the paper makes
30 No basis given · 22 Own result · 14 Own interpretation · 6 Not checked yet · 1 Supported so far · 1 Own method
The sources with a verdict support this claim; the rest weren’t checked yet, have no full text we could read, or their verdicts aren’t rated yet.
In the paper
“LUC GHG emissions are also highly uncertain [14] due to large uncertainties in CGE modelling, aboveground carbon data, and SOC content data [15].”
§ Land-use change and greenhouse gas emissions from corn and cellulosic ethanol > Background
What the sources say
- Not checked yetcites [14] source
- Supportedcites [15] source
The Introduction (page unavailable) says that possible deforestation and other indirect land-use changes associated with biofuel production lead to uncertainties in GHG accounting. That supports the uncertainty point cited to this paper as [14]; the specific proposed causes follow a separate citation, [15]. (LLM, conf=0.83)
plaindirect- Asserted: passes — The authors put it forward as true.
- Checkable: passes — It can be checked against evidence.
- Load-bearing: unclear — It is unclear whether the paper’s conclusions depend on it.
- Based: passes — The paper gives a reason why it holds.
A result the paper reports from its own data — it cites no other source for it, so there is none to check. The quote shows it is in the paper.
In the paper
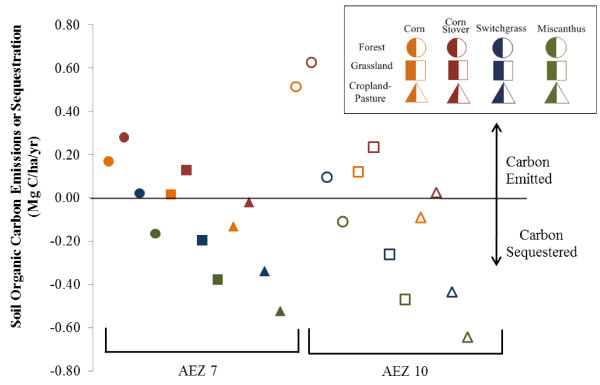
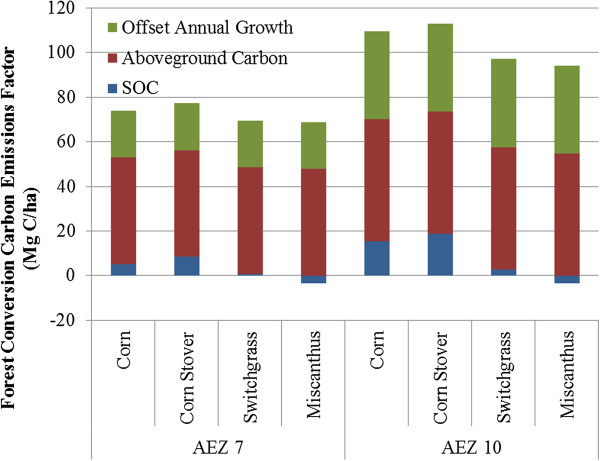
“The data in Figure 4 consistently show that, of the land use transitions we considered, conversions to miscanthus maximize carbon sequestration.”
§ Land-use change and greenhouse gas emissions from corn and cellulosic ethanol > Results and discussion > Soil organic carbon emission factors
boosteddirect- Asserted: passes — The authors put it forward as true.
- Checkable: passes — It can be checked against evidence.
- Load-bearing: passes — The paper’s conclusions depend on it.
- Based: passes — The paper gives a reason why it holds.
The paper states this without a source or data behind it here, so there is nothing to check it against. The quote shows it is in the paper.
In the paper
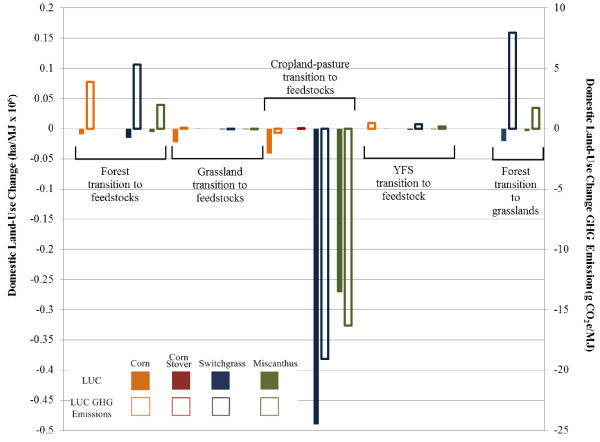
“Of the cellulosic feedstocks, corn stover has the lowest impact on domestic land use.”
§ Land-use change and greenhouse gas emissions from corn and cellulosic ethanol > Results and discussion > Land-use change
plain- Asserted: passes — The authors put it forward as true.
- Checkable: passes — It can be checked against evidence.
- Load-bearing: passes — The paper’s conclusions depend on it.
- Based: passes — The paper gives a reason why it holds.
- The authors state this as an assumption: Corn stover is treated as a waste product of corn production rather than a co-product.
None of the sources cited for this claim have been checked yet.
In the paper
“Carbon sequestration occurs when grassland or cropland-pasture is converted to switchgrass or miscanthus production, which is consistent with other studies [20,21].”
§ Land-use change and greenhouse gas emissions from corn and cellulosic ethanol > Results and discussion > Soil organic carbon emission factors
What the sources say
- Not checked yetcites [20] source
- Not checked yetcites [21]
plaindirect- Asserted: passes — The authors put it forward as true.
- Checkable: passes — It can be checked against evidence.
- Load-bearing: passes — The paper’s conclusions depend on it.
- Based: passes — The paper gives a reason why it holds.
A result the paper reports from its own data — it cites no other source for it, so there is none to check. The quote shows it is in the paper.
In the paper
“Forest conversion to miscanthus production, however, may not incur a carbon penalty.”
§ Land-use change and greenhouse gas emissions from corn and cellulosic ethanol > Results and discussion > Soil organic carbon emission factors
hedged- Asserted: passes — The authors put it forward as true.
- Checkable: passes — It can be checked against evidence.
- Load-bearing: unclear — It is unclear whether the paper’s conclusions depend on it.
- Based: passes — The paper gives a reason why it holds.
A result the paper reports from its own data — it cites no other source for it, so there is none to check. The quote shows it is in the paper.
In the paper
“Clearly, conversion of forest to produce corn or corn-corn stover results in the greatest amount of carbon emissions.”
§ Land-use change and greenhouse gas emissions from corn and cellulosic ethanol > Results and discussion > Soil organic carbon emission factors
boosteddirect- Asserted: passes — The authors put it forward as true.
- Checkable: passes — It can be checked against evidence.
- Load-bearing: passes — The paper’s conclusions depend on it.
- Based: passes — The paper gives a reason why it holds.
A result the paper reports from its own data — it cites no other source for it, so there is none to check. The quote shows it is in the paper.
In the paper
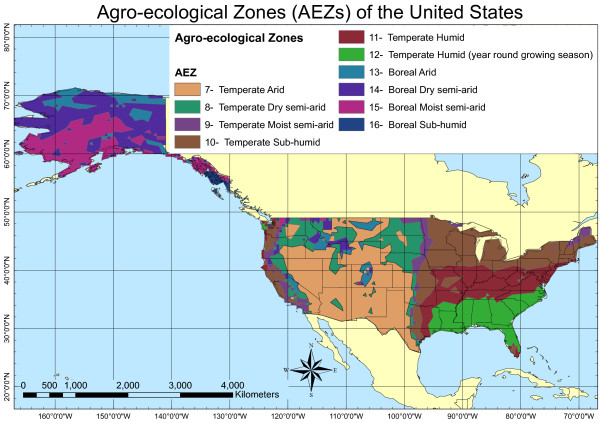
“Modelling results indicated that AEZ 10 (temperate sub-humid) is most affected by expansion of corn agriculture.”
§ Land-use change and greenhouse gas emissions from corn and cellulosic ethanol > Results and discussion > Land-use change
hedgeddirect- Asserted: passes — The authors put it forward as true.
- Checkable: passes — It can be checked against evidence.
- Load-bearing: unclear — It is unclear whether the paper’s conclusions depend on it.
- Based: passes — The paper gives a reason why it holds.
A result the paper reports from its own data — it cites no other source for it, so there is none to check. The quote shows it is in the paper.
In the paper
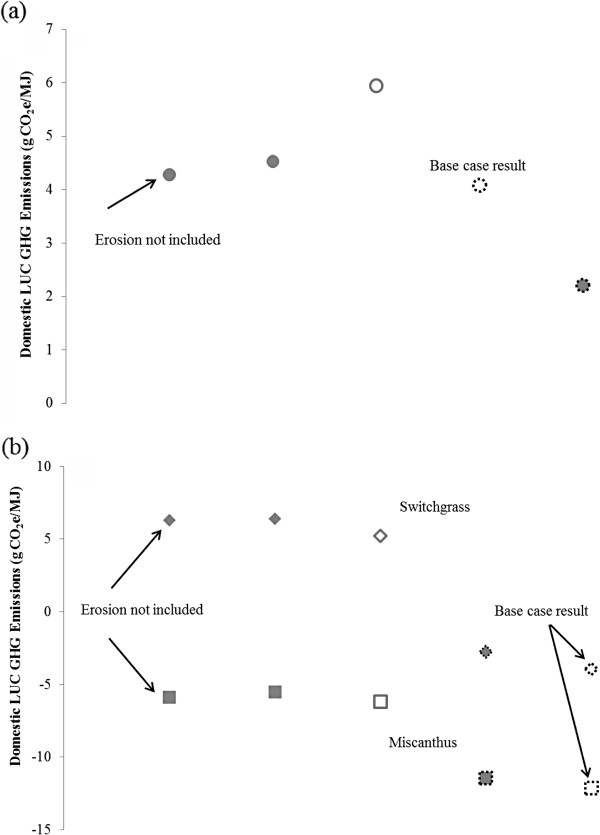
“Switchgrass ethanol base case results (2.8 g CO2e/MJ) were the most influenced by assumptions regarding converted forestlands and the fate of carbon in harvested wood products.”
§ Land-use change and greenhouse gas emissions from corn and cellulosic ethanol > Abstract > Results
plain- Asserted: passes — The authors put it forward as true.
- Checkable: passes — It can be checked against evidence.
- Load-bearing: passes — The paper’s conclusions depend on it.
- Based: passes — The paper gives a reason why it holds.
The paper states this without a source or data behind it here, so there is nothing to check it against. The quote shows it is in the paper.
In the paper
“GTAP contains significantly more forested land than either of the other two data sources.”
§ Land-use change and greenhouse gas emissions from corn and cellulosic ethanol > Results and discussion > Land-use change
plain- Asserted: passes — The authors put it forward as true.
- Checkable: passes — It can be checked against evidence.
- Load-bearing: passes — The paper’s conclusions depend on it.
- Based: passes — The paper gives a reason why it holds.
A result the paper reports from its own data — it cites no other source for it, so there is none to check. The quote shows it is in the paper.
In the paper
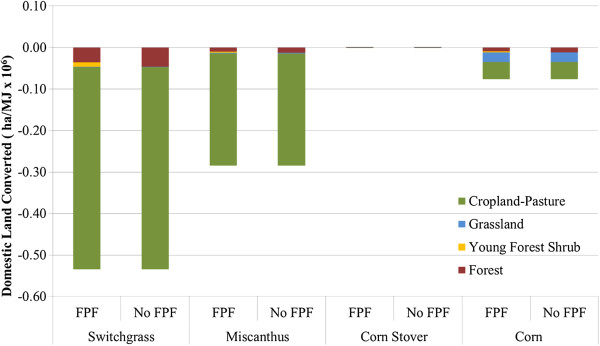
“In the case of corn ethanol (Scenario 1 in Table 1), most of the land converted in the U.S. is cropland-pasture along with some domestic forest (Figure 2).”
§ Land-use change and greenhouse gas emissions from corn and cellulosic ethanol > Results and discussion > Land-use change
plain- Asserted: passes — The authors put it forward as true.
- Checkable: passes — It can be checked against evidence.
- Load-bearing: unclear — It is unclear whether the paper’s conclusions depend on it.
- Based: passes — The paper gives a reason why it holds.
- It may state two separate claims as one. 17
- Probably not a substantial claim. 8
The paper states this without a source or data behind it here, so there is nothing to check it against. The quote shows it is in the paper.
In the paper
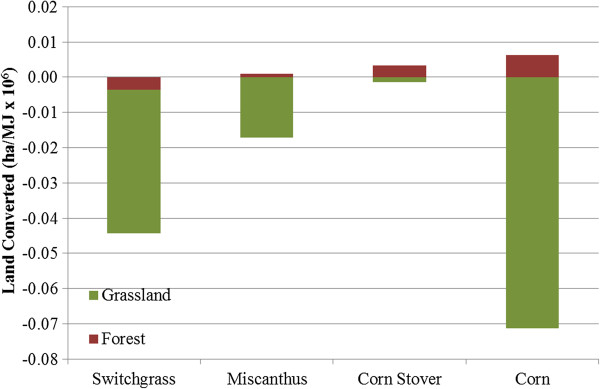
“For both corn and corn stover feedstocks, some forest land is recovered internationally, the majority of which is in Russia.”
§ Land-use change and greenhouse gas emissions from corn and cellulosic ethanol > Results and discussion > Land-use change
plain- Asserted: passes — The authors put it forward as true.
- Checkable: passes — It can be checked against evidence.
- Load-bearing: unclear — It is unclear whether the paper’s conclusions depend on it.
- Based: passes — The paper gives a reason why it holds.
It may state two separate claims as one.
The paper states this without a source or data behind it here, so there is nothing to check it against. The quote shows it is in the paper.
In the paper
“Among cellulosic crops, switchgrass production causes the most land conversion and, as it does domestically, the highest amount of forest conversion.”
§ Land-use change and greenhouse gas emissions from corn and cellulosic ethanol > Results and discussion > Land-use change
plaindirect- Asserted: passes — The authors put it forward as true.
- Checkable: passes — It can be checked against evidence.
- Load-bearing: unclear — It is unclear whether the paper’s conclusions depend on it.
- Based: passes — The paper gives a reason why it holds.
It may state two separate claims as one.
A result the paper reports from its own data — it cites no other source for it, so there is none to check. The quote shows it is in the paper.
In the paper
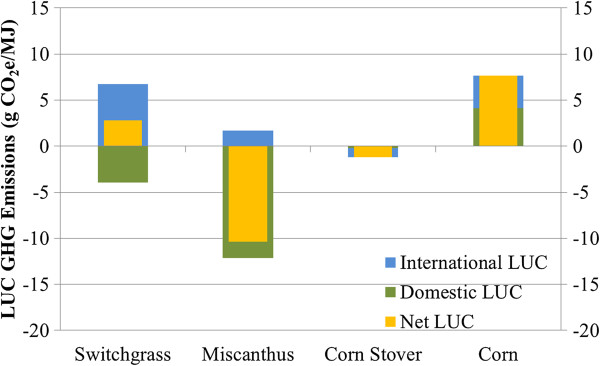
“Our results indicate that miscanthus and corn ethanol have the lowest (−10 g CO2e/MJ) and highest (7.6 g CO2e/MJ) LUC GHG emissions under base case modelling assumptions.”
§ Land-use change and greenhouse gas emissions from corn and cellulosic ethanol > Abstract > Results
hedged- Asserted: passes — The authors put it forward as true.
- Checkable: passes — It can be checked against evidence.
- Load-bearing: passes — The paper’s conclusions depend on it.
- Based: passes — The paper gives a reason why it holds.
It may state two separate claims as one.
The paper states this without a source or data behind it here, so there is nothing to check it against. The quote shows it is in the paper.
In the paper
“For both switchgrass and miscanthus ethanol, the majority of the land converted is in AEZ 7 (temperate arid) and is cropland-pasture.”
§ Land-use change and greenhouse gas emissions from corn and cellulosic ethanol > Results and discussion > Land-use change
plain- Asserted: passes — The authors put it forward as true.
- Checkable: passes — It can be checked against evidence.
- Load-bearing: unclear — It is unclear whether the paper’s conclusions depend on it.
- Based: passes — The paper gives a reason why it holds.
It may state two separate claims as one.
The paper states this without a source or data behind it here, so there is nothing to check it against. The quote shows it is in the paper.
In the paper
“Finally, LUC GHG emissions for corn stover are essentially negligible and insensitive to changes in model assumptions.”
§ Land-use change and greenhouse gas emissions from corn and cellulosic ethanol > Abstract > Results
plain- Asserted: passes — The authors put it forward as true.
- Checkable: passes — It can be checked against evidence.
- Load-bearing: passes — The paper’s conclusions depend on it.
- Based: passes — The paper gives a reason why it holds.
It may state two separate claims as one.
The paper states this without a source or data behind it here, so there is nothing to check it against. The quote shows it is in the paper.
In the paper
“LUC GHG emissions associated with corn stover were negligible.”
§ Land-use change and greenhouse gas emissions from corn and cellulosic ethanol > Conclusions and future research
plain- Asserted: passes — The authors put it forward as true.
- Checkable: passes — It can be checked against evidence.
- Load-bearing: fails — The paper’s conclusions may not depend on it.
- Based: fails — The paper may give no reason why it holds.
Probably not a substantial claim. The paper’s conclusions may not depend on it. The paper may give no reason why it holds.
The paper states this without a source or data behind it here, so there is nothing to check it against. The quote shows it is in the paper.
In the paper
“Both aboveground carbon and carbon sequestered during annual growth are greater in AEZ 10 than in AEZ 7.”
§ Land-use change and greenhouse gas emissions from corn and cellulosic ethanol > Results and discussion > Soil organic carbon emission factors
plaincorrelational- Asserted: passes — The authors put it forward as true.
- Checkable: passes — It can be checked against evidence.
- Load-bearing: unclear — It is unclear whether the paper’s conclusions depend on it.
- Based: passes — The paper gives a reason why it holds.
It may state two separate claims as one.
A result the paper reports from its own data — it cites no other source for it, so there is none to check. The quote shows it is in the paper.
In the paper
“As expected based on Figure 4, conversion of forest to corn production with stover harvest transitions incur the greatest carbon penalty whereas transition to miscanthus production results in the lowest amount of GHG emissions.”
§ Land-use change and greenhouse gas emissions from corn and cellulosic ethanol > Results and discussion > Soil organic carbon emission factors
plaindirect- Asserted: passes — The authors put it forward as true.
- Checkable: passes — It can be checked against evidence.
- Load-bearing: passes — The paper’s conclusions depend on it.
- Based: passes — The paper gives a reason why it holds.
It may state two separate claims as one.
The paper states this without a source or data behind it here, so there is nothing to check it against. The quote shows it is in the paper.
In the paper
“Less land is converted for corn ethanol production than for switchgrass, yet LUC GHG emissions for corn ethanol exceed those for all cellulosic crops.”
§ Land-use change and greenhouse gas emissions from corn and cellulosic ethanol > Results and discussion > LUC GHG emissions
plain- Asserted: passes — The authors put it forward as true.
- Checkable: passes — It can be checked against evidence.
- Load-bearing: passes — The paper’s conclusions depend on it.
- Based: passes — The paper gives a reason why it holds.
It may state two separate claims as one.
A result the paper reports from its own data — it cites no other source for it, so there is none to check. The quote shows it is in the paper.
In the paper
“LUC modelling in this case predicts slight domestic gains in both YFS and forest lands and an increase in international forest lands, which sequester enough carbon to offset the carbon emitted from cropland-pasture conversion.”
§ Land-use change and greenhouse gas emissions from corn and cellulosic ethanol > Results and discussion > LUC GHG emissions
plaindirect- Asserted: passes — The authors put it forward as true.
- Checkable: passes — It can be checked against evidence.
- Load-bearing: passes — The paper’s conclusions depend on it.
- Based: passes — The paper gives a reason why it holds.
It may state two separate claims as one.
A result the paper reports from its own data — it cites no other source for it, so there is none to check. The quote shows it is in the paper.
In the paper
“The sensitivity of LUC GHG emissions to key modelling parameters that dictate carbon emissions from converted lands is highlighted from the range of possible results in Table 5, which are affected by belowground and aboveground carbon simulation assumptions and results.”
§ Land-use change and greenhouse gas emissions from corn and cellulosic ethanol > Conclusions and future research
plaincorrelational- Asserted: passes — The authors put it forward as true.
- Checkable: passes — It can be checked against evidence.
- Load-bearing: passes — The paper’s conclusions depend on it.
- Based: passes — The paper gives a reason why it holds.
Probably not a substantial claim.
A result the paper reports from its own data — it cites no other source for it, so there is none to check. The quote shows it is in the paper.
In the paper
“International LUC GHG emissions associated with this scenario are positive, but minimal.”
§ Land-use change and greenhouse gas emissions from corn and cellulosic ethanol > Results and discussion > LUC GHG emissions
plaincorrelational- Asserted: passes — The authors put it forward as true.
- Checkable: passes — It can be checked against evidence.
- Load-bearing: passes — The paper’s conclusions depend on it.
- Based: passes — The paper gives a reason why it holds.
It may state two separate claims as one.
A conclusion the paper draws from its own results — it cites no other source for it, so there is none to check. The quote shows it is in the paper.
In the paper
“Stover harvesting may not fundamentally change corn farming and should not result in significant LUC.”
§ Land-use change and greenhouse gas emissions from corn and cellulosic ethanol > Results and discussion > Land-use change
hedgedconditional- Asserted: passes — The authors put it forward as true.
- Checkable: passes — It can be checked against evidence.
- Load-bearing: passes — The paper’s conclusions depend on it.
- Based: passes — The paper gives a reason why it holds.
It may state two separate claims as one.
- The authors state this as an assumption: Corn stover is treated as a waste product of corn production rather than a co-product.
A conclusion the paper draws from its own results — it cites no other source for it, so there is none to check. The quote shows it is in the paper.
In the paper
“Switchgrass production consumes cropland-pasture land in the United States, possibly shifting agricultural production from these lands to other countries.”
§ Land-use change and greenhouse gas emissions from corn and cellulosic ethanol > Results and discussion > Land-use change
hedgedconditional- Asserted: passes — The authors put it forward as true.
- Checkable: passes — It can be checked against evidence.
- Load-bearing: fails — The paper’s conclusions may not depend on it.
- Based: fails — The paper may give no reason why it holds.
Probably not a substantial claim. The paper’s conclusions may not depend on it. The paper may give no reason why it holds. It may state two separate claims as one.
The paper states this without a source or data behind it here, so there is nothing to check it against. The quote shows it is in the paper.
In the paper
“Few studies have considered LUC GHG emissions from cellulosic ethanol production.”
§ Land-use change and greenhouse gas emissions from corn and cellulosic ethanol > Background
plain- Asserted: passes — The authors put it forward as true.
- Checkable: passes — It can be checked against evidence.
- Load-bearing: fails — The paper’s conclusions may not depend on it.
- Based: passes — The paper gives a reason why it holds.
Probably not a substantial claim. The paper’s conclusions may not depend on it.
A conclusion the paper draws from its own results — it cites no other source for it, so there is none to check. The quote shows it is in the paper.
In the paper
“Internationally, corn causes more LUC than the other crops because, unlike the cellulosic crops, U.S. corn accounts for a large share of the international corn market and a reduction in U.S. corn exports caused by corn ethanol production increases corn production in other countries.”
§ Land-use change and greenhouse gas emissions from corn and cellulosic ethanol > Results and discussion > Land-use change
plaindirect- Asserted: passes — The authors put it forward as true.
- Checkable: passes — It can be checked against evidence.
- Load-bearing: passes — The paper’s conclusions depend on it.
- Based: passes — The paper gives a reason why it holds.
It may state two separate claims as one.
The paper states this without a source or data behind it here, so there is nothing to check it against. The quote shows it is in the paper.
In the paper
“First, application of worldwide CGE modelling to LUC GHG calculations for cellulosic ethanol has been limited to EPA and CARB analyses for switchgrass and corn stover.”
§ Land-use change and greenhouse gas emissions from corn and cellulosic ethanol > Background
plain- Asserted: passes — The authors put it forward as true.
- Checkable: passes — It can be checked against evidence.
- Load-bearing: passes — The paper’s conclusions depend on it.
- Based: fails — The paper may give no reason why it holds.
Probably not a substantial claim. The paper may give no reason why it holds.
A conclusion the paper draws from its own results — it cites no other source for it, so there is none to check. The quote shows it is in the paper.
In the paper
“They are greater than miscanthus LUC GHG emissions because switchgrass is a lower-yielding crop.”
§ Land-use change and greenhouse gas emissions from corn and cellulosic ethanol > Abstract > Results
plaindirect- Asserted: passes — The authors put it forward as true.
- Checkable: passes — It can be checked against evidence.
- Load-bearing: passes — The paper’s conclusions depend on it.
- Based: passes — The paper gives a reason why it holds.
It may state two separate claims as one.
A conclusion the paper draws from its own results — it cites no other source for it, so there is none to check. The quote shows it is in the paper.
In the paper
“LUC GHG emissions for corn ethanol are not offset by sequestration elsewhere (Figure 7) because corn reduces or only minimally enhances SOC (Figure 4).”
§ Land-use change and greenhouse gas emissions from corn and cellulosic ethanol > Results and discussion > LUC GHG emissions
plaindirect- Asserted: passes — The authors put it forward as true.
- Checkable: passes — It can be checked against evidence.
- Load-bearing: passes — The paper’s conclusions depend on it.
- Based: passes — The paper gives a reason why it holds.
It may state two separate claims as one.
A conclusion the paper draws from its own results — it cites no other source for it, so there is none to check. The quote shows it is in the paper.
In the paper
“It is important to realize, however, that the complexity inherent in modelling worldwide phenomena in the future that involve economic, biogeochemical, and biogeophysical effects will likely always lead to large uncertainties and will produce estimates of LUC GHG emissions that vary widely.”
§ Land-use change and greenhouse gas emissions from corn and cellulosic ethanol > Conclusions and future research
hedgeddirect- Asserted: passes — The authors put it forward as true.
- Checkable: fails — It may be too vague to check against evidence.
- Load-bearing: passes — The paper’s conclusions depend on it.
- Based: fails — The paper may give no reason why it holds.
Probably not a substantial claim. It may be too vague to check against evidence. The paper may give no reason why it holds. It may state two separate claims as one.
A conclusion the paper draws from its own results — it cites no other source for it, so there is none to check. The quote shows it is in the paper.
In the paper
“Similar differences may be observed between other high- and low-yield energy crops.”
§ Land-use change and greenhouse gas emissions from corn and cellulosic ethanol > Conclusions and future research
hedgedconditional- Asserted: passes — The authors put it forward as true.
- Checkable: passes — It can be checked against evidence.
- Load-bearing: fails — The paper’s conclusions may not depend on it.
- Based: passes — The paper gives a reason why it holds.
Probably not a substantial claim. The paper’s conclusions may not depend on it.
A conclusion the paper draws from its own results — it cites no other source for it, so there is none to check. The quote shows it is in the paper.
In the paper
“As described earlier, switchgrass production converts large areas of domestic cropland-pasture land, triggering conversion of lands abroad, including forests, to agriculture.”
§ Land-use change and greenhouse gas emissions from corn and cellulosic ethanol > Results and discussion > LUC GHG emissions
plaindirect- Asserted: passes — The authors put it forward as true.
- Checkable: passes — It can be checked against evidence.
- Load-bearing: passes — The paper’s conclusions depend on it.
- Based: passes — The paper gives a reason why it holds.
It may state two separate claims as one.
What the paper did — it cites no source for this, so there is none to check. The quote shows it is in the paper.
In the paper
“As discussed, we did not investigate the influence of key CGE parameters on emissions because we used only one set of GTAP results.”
§ Land-use change and greenhouse gas emissions from corn and cellulosic ethanol > Conclusions and future research
plain- Asserted: passes — The authors put it forward as true.
- Checkable: passes — It can be checked against evidence.
- Load-bearing: passes — The paper’s conclusions depend on it.
- Based: passes — The paper gives a reason why it holds.
Probably not a substantial claim.
The authors state this as an assumption.
Corn stover is treated as a waste product of corn production rather than a co-product.
“this result is unsurprising because stover is modelled as a “waste” product of corn production (as opposed to a co-product).”
Claims other papers make about this one
Each is checked against this paper’s own text: does it say what the citing paper says it does?
The source backs part of the claim, not all of it — or backs it for a different population, condition or comparison.
In the citing paper
“The LUC GHG emissions estimated here (Table 2) are comparable with our previous results for corresponding biofuels (Dunn et al. , 2013).”
From Influence of spatially dependent, modeled soil carbon emission factors on life‐cycle greenhouse gas emissions of corn and cellulosic ethanol (2016) · cites this paper as Dunn et al., 2013
Experimental — accuracy not yet measuredThe cited source says what the claim attributes to it.
In the citing paper
“The case using the updated GTAP version has lower LUC GHG emissions than the previous estimates (4.7 -11 g CO2eq MJ 1 ) (Dunn et al. , 2013) regardless of assumptions used in the SOC modeling.”
From Influence of spatially dependent, modeled soil carbon emission factors on life‐cycle greenhouse gas emissions of corn and cellulosic ethanol (2016) · cites this paper as Dunn et al., 2013
The cited source says what the claim attributes to it.
In the citing paper
“As LUC model results are a strong function of yield (Dunn et al. , 2013) and SRWC yield is fairly close to switchgrass yield in most locations, LUC modeling results for the switchgrass ethanol scenarios can shed light on what we might expect results for poplaror willow-derived ethanol to be.”
From Influence of spatially dependent, modeled soil carbon emission factors on life‐cycle greenhouse gas emissions of corn and cellulosic ethanol (2016) · cites this paper as Dunn et al., 2013
The cited source says what the claim attributes to it.
In the citing paper
“the indirect effects of bioenergy production on CO 2 emissions are also important concerns”
From Bioenergy production and environmental impacts (2018) · cites this paper as Dunn et al. 2013
In the citing paper
“net CO 2 emissions resulting from the direct use of biofuels are far less than the utilization of fossil fuel”
From Bioenergy production and environmental impacts (2018) · cites this paper as Dunn et al. 2013
In the citing paper
“Among the GHGs, CO 2 and N 2 O are two primary components because of their large quantity and multiapproaches of production”
From Bioenergy production and environmental impacts (2018) · cites this paper as Dunn et al. 2013
In the citing paper
“Corn grain ethanol is one of the most important first-generation biofuel.Its life-cycle GHG emissions are higher than cellulosic ethanol due to its potential land use change impacts [9,10].”
From Biomass and biofuels in China: Toward bioenergy resource potentials and their impacts on the environment (2018) · cites this paper as [9]
In the citing paper
“Its impacts on carbon stocks (e.g., vegetation, soil) can be so large [75,76] that biofuels' GHG benefits are offset from a life-cycle perspective [9,70].”
From Biomass and biofuels in China: Toward bioenergy resource potentials and their impacts on the environment (2018) · cites this paper as [9]
In the citing paper
“Multiple teams have subsequently applied different ecosystem carbon stock estimates to those results in order to estimate LUC emissions ( 45 , 79 , 80 ).”
From Robust paths to net greenhouse gas mitigation and negative emissions via advanced biofuels (2020) · cites this paper as [79]
Self-check
Percentages, sums and reported differences re-computed from the paper’s own numbers.
Each contradiction between two passages listed here was confirmed by an independent check.
Rated minor: it would not touch a result — a value no result rests on, a p-value that stays on the same side of the significance level, or a conflict that is clerical, resolved elsewhere in the paper, or outside its own findings.
In the paper
“| Corn stover | 4.1c | 1,070 L/had |”
§ Land-use change and greenhouse gas emissions from corn and cellulosic ethanol > Results and discussion > Land-use change
Reported 1070 · recomputed 1299.7
Rated minor: it would not touch a result — a value no result rests on, a p-value that stays on the same side of the significance level, or a conflict that is clerical, resolved elsewhere in the paper, or outside its own findings.
In the paper
“| Corn | 7.9a | 4,250 L/hab |”
§ Land-use change and greenhouse gas emissions from corn and cellulosic ethanol > Results and discussion > Land-use change
Reported 4250 · recomputed 2717.6
Rated minor: it would not touch a result — a value no result rests on, a p-value that stays on the same side of the significance level, or a conflict that is clerical, resolved elsewhere in the paper, or outside its own findings.
In the paper
§ Land-use change and greenhouse gas emissions from corn and cellulosic ethanol > Background
“The modelling considered domestic U.S. production of ethanol from four feedstocks: corn, corn ethanol, switchgrass, and miscanthus.”
§ Land-use change and greenhouse gas emissions from corn and cellulosic ethanol > Background
“In this paper, we estimate LUC GHG emissions associated with ethanol produced from four feedstocks (corn, corn stover, switchgrass, miscanthus).”
Rated minor: it would not touch a result — a value no result rests on, a p-value that stays on the same side of the significance level, or a conflict that is clerical, resolved elsewhere in the paper, or outside its own findings.
In the paper
§ Land-use change and greenhouse gas emissions from corn and cellulosic ethanol > Results and discussion > LUC GHG emissions
“CCLUB is populated with carbon EFs generated from surrogate CENTURY modelling under four scenarios outlined in Table 4.”
§ Land-use change and greenhouse gas emissions from corn and cellulosic ethanol > Results and discussion > Soil organic carbon emission factors
“| sa | X | | | X | | X | | sb | X | | X | | X | | | sc | X | | | X | X | | | sd | | X | X | | X | | | se | | X | | X | X | |”
Citations
Cites
Use of U.S. Croplands for Biofuels Increases Greenhouse Gases Through Emissions from Land-Use Change
Searchinger, T., Heimlich, R., Houghton, R. A., Dong, F., Elobeid, A., Fabiosa, J., Tokgoz, S., Hayes, D., & Yu, T.-H. (2008) · Science · doi:10.1126/science.1151861 · Cited by 4,888 · cited 2×
“However, the estimate of LUC GHG e missions for this fuel has decreased substantially compared to earlier studies [1,2,11,12,36].”
Land Clearing and the Biofuel Carbon Debt
Fargione, J., Hill, J., Tilman, D., Polasky, S., & Hawthorne, P. (2008) · Science · doi:10.1126/science.1152747 · Cited by 3,902
Tropical forests were the primary sources of new agricultural land in the 1980s and 1990s
Gibbs, H. K., Ruesch, A. S., Achard, F., Clayton, M. K., Holmgren, P., Ramankutty, N., & Foley, J. A. (2010) · Proceedings of the National Academy of Sciences · doi:10.1073/pnas.0910275107 · Cited by 1,876
U.S. Billion-Ton Update: Biomass Supply for a Bioenergy and Bioproducts Industry
Downing, M. E., Eaton, L., Graham, R. L., Langholtz, M. H., Perlack, R. D., Turhollow, A., Stokes, B. J., & Brandt, C. C. (2011) · doi:10.2172/1023318 · Cited by 1,006
Land use/land cover changes and climate: modeling analysis and observational evidence
Pielke, R. A., Pitman, A. J., Niyogi, D., Mahmood, R., McAlpine, C., Hossain, F., Goldewijk, K. K., Nair, U. S., Betts, R., Fall, S., et al. (2011) · Wiley Interdisciplinary Reviews Climate Change · doi:10.1002/wcc.144 · Cited by 920
Hertel, T. W., Golub, A. A., Jones, A. D., O'Hare, M., Plevin, R. J., & Kammen, D. M. (2010) · BioScience · doi:10.1525/bio.2010.60.3.8 · Cited by 554
Wang, M., Han, J., Dunn, J. B., Cai, H., & Elgowainy, A. (2012) · Environmental Research Letters · doi:10.1088/1748-9326/7/4/045905 · Cited by 536
Self-citationPlevin, R. J., Jones, A. D., Torn, M. S., & Gibbs, H. K. (2010) · Environmental Science & Technology · doi:10.1021/es101946t · Cited by 443
Climate change and health costs of air emissions from biofuels and gasoline
Hill, J., Polasky, S., Nelson, E., Tilman, D., Huo, H., Ludwig, L., Neumann, J., Zheng, H., & Bonta, D. (2009) · Proceedings of the National Academy of Sciences · doi:10.1073/pnas.0812835106 · Cited by 335
Economic Analysis of Land Use in Global Climate Change Policy
Hertel, T. W., Rose, S. K., & Tol, R. S. J. (2009) · Routledge eBooks · doi:10.4324/9780203882962 · Cited by 259
Cited by
Sorted by citations
Environmental sustainability of biofuels: a review
Jeswani, H. K., Chilvers, A., & Azapagic, A. (2020) · Proceedings of the Royal Society A Mathematical Physical and Engineering Sciences · doi:10.1098/rspa.2020.0351 · Cited by 762
Wang, M., Han, J., Dunn, J. B., Cai, H., & Elgowainy, A. (2012) · Environmental Research Letters · doi:10.1088/1748-9326/7/4/045905 · Cited by 536
Self-citationSustainability of sugarcane production in Brazil. A review
Bordonal, R. D. O., Carvalho, J. L. N., Lal, R., de Figueiredo, E. B., de Oliveira, B. G., & Scala, N. L. (2018) · Agronomy for Sustainable Development · doi:10.1007/s13593-018-0490-x · Cited by 561
Life-cycle analysis of greenhouse gas emissions from renewable jet fuel production
de Jong, S., Antonissen, K., Hoefnagels, R., Laura, L., Wang, M., Faaij, A. P. C., & Junginger, M. (2017) · Biotechnology for Biofuels · doi:10.1186/s13068-017-0739-7 · Cited by 394
Self-citationLignin–Enzyme Interactions in the Hydrolysis of Lignocellulosic Biomass
Santos, A. C., Ximenes, E. D. A., Kim, Y., & Ladisch, M. R. (2018) · Trends in biotechnology · doi:10.1016/j.tibtech.2018.10.010 · Cited by 266
Soil carbon sequestration and land use change associated with biofuel production: empirical evidence
Qin, Z., Dunn, J. B., Kwon, H., Mueller, S., & Wander, M. M. (2016) · GCB Bioenergy · doi:10.1111/gcbb.12237 · Cited by 208
Self-citationLife-cycle analysis of bio-based aviation fuels
Han, J., Elgowainy, A., Cai, H., & Wang, M. Q. (2013) · Bioresource Technology · doi:10.1016/j.biortech.2013.07.153 · Cited by 175
Self-citationQin, Z., Zhuang, Q., Cai, X., He, Y., Huang, Y., Jiang, D., Lin, E., Liu, Y., Tang, Y., & Wang, M. Q. (2018) · Renewable and Sustainable Energy Reviews · doi:10.1016/j.rser.2017.08.073 · Cited by 174
Self-citationRobust paths to net greenhouse gas mitigation and negative emissions via advanced biofuels
Field, J. L., Richard, T. L., Smithwick, E. A. H., Cai, H., Laser, M. S., LeBauer, D. S., Long, S. P., Paustian, K., Qin, Z., Sheehan, J. J., et al. (2020) · Proceedings of the National Academy of Sciences · doi:10.1073/pnas.1920877117 · Cited by 173
“Multiple teams have subsequently applied different ecosystem carbon stock estimates to those results in order to estimate LUC emissions (45, 79, 80).”
Self-citationSurvey of Plant Density Tolerance in U.S. Maize Germplasm
Mansfield, B. D., & Mumm, R. H. (2013) · Crop Science · doi:10.2135/cropsci2013.04.0252 · Cited by 169
Sustainable Lactic Acid Production from Lignocellulosic Biomass
Li, Y., Bhagwat, S. S., Cortes-Pena, Y. R., Ki, D., Rao, C. V., Jin, Y., & Guest, J. S. (2021) · ACS Sustainable Chemistry & Engineering · doi:10.1021/acssuschemeng.0c08055 · Cited by 174
Ahlgren, S., & Lucia, L. D. (2014) · Biotechnology for Biofuels · doi:10.1186/1754-6834-7-35 · Cited by 145
Biofuels and Their Co-Products as Livestock Feed: Global Economic and Environmental Implications
Popp, J., Harangi-Rákos, M., Gabnai, Z., Balogh, P., Antal, G., & Bai, A. (2016) · Molecules · doi:10.3390/molecules21030285 · Cited by 142
“Recent LUC GHG results indicate that Searchinger and Heimlich [87] originally over-estimated LUC GHG emissions significantly [91].”
Life cycle analysis of fuel production from fast pyrolysis of biomass
Han, J., Elgowainy, A., Dunn, J. B., & Wang, M. (2013) · Bioresource Technology · doi:10.1016/j.biortech.2013.01.141 · Cited by 140
Self-citationBioenergy production and environmental impacts
Wu, Y., Zhao, F., Liu, S., Wang, L., Qiu, L., Alexandrov, G., & Jothiprakash, V. (2018) · Geoscience Letters · doi:10.1186/s40562-018-0114-y · Cited by 138
Review of sustainable energy carriers for aviation: Benefits, challenges, and future viability
Ansell, P. J. (2023) · Progress in Aerospace Sciences · doi:10.1016/j.paerosci.2023.100919 · Cited by 128
Fisher, M. A., Boyarskiy, S., Yamada, M. R., Kong, N., Bauer, Š., & Tullman‐Ercek, D. (2013) · ACS Synthetic Biology · doi:10.1021/sb400065q · Cited by 122
Aui, A., Wang, Y., & Wright, M. M. (2021) · Renewable and Sustainable Energy Reviews · doi:10.1016/j.rser.2021.111098 · Cited by 114
Carbon Accounting and Economic Model Uncertainty of Emissions from Biofuels-Induced Land Use Change
Plevin, R. J., Beckman, J. F., Golub, A., Witcover, J., & O’Hare, M. (2015) · Environmental Science & Technology · doi:10.1021/es505481d · Cited by 107
Estimating induced land use change emissions for sustainable aviation biofuel pathways
Zhao, X., Taheripour, F., Malina, R. M., Staples, M. D., & Tyner, W. E. (2021) · The Science of The Total Environment · doi:10.1016/j.scitotenv.2021.146238 · Cited by 105
A comparison of Land Use Change models: challenges and future developments
Rosa, M. D., Knudsen, M. T., & Hermansen, J. (2016) · Journal of Cleaner Production · doi:10.1016/j.jclepro.2015.11.097 · Cited by 97
Lee, U., Kwon, H., Wu, M. M., & Wang, M. (2021) · Biofuels Bioproducts and Biorefining · doi:10.1002/bbb.2225 · Cited by 99
Self-citationBiomass to biofuel: Impacts and mitigation of environmental, health, and socioeconomic challenges
Chowdhury, P., Mahi, N. A., Yeassin, R., Chowdhury, N.-U.-R., & Farrok, O. (2025) · Energy Conversion and Management X · doi:10.1016/j.ecmx.2025.100889 · Cited by 104
Land-water-food nexus of biofuels: Discourse and policy debates in Brazil
Lázaro, L. L. B., Giatti, L. L., de Sousa, W. C., & Giarolla, A. (2020) · Environmental Development · doi:10.1016/j.envdev.2019.100491 · Cited by 87
Life cycle environmental analysis of ‘drop in’ alternative aviation fuels: a review
Kolosz, B. W., Luo, Y., Xu, B. L., Maroto‐Valer, M. M., & Andrésen, J. M. (2020) · Sustainable Energy & Fuels · doi:10.1039/c9se00788a · Cited by 99
Gerbrandt, K., Chu, P. L., Simmonds, A., Mullins, K. A., MacLean, H. L., Griffin, W. M., & Saville, B. A. (2016) · Current Opinion in Biotechnology · doi:10.1016/j.copbio.2015.12.021 · Cited by 85
THE ROLE OF BIOFUELS IN FOOD COMMODITY PRICES VOLATILITY AND LAND USE
Oláh, J., Lengyel, P., Balogh, P., Harangi–Rákos, M., & Popp, J. (2017) · Journal of Competitiveness · doi:10.7441/joc.2017.04.06 · Cited by 84
Carbon intensity of corn ethanol in the United States: state of the science
Scully, M. J., Norris, G. A., Falconi, T. M. A., & MacIntosh, D. L. (2021) · Environmental Research Letters · doi:10.1088/1748-9326/abde08 · Cited by 82
Gelfand, I., Hamilton, S. K., Kravchenko, A. N., Jackson, R. D., Thelen, K. D., & Robertson, G. P. (2020) · Environmental Science & Technology · doi:10.1021/acs.est.9b07019 · Cited by 79
Schmer, M. R., Vogel, K. P., Varvel, G. E., Follett, R. F., Mitchell, R. B., & Jin, V. L. (2014) · PLoS ONE · doi:10.1371/journal.pone.0089501 · Cited by 74
The greenhouse gas benefits of corn ethanol – assessing recent evidence
Lewandrowski, J. K., Rosenfeld, J. K., Pape, D., Hendrickson, T., Jaglo, K., & Moffroid, K. (2019) · Biofuels · doi:10.1080/17597269.2018.1546488 · Cited by 74
Qin, Z., Dunn, J. B., Kwon, H., Mueller, S., & Wander, M. M. (2016) · GCB Bioenergy · doi:10.1111/gcbb.12333 · Cited by 72
“Detailed information regarding CCLUB and GREET modeling can also be found at Dunn et al. (2014) and Wang et al. (2012), respectively.”
BackgroundMethodInfluentialSelf-citationLife-cycle Analysis of Bioproducts and Their Conventional Counterparts in GREET
Argonne National Lab. (ANL), A., Dunn, J., Bioenergy Technologies Office (EE-3B) USDOE Office of Energy Efficiency and Renewable Energy (EERE), Adom, F. K., Sather, N. F., Han, J., Snyder, S., He, C., Gong, J., Yue, D., et al. (2015) · OSTI OAI (U.S. Department of Energy Office of Scientific and Technical Information) · doi:10.2172/1250468 · Cited by 69
Self-citationCai, H., Dunn, J. B., Wang, Z., Han, J., & Wang, M. (2013) · Biotechnology for Biofuels · doi:10.1186/1754-6834-6-141 · Cited by 68
Self-citationMumm, R. H., Goldsmith, P., Rausch, K. D., & Stein, H. H. (2014) · Biotechnology for Biofuels · doi:10.1186/1754-6834-7-61 · Cited by 67
Well-to-wake analysis of ethanol-to-jet and sugar-to-jet pathways
Han, J., Tao, L., & Wang, M. (2017) · Biotechnology for Biofuels · doi:10.1186/s13068-017-0698-z · Cited by 79
Self-citationIntegrated production of biodiesel and bioethanol from sweet potato
Silva, J. O. V. E., Almeida, M. F., Alvim-Ferraz, M. C. M., & Dias, J. M. (2017) · Renewable Energy · doi:10.1016/j.renene.2017.07.052 · Cited by 65
Predicting soil C changes over sugarcane expansion in Brazil using the DayCent model
Oliveira, D. M. D. S., Williams, S., Cerri, C. E. P., & Paustian, K. H. (2017) · GCB Bioenergy · doi:10.1111/gcbb.12427 · Cited by 62
Canter, C. E., Dunn, J. B., Han, J., Wang, Z., & Wang, M. (2015) · BioEnergy Research · doi:10.1007/s12155-015-9664-4 · Cited by 57
Self-citationLand management change greatly impacts biofuels’ greenhouse gas emissions
Qin, Z., Canter, C. E., Dunn, J. B., Mueller, S., Kwon, H., Han, J., Wander, M. M., & Wang, M. (2018) · GCB Bioenergy · doi:10.1111/gcbb.12500 · Cited by 59
Self-citationLife cycle assessment of UV-Curable bio-based wood flooring coatings
Montazeri, M., & Eckelman, M. J. (2018) · Journal of Cleaner Production · doi:10.1016/j.jclepro.2018.04.209 · Cited by 59
A review of domestic land use change attributable to U.S. biofuel policy
Austin, K. G., Jones, J., & Clark, C. M. (2022) · Renewable and Sustainable Energy Reviews · doi:10.1016/j.rser.2022.112181 · Cited by 55
Zaimes, G. G., Soratana, K., Harden, C. L., Landis, A. E., & Khanna, V. (2015) · Environmental Science & Technology · doi:10.1021/acs.est.5b00129 · Cited by 55
Hoekman, S. K., & Broch, A. (2017) · Renewable and Sustainable Energy Reviews · doi:10.1016/j.rser.2017.05.052 · Cited by 56
Zaimes, G. G., Beck, A. W., Janupala, R. R., Resasco, D. E., Crossley, S. P., Lobban, L. L., & Khanna, V. (2017) · Energy & Environmental Science · doi:10.1039/c7ee00682a · Cited by 55
Emery, I., Mueller, S., Qin, Z., & Dunn, J. B. (2017) · Environmental Science & Technology · doi:10.1021/acs.est.6b04189 · Cited by 53
Self-citationBachmann, M., Kätelhön, A., Winter, B., Meys, R., Müller, L. J., & Bardow, A. (2021) · Faraday Discussions · doi:10.1039/d0fd00134a · Cited by 53
Qin, Z., Zhuang, Q., & Cai, X. (2014) · GCB Bioenergy · doi:10.1111/gcbb.12212 · Cited by 54
Production of cellulosic organic acids via synthetic fungal consortia
Scholz, S. A., Graves, I., Minty, J. J., & Lin, X. N. (2017) · Biotechnology and Bioengineering · doi:10.1002/bit.26509 · Cited by 49
Lee, D.-Y., & Thomas, V. M. (2016) · Journal of Cleaner Production · doi:10.1016/j.jclepro.2016.10.139 · Cited by 55
Cruz, C. H. B., Souza, G. M., & Cortez, L. A. B. (2014) · Elsevier eBooks · doi:10.1016/b978-0-08-099424-6.00011-9 · Cited by 44
Pourbafrani, M., McKechnie, J., Shen, T., Saville, B. A., & MacLean, H. L. (2014) · Journal of Cleaner Production · doi:10.1016/j.jclepro.2014.04.050 · Cited by 42
Yan, H., Guo, X., Zhao, S., & Yang, H. (2022) · Land · doi:10.3390/land11070997 · Cited by 42
Plevin, R. J. (2016) · Journal of Industrial Ecology · doi:10.1111/jiec.12507 · Cited by 44
Ye, H., Peng, H., Li, C., Li, Y., Li, Z., Yang, Q., & Chen, G. Q. (2022) · Journal of Environmental Management · doi:10.1016/j.jenvman.2022.117003 · Cited by 40
Marginal lands for bioenergy in China; an outlook in status, potential and management
Qaseem, M. F., & Wu, A. (2020) · GCB Bioenergy · doi:10.1111/gcbb.12770 · Cited by 40
Garcia, D. J., & You, F. (2018) · Journal of Cleaner Production · doi:10.1016/j.jclepro.2018.02.012 · Cited by 38
Towards aromatics from biomass: Prospective Life Cycle Assessment of bio-based aniline
Winter, B., Meys, R., & Bardow, A. (2021) · Journal of Cleaner Production · doi:10.1016/j.jclepro.2021.125818 · Cited by 37
Xue, X., Pang, Y., & Landis, A. E. (2014) · Renewable Energy · doi:10.1016/j.renene.2013.12.026 · Cited by 36
Cai, H., Prussi, M., Ou, L., Wang, M., Yugo, M., Laura, L., & Scarlat, N. (2022) · Sustainable Energy & Fuels · doi:10.1039/d2se00411a · Cited by 32
Self-citationWise, M., Hodson, E. L., Mignone, B. K., Clarke, L., WALDHOFF, S. T., & Luckow, P. (2015) · Energy Economics · doi:10.1016/j.eneco.2015.05.009 · Cited by 31
Wang, Z., Dunn, J. B., Han, J., & Wang, M. (2015) · Biotechnology for Biofuels · doi:10.1186/s13068-015-0350-8 · Cited by 31
Self-citationZhang, J., Yoo, E., Davison, B. H., Liu, D., Schaidle, J. A., Tao, L., & Li, Z. (2021) · Green Chemistry · doi:10.1039/d1gc02854e · Cited by 30
Rajagopal, D. (2013) · Environmental Research Letters · doi:10.1088/1748-9326/8/2/024013 · Cited by 30
Mahmud, N., & Rosentrater, K. A. (2019) · Energies · doi:10.3390/en13010155 · Cited by 27
Elliott, J. W., Sharma, B., Best, N., Glotter, M. J., Dunn, J. B., Foster, I. T., Miguez, F. E., Mueller, S., & Wang, M. (2014) · Environmental Science & Technology · doi:10.1021/es404546r · Cited by 25
Self-citationSustainable energy crop production
Grosso, S. J. D., Smith, P., Galdos, M. V., Hastings, A., & Parton, W. J. (2014) · Current Opinion in Environmental Sustainability · doi:10.1016/j.cosust.2014.07.007 · Cited by 30
Batten, R., Karanjikar, M., & Spatari, S. (2024) · Sustainable Energy & Fuels · doi:10.1039/d3se01470c · Cited by 26
Lund, M. T., Berntsen, T. K., & Fuglestvedt, J. S. (2014) · Environmental Science & Technology · doi:10.1021/es505308g · Cited by 26
Wang, Y., & Cheng, M. (2018) · Journal of Cleaner Production · doi:10.1016/j.jclepro.2018.02.080 · Cited by 24
Exergy and CO2 Analyses as Key Tools for the Evaluation of Bio-Ethanol Production
Kang, Q. K., & Tan, T. (2016) · Sustainability · doi:10.3390/su8010076 · Cited by 22
Handler, R. M., Shi, R., & Shonnard, D. R. (2017) · Journal of Cleaner Production · doi:10.1016/j.jclepro.2017.03.149 · Cited by 22
Plant Growth-Promoting Microbial Enzymes
Flores‐Gallegos, A. C., & Nava-Reyna, E. (2018) · Elsevier eBooks · doi:10.1016/b978-0-12-813280-7.00030-x · Cited by 22
Impact of Land Use Changes on Soil and Vegetation Characteristics in Fereydan, Iran
Eghdami, H., Azhdari, G., Lebailly, P., & Azadi, H. (2019) · Agriculture · doi:10.3390/agriculture9030058 · Cited by 21
Lamers, P., Avelino, A. F. T., Zhang, Y., Tan, E. C. D., Young, B., Vendries, J., & Chum, H. L. (2021) · Environmental Science & Technology · doi:10.1021/acs.est.0c08449 · Cited by 21
Benavides, P. T., Gracida-Alvarez, U. R., Richa, K., Port, J., & Hawkins, T. R. (2025) · Bioresource Technology · doi:10.1016/j.biortech.2025.132565 · Cited by 20
A Conceptual Review on Using Consequential Life Cycle Assessment Methodology for the Energy Sector
Luu, L. Q., Longo, S., Cellura, M., Sanseverino, E. R., Cusenza, M. A., & Franzitta, V. (2020) · Energies · doi:10.3390/en13123076 · Cited by 20
Emery, I. R., & Mosier, N. S. (2014) · GCB Bioenergy · doi:10.1111/gcbb.12196 · Cited by 18
Han, J., Office of Sustainable Transportation. Bioenergy Technologies Office (BETO) USDOE Office of Energy Efficiency and Renewable Energy (EERE), Elgowainy, A., Wang, M., & DiVita, V. B. (2015) · doi:10.2172/1212715 · Cited by 18
Self-citationWang, Y., Delgado, M. S., Sesmero, J., & Gramig, B. M. (2020) · American Journal of Agricultural Economics · doi:10.1111/ajae.12119 · Cited by 17
Ye, H., Huang, Y., Chen, P., Huang, W., Zhang, S., Huang, S., & Hou, S. (2016) · Journal of Integrative Agriculture · doi:10.1016/s2095-3119(15)61066-8 · Cited by 17
Developing bioenergy to tackle climate change
Zhang, X.-Y. (2016) · Advances in Climate Change Research · doi:10.1016/j.accre.2016.06.001 · Cited by 18
Relay cropping as an adaptive strategy to cope with climate change
Gesch, R. W., Berti, M. T., Eberle, C. A., & Weyers, S. L. (2023) · Agronomy Journal · doi:10.1002/agj2.21343 · Cited by 17
Cellulosic Ethanol Production: Assessment of the Impacts of Learning and Plant Capacity
Aui, A., & Wang, Y. (2022) · Technological Forecasting and Social Change · doi:10.1016/j.techfore.2023.122923 · Cited by 14
MWANGI, N. N., Waithaka, E. H., Mundia, C. N., Kinyanjui, M. J., & Mutua, F. N. (2020) · Modeling Earth Systems and Environment · doi:10.1007/s40808-020-00781-2 · Cited by 14
Wang, Y., Zhang, B., & Bao, J. (2025) · ACS Sustainable Chemistry & Engineering · doi:10.1021/acssuschemeng.4c10527 · Cited by 13
Haus, M. O., Winter, B., Fleitmann, L., Palkovits, R., & Bardow, A. (2022) · Green Chemistry · doi:10.1039/d2gc01219g · Cited by 13
Abbas, H. M. M., Sultan, H., Shah, A., Tahir, A., Iltaf, H., & Nie, L. (2025) · Renewable and Sustainable Energy Reviews · doi:10.1016/j.rser.2025.116335 · Cited by 13
Liu, X., Kwon, H., & Wang, M. (2021) · Environmental Research Letters · doi:10.1088/1748-9326/ac018f · Cited by 13
Self-citationBarter mode: The institutional innovation for affordable and clean energy (SDG7) in rural China
Wang, S., Yin, C., Yang, X., & Richel, A. (2023) · Biomass and Bioenergy · doi:10.1016/j.biombioe.2023.106725 · Cited by 13
Assessing land-use impacts by clean vehicle systems
Pontau, P., Hou, Y., Cai, H., Yi, Z., Jia, X., Chiu, A. S. F., & Xu, M. (2015) · Resources Conservation and Recycling · doi:10.1016/j.resconrec.2014.12.008 · Cited by 13
Wang, Z., Dunn, J. B., Han, J., & Wang, M. Q. (2013) · doi:10.2172/1148669 · Cited by 13
Self-citationGarcia, A., Marín, P., & Ordóñez, S. (2023) · Fuel Processing Technology · doi:10.1016/j.fuproc.2023.108007 · Cited by 12
Well-to-wake analysis of switchgrass to jet fuel via a novel co-fermentation of sugars and CO2
Pamula, A. S. P., Lampert, D. J., & Atiyeh, H. K. (2021) · The Science of The Total Environment · doi:10.1016/j.scitotenv.2021.146770 · Cited by 12
Second-Generation Ethanol from Lignocellulose
Parsons, S., McManus, M. C., & Taylor, C. M. (2017) · Elsevier eBooks · doi:10.1016/b978-0-08-101036-5.00013-6 · Cited by 12
Carbon Calculator for Land Use Change from Biofuels Production (CCLUB)
Argonne National Lab. (ANL), A., Qin, Z., Bioenergy Technologies Office (EE-3B) USDOE Office of Energy Efficiency and Renewable Energy (EERE), Kwon, H., Dunn, J., Mueller, S., Wander, M. M., & Wang, M. (2018) · doi:10.2172/1480518 · Cited by 12
Self-citationSampedro, J., Kyle, P. G., Ramig, C., Tanner, D., Huster, J. E., & Wise, M. (2021) · Applied Energy · doi:10.1016/j.apenergy.2021.117580 · Cited by 11
Environmental, social, and economic impacts of renewable energy sources
Kabir, Z., Sultana, N., & Khan, I. (2022) · Elsevier eBooks · doi:10.1016/b978-0-323-88668-0.00009-7 · Cited by 12
Impact of Bioenergy on Environmental Sustainability
Pathak, K. K., & Das, S. (2019) · Energy, environment, and sustainability · doi:10.1007/978-981-15-0410-5_10 · Cited by 11
Posada, J. A., & Osseweijer, P. (2016) · Elsevier eBooks · doi:10.1016/b978-0-12-802323-5.00026-8 · Cited by 11
Metadata
- Authors
- Dunn, J. B., Mueller, S., Kwon, H.-Y., & Wang, M. Q.
- Affiliations
- Argonne National Laboratory (US)
- University of Illinois Chicago (US)
- Corresponding author
- Dunn, Jennifer B
- Venue
- Biotechnology for Biofuels
- Published
- 2013
- Volume
- 6
- Issue
- 1
- Pages
- 51
- ISSN
- 1754-6834 (ISSN-L)
- PMC
- PMC3662634
- OpenAlex
- W2152396357
- Cited by
- 167
- References
- 29
- Citations by year
- 2026: 4 · 2025: 10 · 2024: 8 · 2023: 9 · 2022: 10 · 2021: 18 · 2020: 15 · 2019: 4 · 2018: 16 · 2017: 18 · 2016: 15 · 2015: 13 · 2014: 15 · 2013: 11
- FWCI
- 38.25
- Type
- journal article
- Language
- en
- Open access
- gold
- doi.org
- Licence
- cc-by
- Locations
- Biotechnology for Biofuels (publishedVersion, cc-by)
- Europe PMC (PubMed Central) (publishedVersion, cc-by)
- PubMed Central (publishedVersion, cc-by)
- PubMed (publishedVersion)
- OSTI OAI (U.S. Department of Energy Office of Scientific and Technical Information) (submittedVersion)
- Funders
- U.S. Department of Energy (DE‐ AC02‐06CH11357, Contract No. DE-AC02-06CH11357., AC02‐06CH11357, 06CH11357, No. DE-AC02-06CH11357, DE-AC02-)
- Purdue University
- University of Chicago (DE-AC02-06CH11357)
- University of Illinois at Urbana-Champaign
- Biomass Program (DE-AC02-06CH11357)
- Topics
- Life Sciences › Agricultural and Biological Sciences › Agronomy and Crop Science › Bioenergy crop production and management
- Physical Sciences › Engineering › Biomedical Engineering › Biofuel production and bioconversion
- Physical Sciences › Environmental Science › Environmental Engineering › Environmental Impact and Sustainability
- Keywords
- land use change, greenhouse gas emissions, bioethanol, corn ethanol, cellulosic ethanol, corn stover, switchgrass, Miscanthus, biofuel feedstock, computable general equilibrium model, harvested wood products
About these checks
Registry, retraction, Cites and statistics results are computed, not judged, with one exception: a printed reference that no index lists is read once by a model before it counts as a citation error. Claims are extracted by a model and kept only when their quote appears verbatim in the text; each cited source is then checked, with a model’s help, for whether it says what the claim relies on. Those verdicts can be wrong — read the claim’s quote and the cited source before relying on one.
A language model drew the claims from the paper on 2026-10-10, under version 3 of the claim definition (model deepseek-v4.1-flash, prompt extract-v3).
A second model labelled each claim on 2026-10-10 (model jev-1.13-20260917, definition revision gold-guideline-v0.2).
Cited sources are checked with a language model’s help (gpt-6-sol).
Statistics and arithmetic are recomputed, not judged.
Confidence bands are shown only for fields calibrated on our annotated test set. None is calibrated yet, so no band is shown.
What counts as a claim ›How we measure confidence ›How we check this ›
Are you an author, or do you see a problem with this page? Request a review
