

The DOI matches its Crossref record; 346 of the 347 references it cites were found in a registry or an index.
Functional coordination of alternative splicing in the mammalian central nervous system
Open accessAbstract
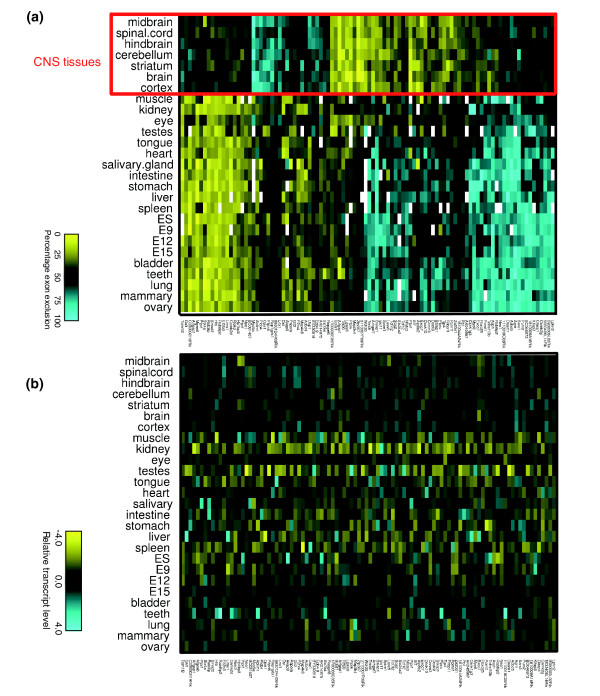
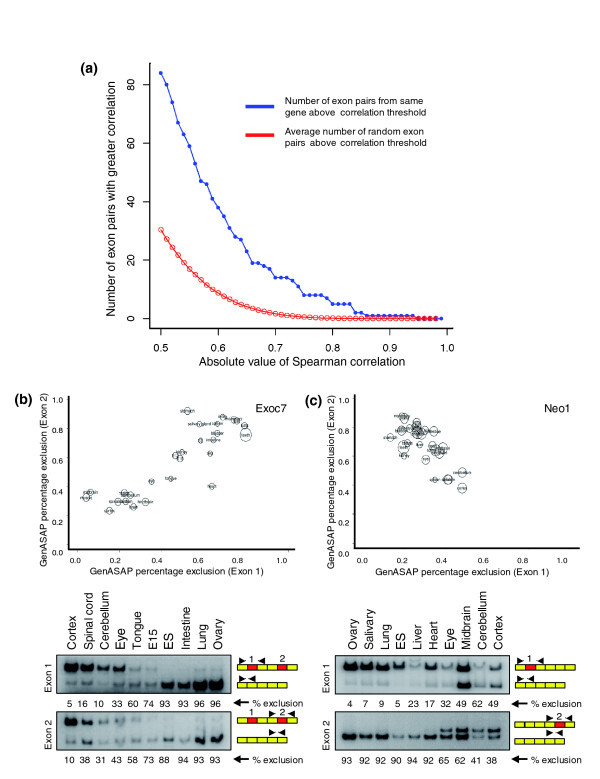
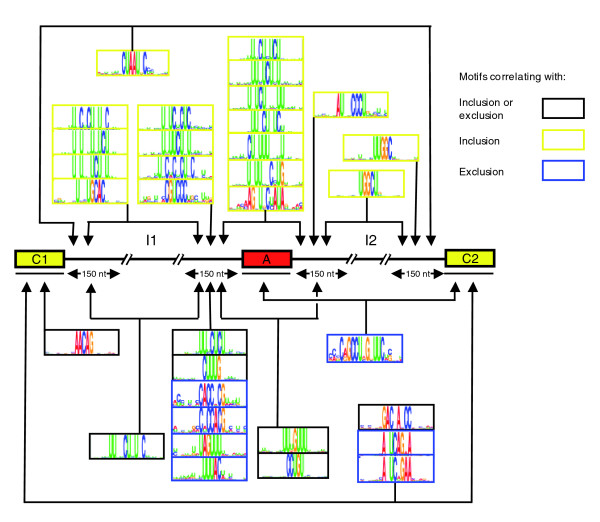
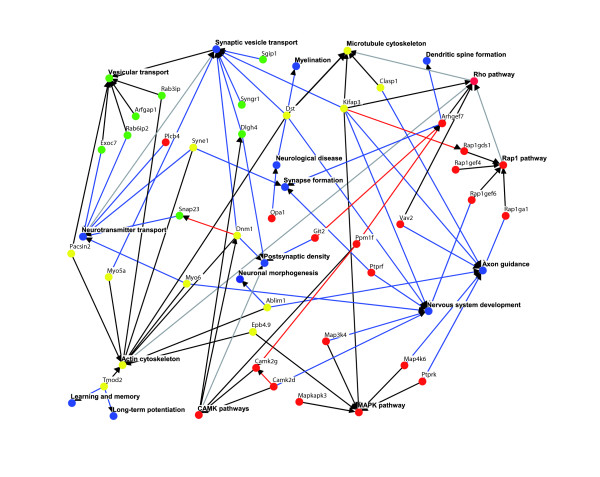
Background: Alternative splicing (AS) functions to expand proteomic complexity and plays numerous important roles in gene regulation. However, the extent to which AS coordinates functions in a cell and tissue type specific manner is not known. Moreover, the sequence code that underlies cell and tissue type specific regulation of AS is poorly understood. Results: Using quantitative AS microarray profiling, we have identified a large number of widely expressed mouse genes that contain single or coordinated pairs of alternative exons that are spliced in a tissue regulated fashion. The majority of these AS events display differential regulation in central nervous system (CNS) tissues. Approximately half of the corresponding genes have neural specific functions and operate in common processes and interconnected pathways. Differential regulation of AS in the CNS tissues correlates strongly with a set of mostly new motifs that are predominantly located in the intron and constitutive exon sequences neighboring CNS-regulated alternative exons. Different subsets of these motifs are correlated with either increased inclusion or increased exclusion of alternative exons in CNS tissues, relative to the other profiled tissues. Conclusion: Our findings provide new evidence that specific cellular processes in the mammalian CNS are coordinated at the level of AS, and that a complex splicing code underlies CNS specific AS regulation. This code appears to comprise many new motifs, some of which are located in the constitutive exons neighboring regulated alternative exons. These data provide a basis for understanding the molecular mechanisms by which the tissue specific functions of widely expressed genes are coordinated at the level of AS.
Overview
The claims and statistics of this paper haven’t been checked yet.
Run the check — free, no account needed. It reads the open-access text and checks the sources it cites.
Integrity signals
Registry
Cites
Statistics
Figures
Verification
Claims the paper makes
The claims and statistics of this paper haven’t been checked yet.
Run the check — free, no account needed. It reads the open-access text and checks the sources it cites.
Claims other papers make about this one
Each is checked against this paper’s own text: does it say what the citing paper says it does?
In the citing paper
“Consistent with previous results (Fagnani et al., 2007; Pan et al., 2004), there is little overlap (8.5%) between genes with neural-regulated AS and mRNA expression, although these subsets of genes are highly enriched in overlapping GO terms (40% in common; Figure S1).”
From A Highly Conserved Program of Neuronal Microexons Is Misregulated in Autistic Brains (2014) · cites this paper as Fagnani et al., 2007
In the citing paper
“These data reveal the largest program of neural-regulated AS events defined to date, and that this program is associated with a broader range of functional processes and pathways linked to nervous system biology than previously detected (Boutz et al., 2007; Fagnani et al., 2007; Ule et al., 2005).”
From A Highly Conserved Program of Neuronal Microexons Is Misregulated in Autistic Brains (2014) · cites this paper as Fagnani et al., 2007
Self-check
Percentages, sums and reported differences re-computed from the paper’s own numbers.
The self-check needs the paper’s full text.
Citations
Cites
Controlling the False Discovery Rate: A Practical and Powerful Approach to Multiple Testing
Benjamini, Y., & Hochberg, Y. (1995) · Journal of the Royal Statistical Society Series B: Statistical Methodology · doi:10.1111/j.2517-6161.1995.tb02031.x · Cited by 109,482
Gapped BLAST and PSI-BLAST: a new generation of protein database search programs
Altschul, S. (1997) · Nucleic Acids Research · doi:10.1093/nar/25.17.3389 · Cited by 73,302
Cytoscape: A software Environment for integrated models of biomolecular interaction networks
Shannon, P., Markiel, A., Ozier, O., Baliga, N. S., Wang, J. T., Ramage, D., Amin, N., Schwikowski, B., & Ideker, T. (2003) · Genome Research · doi:10.1101/gr.1239303 · Cited by 51,888
Modern Applied Statistics with S
Venables, W. N., & Ripley, B. D. (2002) · Statisctics and computing/Statistics and computing · doi:10.1007/978-0-387-21706-2 · Cited by 25,941
Bioconductor: open software development for computational biology and bioinformatics
Gentleman, R. C., Carey, V. J., Bates, D. M., Bolstad, B., Dettling, M., Dudoit, S., Ellis, B., Gautier, L., Ge, Y., Gentry, J., et al. (2004) · Genome biology · doi:10.1186/gb-2004-5-10-r80 · Cited by 12,082
Gentleman R: R: A language for data analysis and graphics
Ihaka, R., & Gentleman, R. (1996) · Journal of Computational and Graphical Statistics · doi:10.1080/10618600.1996.10474713 · Cited by 11,747
Database resources of the National Center for Biotechnology Information: update
Wheeler, D. L. (2003) · Nucleic Acids Research · doi:10.1093/nar/gkh073 · Cited by 10,695
The control of the false discovery rate in multiple testing under dependency
Benjamini, Y., & Yekutieli, D. (2001) · The Annals of Statistics · doi:10.1214/aos/1013699998 · Cited by 10,490
Divergence measures based on the Shannon entropy
Lin, J.-H. (1991) · IEEE Transactions on Information Theory · doi:10.1109/18.61115 · Cited by 5,877
Bootstrap Methods and Their Application
Loughin, T. M., Davison, A. C., & HINKLEY, D. V. (1999) · Journal of the American Statistical Association · doi:10.2307/2669707 · Cited by 5,478
Cited by
Sorted by citations
Barash, Y., Calarco, J. A., Gao, W., Pan, Q., Wang, X., Shai, O., Blencowe, B. J., & Frey, B. J. (2010) · Nature · doi:10.1038/nature09000 · Cited by 925
Self-citationAlternative Splicing Regulatory Networks: Functions, Mechanisms, and Evolution
Ule, J., & Blencowe, B. J. (2019) · Molecular Cell · doi:10.1016/j.molcel.2019.09.017 · Cited by 780
Self-citationRNA processing and its regulation: global insights into biological networks
Licatalosi, D. D., & Darnell, R. B. (2009) · Nature Reviews Genetics · doi:10.1038/nrg2673 · Cited by 777
Functional consequences of developmentally regulated alternative splicing
Kalsotra, A., & Cooper, T. A. (2011) · Nature Reviews Genetics · doi:10.1038/nrg3052 · Cited by 729
A single-molecule long-read survey of the human transcriptome
Sharon, D., Tilgner, H., Grubert, F., & Snyder, M. (2013) · Nature Biotechnology · doi:10.1038/nbt.2705 · Cited by 701
A Highly Conserved Program of Neuronal Microexons Is Misregulated in Autistic Brains
Irimia, M., Weatheritt, R. J., Ellis, J. D., Parikshak, N. N., Gonatopoulos-Pournatzis, T., Babor, M., Quesnel-Vallières, M., Tapial, J., Raj, B., O’Hanlon, D., et al. (2014) · Cell · doi:10.1016/j.cell.2014.11.035 · Cited by 693
“These data reveal the largest program of neural-regulated AS events defined to date, and that this program is associatedwith a broader range of functional processes and pathways linked to nervous system biology than previously detected (Boutz et al., 2007; Fagnani et al., 2007; Ule et al., 2005).”
BackgroundResultInfluentialSelf-citationA postnatal switch of CELF and MBNL proteins reprograms alternative splicing in the developing heart
Kalsotra, A., Xiao, X., Ward, A. J., Castle, J. C., Johnson, J. M., Burge, C. B., & Cooper, T. A. (2008) · Proceedings of the National Academy of Sciences · doi:10.1073/pnas.0809045105 · Cited by 508
Raj, B., & Blencowe, B. J. (2015) · Neuron · doi:10.1016/j.neuron.2015.05.004 · Cited by 475
Self-citationTapial, J., Ha, K., Sterne-Weiler, T., Gohr, A., Braunschweig, U., Hermoso, A., Quesnel-Vallières, M., Permanyer, J., Sodaei, R., Márquez, Y., et al. (2017) · Genome Research · doi:10.1101/gr.220962.117 · Cited by 441
Self-citationSingle-cell isoform RNA sequencing characterizes isoforms in thousands of cerebellar cells
Gupta, I., Collier, P. G., Haase, B., Mahfouz, A., Joglekar, A., Floyd, T., Koopmans, F., Barres, B., Smit, A. B., Sloan, S. A., et al. (2018) · Nature Biotechnology · doi:10.1038/nbt.4259 · Cited by 343
Castle, J. C., Zhang, C., Shah, J. K., Kulkarni, A., Kalsotra, A., Cooper, T. A., & Johnson, J. M. (2008) · Nature Genetics · doi:10.1038/ng.264 · Cited by 332
Defining the regulatory network of the tissue-specific splicing factors Fox-1 and Fox-2
Zhang, C., Zhang, Z., Castle, J., Sun, S., Johnson, J., Krainer, A. R., & Zhang, M. Q. (2008) · Genes & Development · doi:10.1101/gad.1703108 · Cited by 300
A spatially resolved brain region- and cell type-specific isoform atlas of the postnatal mouse brain
Joglekar, A., Prjibelski, A., Mahfouz, A., Collier, P., Lin, S., Schlusche, A. K., Marrocco, J., Williams, S. R., Haase, B., Hayes, A., et al. (2021) · Nature Communications · doi:10.1038/s41467-020-20343-5 · Cited by 229
Calarco, J. A., Superina, S., O'Hanlon, D., Gabut, M., Raj, B., Pan, Q., Skalska, U., Clarke, L., Gelinas, D., van der Kooy, D., et al. (2009) · Cell · doi:10.1016/j.cell.2009.06.012 · Cited by 225
Self-citationEvaluating Gene Expression in C57BL/6J and DBA/2J Mouse Striatum Using RNA-Seq and Microarrays
Bottomly, D., Walter, N. A. R., Hunter, J. E., Darakjian, P., Kawane, S., Buck, K. J., Searles, R. P., Mooney, M. A., McWeeney, S. K., & HITZEMANN, R. J. (2011) · PLoS ONE · doi:10.1371/journal.pone.0017820 · Cited by 229
Tilgner, H., Jahanbani, F., Blauwkamp, T., Moshrefi, A., Jaeger, E., Chen, F., Harel, I., Bustamante, C. D., Rasmussen, M., & Snyder, M. P. (2015) · Nature Biotechnology · doi:10.1038/nbt.3242 · Cited by 223
Alternative splicing: current perspectives
Kim, E., Goren, A., & Ast, G. (2007) · BioEssays · doi:10.1002/bies.20692 · Cited by 234
Current-generation high-throughput sequencing: deepening insights into mammalian transcriptomes
Blencowe, B. J., Ahmad, S., & Lee, L. J. (2009) · Genes & Development · doi:10.1101/gad.1788009 · Cited by 168
Self-citationGiudice, J., Xia, Z., Wang, E. T., Scavuzzo, M. A., Ward, A. J., Kalsotra, A., Wang, W., Wehrens, X. H. T., Burge, C. B., Li, W., et al. (2014) · Nature Communications · doi:10.1038/ncomms4603 · Cited by 169
Global analysis of alternative splicing differences between humans and chimpanzeesPreprint
Calarco, J. A., Xing, Y., Cáceres, M., Calarco, J. P., Xiao, X. G., Pan, Q., Lee, C. J., Preuss, T. M., & Blencowe, B. J. (2007) · Genes & Development · doi:10.1101/gad.1606907 · Cited by 166
Self-citationMultiple and Specific mRNA Processing Targets for the Major Human hnRNP Proteins
Venables, J. P., Koh, C., Froehlich, U., Lapointe, E., Couture, S., Inkel, L., Bramard, A., Paquet, É. R., Watier, V., Durand, M., et al. (2008) · Molecular and Cellular Biology · doi:10.1128/mcb.00726-08 · Cited by 158
Genome-wide Analysis of Alternative Pre-mRNA Splicing
Ben-Dov, C., Hartmann, B., Lundgren, J., & Valcárcel, J. (2008) · Journal of Biological Chemistry · doi:10.1074/jbc.r700033200 · Cited by 151
Alternative splicing: global insights
Hallegger, M., Llorian, M., & Smith, C. W. J. (2010) · FEBS Journal · doi:10.1111/j.1742-4658.2009.07521.x · Cited by 147
Splicing factor and exon profiling across human tissues
de la Grange, P., Gratadou, L., Delord, M., Dutertre, M., & Auboeuf, D. (2010) · Nucleic Acids Research · doi:10.1093/nar/gkq008 · Cited by 142
Rbfox3-regulated alternative splicing of Numb promotes neuronal differentiation during development
Kim, K. K., Nam, J., Mukouyama, Y.-S., & Kawamoto, S. (2013) · Journal of Cell Biology · doi:10.1083/jcb.201206146 · Cited by 120
Bayesian prediction of tissue-regulated splicing using RNA sequence and cellular context
Xiong, H. Y., Barash, Y., & Frey, B. J. (2011) · Bioinformatics · doi:10.1093/bioinformatics/btr444 · Cited by 98
Self-citationAznarez, I., Barash, Y., Shai, O., He, D., Zielenski, J., Tsui, L., Parkinson, J., Frey, B. J., Rommens, J. M., & Blencowe, B. J. (2008) · Genome Research · doi:10.1101/gr.073155.107 · Cited by 94
Self-citationLineage-specific splicing of a brain-enriched alternative exon promotes glioblastoma progression
Ferrarese, R., Harsh, G. R., Yadav, A. K., Bug, E., Maticzka, D., Reichardt, W., Dombrowski, S. M., Miller, T. E., Masilamani, A. P., Dai, F., et al. (2014) · Journal of Clinical Investigation · doi:10.1172/jci68836 · Cited by 94
Intragenic epigenetic changes modulate NCAM alternative splicing in neuronal differentiation
Schor, I. E., Fiszbein, A., Petrillo, E., & Kornblihtt, A. R. (2013) · The EMBO Journal · doi:10.1038/emboj.2013.167 · Cited by 90
The splicing landscape is globally reprogrammed during male meiosis
Schmid, R., Grellscheid, S. N., Ehrmann, I. E., Dalgliesh, C., Danilenko, M., Paronetto, M. P., Pedrotti, S., Grellscheid, D., Dixon, R. J., Sette, C., et al. (2013) · Nucleic Acids Research · doi:10.1093/nar/gkt811 · Cited by 94
Global analysis of mRNA splicing
Moore, M. J., & Silver, P. A. (2007) · RNA · doi:10.1261/rna.868008 · Cited by 79
Calarco, J. A., Zhen, M., & Blencowe, B. J. (2011) · RNA · doi:10.1261/rna.2603911 · Cited by 72
Self-citationMicrofluidic isoform sequencing shows widespread splicing coordination in the human transcriptome
Tilgner, H., Jahanbani, F., Gupta, I., Collier, P., Wei, E., Rasmussen, M., & Snyder, M. (2018) · Genome Research · doi:10.1101/gr.230516.117 · Cited by 71
Applications of deep learning in understanding gene regulation
Li, Z., Gao, E., Zhou, J., Han, W., Xu, X., & Gao, X. (2023) · Cell Reports Methods · doi:10.1016/j.crmeth.2022.100384 · Cited by 73
Rhyne, J., Mantaring, M., GARDNER, D. F., & Miller, M. J. (2009) · BMC Medical Genetics · doi:10.1186/1471-2350-10-1 · Cited by 69
Regulation of mRNA splicing by MeCP2 via epigenetic modifications in the brain
Cheng, T., Chen, J., Wan, H., Tang, B., Tian, W., Liao, L., & Qiu, Z. (2017) · Scientific Reports · doi:10.1038/srep42790 · Cited by 64
Quantitative regulation of alternative splicing in evolution and development
Irimia, M., Rukov, J. L., Roy, S. W., Vinther, J., & García‐Fernàndez, J. (2009) · BioEssays · doi:10.1002/bies.080092 · Cited by 65
Alternative pre-mRNA splicing switches modulate gene expression in late erythropoiesis
Yamamoto, M. L., Clark, T. A., Gee, S. L., Kang, J.-A., Schweitzer, A. C., Wickrema, A., & Conboy, J. G. (2009) · Blood · doi:10.1182/blood-2008-05-160325 · Cited by 59
MECHANISMS IN ENDOCRINOLOGY: Alternative splicing: the new frontier in diabetes research
Juan‐Mateu, J., Villate, O., & Eizirik, D. L. (2016) · European Journal of Endocrinology · doi:10.1530/eje-15-0916 · Cited by 59
Getting the Entire Message: Progress in Isoform Sequencing
Hardwick, S. A., Joglekar, A., Flicek, P., Frankish, A., & Tilgner, H. (2019) · Frontiers in Genetics · doi:10.3389/fgene.2019.00709 · Cited by 59
Variants Affecting Exon Skipping Contribute to Complex Traits
Lee, Y., Gamazon, E. R., Rebman, E., Lee, Y., Lee, S., Dolan, M. E., Cox, N. J., & Lussier, Y. A. (2012) · PLoS Genetics · doi:10.1371/journal.pgen.1002998 · Cited by 56
Triple-Stage Mass Spectrometry Unravels the Heterogeneity of an Endogenous Protein Complex
Ben-Nissan, G., Belov, M. E., Morgenstern, D., Levin, Y., Dym, O., Arkind, G., Lipson, C., Makarov, A. A., & Sharon, M. (2017) · Analytical Chemistry · doi:10.1021/acs.analchem.7b00518 · Cited by 54
RBFOX2 alters splicing outcome in distinct binding modes with multiple protein partners
Zhou, D., Couture, S., Scott, M. S., & Elela, S. A. (2021) · Nucleic Acids Research · doi:10.1093/nar/gkab595 · Cited by 54
Neuronal activity-regulated alternative mRNA splicing
Hermey, G., Blüthgen, N., & Kuhl, D. (2017) · The International Journal of Biochemistry & Cell Biology · doi:10.1016/j.biocel.2017.06.002 · Cited by 51
Parallel evolution of a splicing program controlling neuronal excitability in flies and mammals
Torres-Méndez, A., Pop, S., Bonnal, S., Almudí, I., Avola, A., Roberts, R. J. V., Paolantoni, C., Alcaina‐Caro, A., Anduaga, A. M., Haussmann, I. U., et al. (2022) · Science Advances · doi:10.1126/sciadv.abk0445 · Cited by 51
Zalachoras, I., Verhoeve, S. L., Toonen, L. J. A., van Weert, L. T. C. M., van Vlodrop, A. M., Mol, I., Meelis, W., de Kloet, E. R., & Meijer, O. C. (2016) · Molecular Psychiatry · doi:10.1038/mp.2016.16 · Cited by 40
TMEM16A alternative splicing coordination in breast cancer
Ubby, I., Bussani, E., Colonna, A., Stacul, G., Locatelli, M., Scudieri, P., Galietta, L. J. V., & Pagani, F. (2013) · Molecular Cancer · doi:10.1186/1476-4598-12-75 · Cited by 39
Irimia, M., Denuc, A., Ferran, J. L., Pernaute, B., Puelles, L., Roy, S. W., Garcia-Fernàndez, J., & Marfany, G. (2012) · RNA Biology · doi:10.4161/rna.9.1.18387 · Cited by 38
Genome-wide analysis of alternative splicing during human heart development
Wang, H., Chen, Y., Li, X., Chen, G., Zhong, L., Chen, G., Liao, Y., Liao, W., & Bin, J. (2016) · Scientific Reports · doi:10.1038/srep35520 · Cited by 36
Hoen, P. A. C. ’., Hirsch, M., de Meijer, E. J., de Menezes, R. X., van Ommen, G. J., & den Dunnen, J. T. (2010) · Nucleic Acids Research · doi:10.1093/nar/gkq790 · Cited by 36
Downstream intronic splicing enhancers
Venables, J. P. (2007) · FEBS Letters · doi:10.1016/j.febslet.2007.08.012 · Cited by 33
Quantitative analysis of 5HT2C receptor RNA editing patterns in psychiatric disorders
O’Neil, R. T., & Emeson, R. B. (2011) · Neurobiology of Disease · doi:10.1016/j.nbd.2011.08.026 · Cited by 33
Repeat-associated RNA structure and aberrant splicing
Hale, M. A., Johnson, N. E., & Berglund, J. A. (2019) · Biochimica et Biophysica Acta (BBA) - Gene Regulatory Mechanisms · doi:10.1016/j.bbagrm.2019.07.006 · Cited by 35
Technologies for the Global Discovery and Analysis of Alternative Splicing
Calarco, J. A., Saltzman, A. L., Ip, J. Y. Y., & Blencowe, B. J. (2007) · Advances in experimental medicine and biology · doi:10.1007/978-0-387-77374-2_5 · Cited by 33
Self-citationAssessing long-distance RNA sequence connectivity via RNA-templated DNA–DNA ligation
Roy, C. K., Olson, S., Graveley, B. R., Zamore, P. D., & Moore, M. J. (2015) · eLife · doi:10.7554/elife.03700 · Cited by 32
Exposing the subunit diversity within protein complexes: A mass spectrometry approach
Rozen, S., Tieri, A., Ridner, G., Stark, A.-K., Schmaler, T., Ben‐Nissan, G., Dubiel, W., & Sharon, M. (2013) · Methods · doi:10.1016/j.ymeth.2012.12.013 · Cited by 31
Puisac, B., Ramos, M., Arnedo, M., Menao, S., Gil‐Rodríguez, M. C., Teresa‐Rodrigo, M. E., Pié, Á., Karam, J. C. D., Wesselink, J., Gimenez-Lopez, I., et al. (2011) · Molecular Biology Reports · doi:10.1007/s11033-011-1270-8 · Cited by 31
Koterniak, B., Pilaka, P. P., Gracida, X., Schneider, L.-M., Pritišanac, I., Zhang, Y., & Calarco, J. A. (2020) · Genome Research · doi:10.1101/gr.267328.120 · Cited by 31
LSCplus: a fast solution for improving long read accuracy by short read alignment
Hu, R., Sun, G., & Sun, X. (2016) · BMC Bioinformatics · doi:10.1186/s12859-016-1316-y · Cited by 28
The aberrant splicing of BAF45d links splicing regulation and transcription in glioblastoma
Aldave, G., González-Huarriz, M., Rubio, Á., Romero, J. P., Ravi, D. G., Miñana, B., Cuadrado‐Tejedor, M., García‐Osta, A., Verhaak, R. G. W., Xipell, E., et al. (2018) · Neuro-Oncology · doi:10.1093/neuonc/noy007 · Cited by 27
Parra, M., Gee, S. L., Mohandas, N., & Conboy, J. G. (2010) · Journal of Biological Chemistry · doi:10.1074/jbc.m110.158154 · Cited by 25
Antisense-Mediated RNA Targeting: Versatile and Expedient Genetic Manipulation in the Brain
Zalachoras, I., Evers, M. M., van Roon-Mom, W. M. C., Aartsma-Rus, A. M., & Meijer, O. C. (2011) · Frontiers in Molecular Neuroscience · doi:10.3389/fnmol.2011.00010 · Cited by 24
Model-based detection of alternative splicing signals
Barash, Y., Blencowe, B. J., & Frey, B. J. (2010) · Bioinformatics · doi:10.1093/bioinformatics/btq200 · Cited by 22
Self-citationFrom words to complete phrases: insight into single-cell isoforms using short and long reads
Joglekar, A., Foord, C., Jarroux, J., Pollard, S., & Tilgner, H. (2023) · Transcription · doi:10.1080/21541264.2023.2213514 · Cited by 20
Systems analysis of alternative splicing and its regulation
Xiao, X. G., & Lee, J. (2010) · WIREs Systems Biology and Medicine · doi:10.1002/wsbm.84 · Cited by 22
Role of thePreprint
Artokca, I. (2015) · SSRN Electronic Journal · Cited by 20
The 3D-Evo Space: Evolution of Gene Expression and Alternative Splicing Regulation
Mantica, F., & Irimia, M. (2022) · Annual Review of Genetics · doi:10.1146/annurev-genet-071719-020653 · Cited by 20
Jin, Y., Zhang, B., Lu, J., Song, Y., Wang, W., Zhang, W., Shao, F., Gong, M., Wang, M., Liang, X., et al. (2021) · PLoS Biology · doi:10.1371/journal.pbio.3001297 · Cited by 17
Self-citationAllen, S. E., Toro, C. P., Andrade, A., López-Soto, E. J., Denome, S., & Lipscombe, D. (2017) · eneuro · doi:10.1523/eneuro.0332-16.2017 · Cited by 17
Cheng, S., Zhu, B., Luo, F., Lin, X., Sun, C., You, Y., Yi, C., Xu, B., Wang, J., Lü, Y., et al. (2022) · PLoS neglected tropical diseases · doi:10.1371/journal.pntd.0009889 · Cited by 16
Blencowe, B. J. (2012) · Biochemistry and Cell Biology · doi:10.1139/o2012-019 · Cited by 15
Self-citationSchmieg, N., Thomas, C., Yabe, A., Lynch, D. S., Iglesias, T., Chakravarty, P., & Schiavo, G. (2015) · PLoS ONE · doi:10.1371/journal.pone.0129944 · Cited by 15
Zalachoras, I., Grootaers, G., van Weert, L. T. C. M., Aubert, Y., de Kreij, S. R., Datson, N. A., van Roon‐Mom, W., Aartsma-Rus, A. M., & Meijer, O. C. (2013) · BMC Neuroscience · doi:10.1186/1471-2202-14-5 · Cited by 14
Regulation of Tissue-Specific Alternative Splicing: C. elegans as a Model System
Gracida, X., Norris, A. D., & Calarco, J. A. (2016) · Advances in experimental medicine and biology · doi:10.1007/978-3-319-29073-7_10 · Cited by 15
Elucidating the coordination of RNA processing using short-read and long-read RNA-sequencing methods
Alfonso-Gonzalez, C., & Hilgers, V. (2025) · Nature Reviews Molecular Cell Biology · doi:10.1038/s41580-025-00895-4 · Cited by 14
Hu, W., Foord, C., Hsu, J., Fan, L., Corley, M. J., Lanjewar, S. N., Xu, S., Belchikov, N., He, Y., Pang, A. P. S., et al. (2025) · Nature Biotechnology · doi:10.1038/s41587-025-02734-5 · Cited by 14
Coexpression and Cosplicing Network Approaches for the Study of Mammalian Brain Transcriptomes
Iancu, O. D., Colville, A. M., Darakjian, P., & HITZEMANN, R. J. (2014) · International review of neurobiology · doi:10.1016/b978-0-12-801105-8.00004-7 · Cited by 13
Unique transcriptomes of sensory and non-sensory neurons: insights from Splicing Regulatory States
Ciampi, L., Serrano, L. G., & Irimia, M. (2024) · Molecular Systems Biology · doi:10.1038/s44320-024-00020-1 · Cited by 10
Nery, T. G. M., da Silva, E. M. G., Tavares, R., & Passetti, F. (2018) · Journal of Molecular Neuroscience · doi:10.1007/s12031-018-1220-1 · Cited by 10
Deep learning for regulatory genomics: a survey of models, challenges, and applications
Ismail, F. N., Sengupta, A., & Amarasoma, S. (2025) · Bioinformatics Advances · doi:10.1093/bioadv/vbaf271 · Cited by 8
Peng, T., Xue, C., Bi, J., Li, T., Wang, X., Zhang, X., & Li, Y. (2008) · BMC Genomics · doi:10.1186/1471-2164-9-191 · Cited by 7
How do RNA sequence, DNA sequence, and chromatin properties regulate splicing?
Ringrose, L. (2010) · F1000 Biology Reports · doi:10.3410/b2-74 · Cited by 7
Schor, I. E., & Kornblihtt, A. R. (2009) · Communicative & Integrative Biology · doi:10.4161/cib.2.4.8550 · Cited by 7
Statistical and Computational Studies on Alternative Splicing
Chen, L. (2011) · Springer eBooks · doi:10.1007/978-3-642-16345-6_2 · Cited by 6
Tolvanen, M. E. E., Ojala, P. J., Törönen, P., Anderson, H., Partanen, J., & Turpeinen, H. (2008) · Journal of Biomedical Informatics · doi:10.1016/j.jbi.2008.11.002 · Cited by 4
Barash, Y., & Vaquero-Garcia, J. (2014) · Advances in experimental medicine and biology · doi:10.1007/978-1-4939-1221-6_13 · Cited by 3
Self-citationAlternative Splice Site Selection
Coelho, M. B., & Smith, C. W. J. (2012) · Wiley eBooks · doi:10.1002/9783527636778.ch8 · Cited by 2
Machine learning in computational biology: models of alternative splicing
Ofer Shai, A. (2009) · TSpace (University of Toronto) · Cited by 2
DNA Chip Analysis in Genome Discovery
Nazar, R. N., & Robb, J. (2011) · Wiley eBooks · doi:10.1002/9781119977438.ch2 · Cited by 2
Analysis of Cis-Regulatory Motifs in Cassette Exons by Incorporating Exon Skipping Rates
Zhao, S., Kim, J., & Heber, S. (2009) · Lecture notes in computer science · doi:10.1007/978-3-642-01551-9_27 · Cited by 2
Integrated detection and quantification of aberrant transcripts with novel splicing eventsPreprint
Agrawal, I., Lim, Y. S., Sanford, E., Ho, W. Y., Ling, S., & Tucker‐Kellogg, G. (2025) · bioRxiv (Cold Spring Harbor Laboratory) · doi:10.1101/2025.02.02.635191 · Cited by 2
Imai, A., Izumi, H., Ito, N., Ogiso, H., Kitajima, Y., Kawase, S., Sendo, M., Azechi, K., Tabata, T., Koshidaka, Y., et al. (2026) · Proceedings of the National Academy of Sciences · doi:10.1073/pnas.2515310123 · Cited by 1
Shalev, I., Somekh, J., & Eran, A. (2021) · Journal of Medical Genetics · doi:10.1136/jmedgenet-2021-108193 · Cited by 1
Nitric oxide drives proteomic diversity through alternative splicing
Schindler, J. C., Seth, P., Hausladen, A., Chan, E. R., Yang, J., Qin, J., Qian, Z., Seth, D., Lundberg, K. C., Luna, J. M., et al. (2026) · Molecular Cell · doi:10.1016/j.molcel.2026.04.024 · Cited by 1
Pulmonary remodeling in asthma
Lieberman, P. (2010) · F1000 Medicine Reports · doi:10.3410/m2-74 · Cited by 1
Glauser, D. A. (2014) · BMC Genomics · doi:10.1186/1471-2164-15-364 · Cited by 1
Brosseau, J., & Elela, S. A. (2013) · InTech eBooks · doi:10.5772/53976 · Cited by 1
Linear Programming and Integer Linear Programming in Bioinformatics
Andreotti, S. (2015) · Universitätsbibliothek der FU Berlin Hochschulschriftenstelle u. Dokumentenserver · doi:10.17169/refubium-17199 · Cited by 1
An in silico assessment of alternatively spliced isoforms in the mouse brain using RNA-Seq
Bottomly, D. (2009) · doi:10.6083/m4wd3xjh · Cited by 1
Sidorov, S., Pal, K., Lenhard, B., & Luscombe, N. M. (2024) · bioRxiv (Cold Spring Harbor Laboratory) · doi:10.1101/2024.11.28.625692 · Cited by 1
Metadata
- Authors
- Fagnani, M., Barash, Y., Ip, J. Y., Misquitta, C., Pan, Q., Saltzman, A. L., Shai, O., Lee, L., Rozenhek, A., Mohammad, N., Willaime-Morawek, S., Babak, T., Zhang, W., Hughes, T. R., van der Kooy, D., Frey, B. J., & Blencowe, B. J.
- Affiliations
- University of Toronto (CA)
- Hebrew University of Jerusalem (IL)
- Corresponding author
- Frey, Brendan J
- Blencowe, Benjamin J
- ORCID
- Venue
- Genome Biology
- Published
- 2007-06-12
- Volume
- 8
- Issue
- 6
- Pages
- R108-R108
- ISSN
- 1465-6906 (ISSN-L)
- 1474-760X
- PMC
- PMC2394768
- OpenAlex
- W2170074416
- Cited by
- 120
- References
- 347
- Citations by year
- 2026: 3 · 2025: 6 · 2024: 3 · 2023: 2 · 2022: 3 · 2021: 4 · 2020: 2 · 2019: 3 · 2018: 3 · 2017: 6 · 2016: 5 · 2015: 7 · 2014: 10 · 2013: 11 · 2012: 6
- FWCI
- 4.90
- Type
- journal article
- Language
- en
- Open access
- gold
- doi.org
- Locations
- Genome biology (publishedVersion, cc-by)
- PubMed Central (publishedVersion, cc-by)
- PubMed (publishedVersion)
- ePrints Soton (University of Southampton) (acceptedVersion)
- TSpace (University of Toronto) (submittedVersion)
- Funders
- Genome Canada
- Ontario Genomics
- Ontario Genomics Institute
- Canadian Institutes of Health Research
- Natural Sciences and Engineering Research Council of Canada
- National Cancer Institute
- Topics
- Life Sciences › Biochemistry, Genetics and Molecular Biology › Molecular Biology › RNA Research and Splicing
- Life Sciences › Biochemistry, Genetics and Molecular Biology › Molecular Biology › RNA regulation and disease
- Life Sciences › Biochemistry, Genetics and Molecular Biology › Cancer Research › Cancer-related molecular mechanisms research
- Keywords
- alternative splicing, central nervous system, alternative exons, mouse genes
- MeSH terms
- Animals, Central Nervous System, Exons, Gene Expression Regulation, Introns, Organ Specificity, Regulatory Sequences, Nucleic Acid, Alternative Splicing, Oligonucleotide Array Sequence Analysis, Gene Expression Profiling, Mice
About these checks
Registry, retraction, Cites and statistics results are computed, not judged, with one exception: a printed reference that no index lists is read once by a model before it counts as a citation error. Claims are extracted by a model and kept only when their quote appears verbatim in the text; each cited source is then checked, with a model’s help, for whether it says what the claim relies on. Those verdicts can be wrong — read the claim’s quote and the cited source before relying on one.
Statistics and arithmetic are recomputed, not judged.
Confidence bands are shown only for fields calibrated on our annotated test set. None is calibrated yet, so no band is shown.
What counts as a claim ›How we measure confidence ›How we check this ›
Are you an author, or do you see a problem with this page? Request a review
