

The DOI matches its Crossref record; 7 of the 7 references it cites were found in a registry or an index.
Expression of mitochondrial protein genes encoded by nuclear and mitochondrial genomes correlate with energy metabolism in dairy cattle
Open accessPublished version of a preprint
Abstract
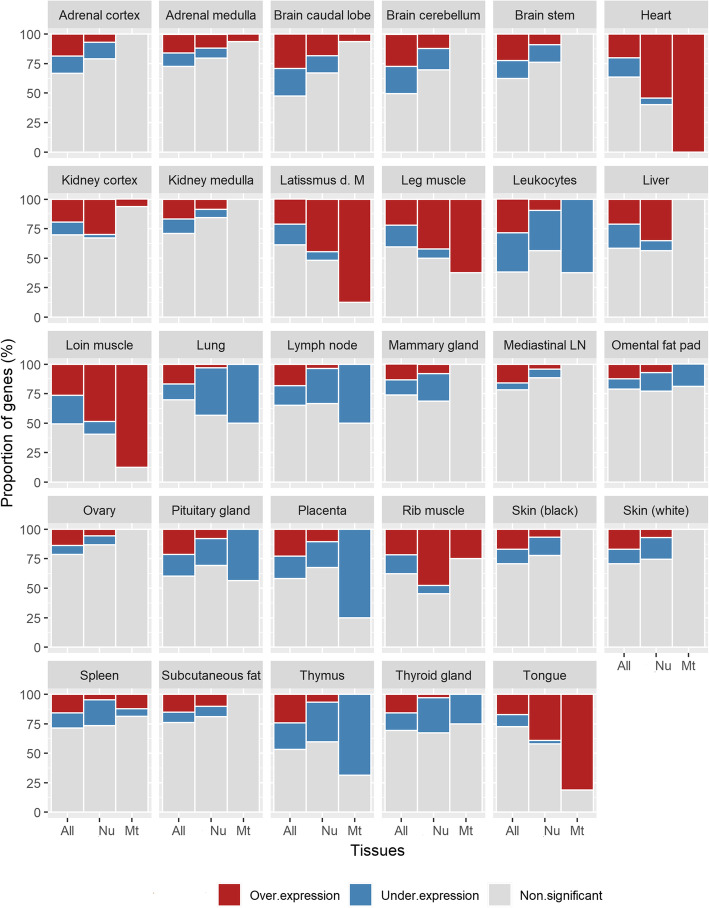
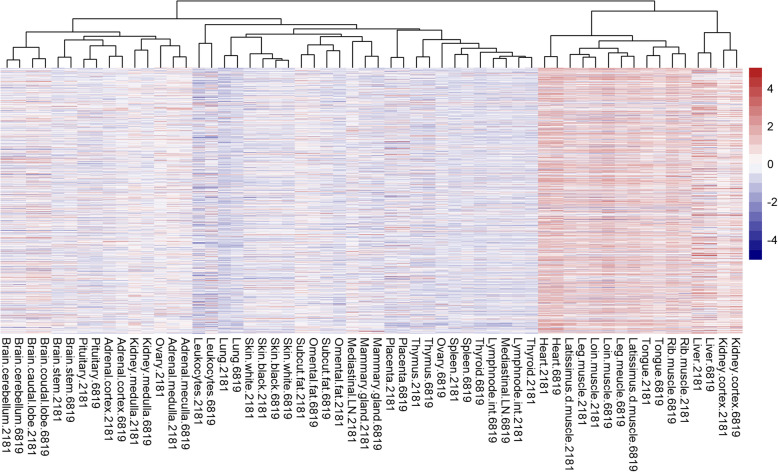
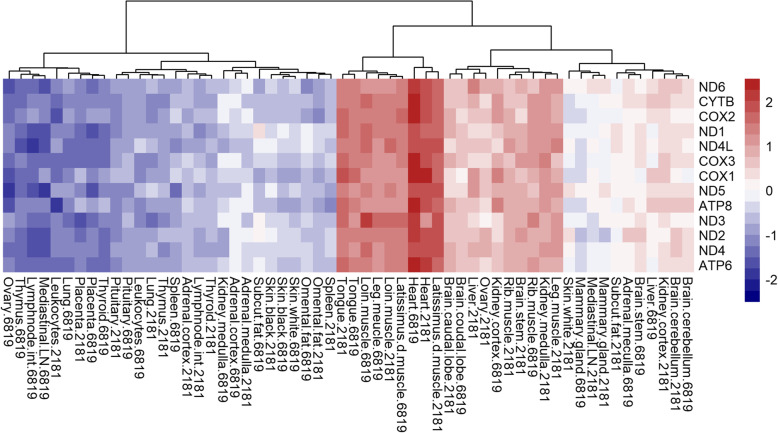
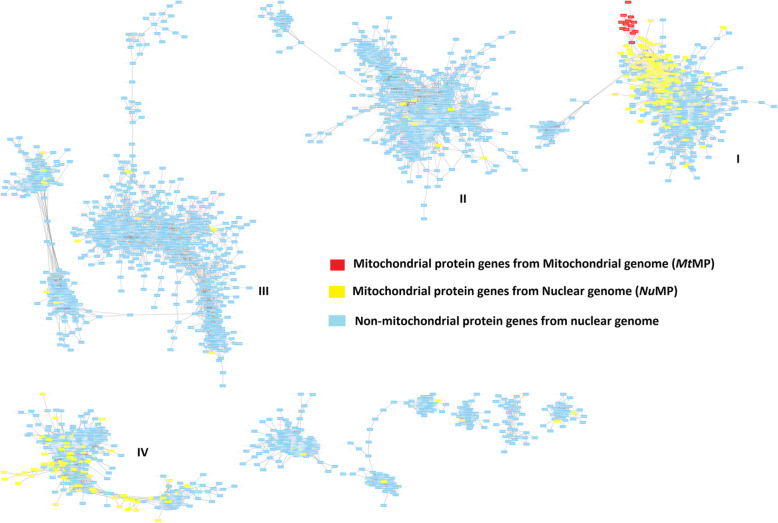
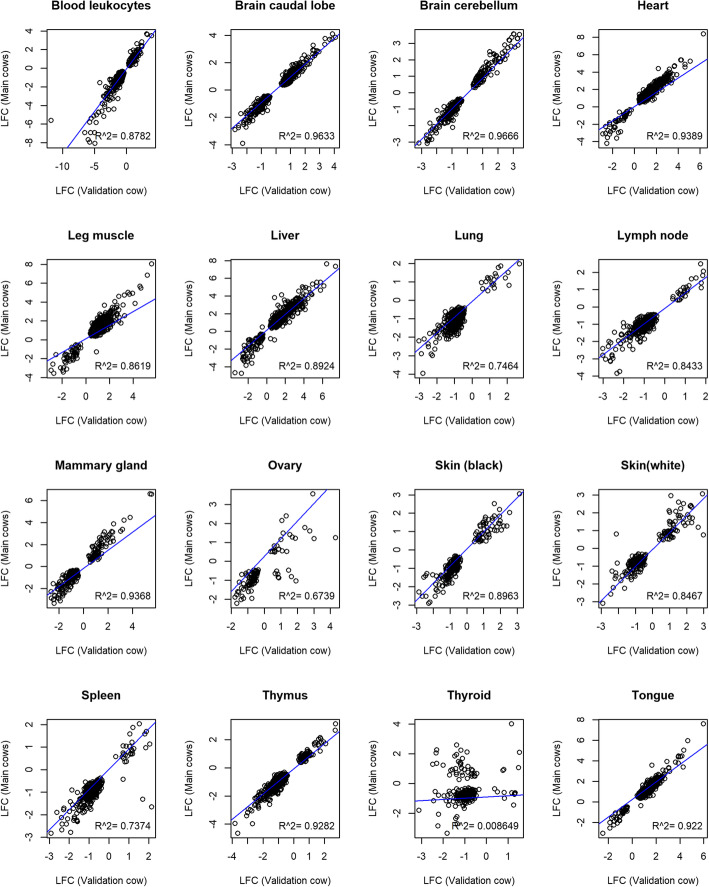
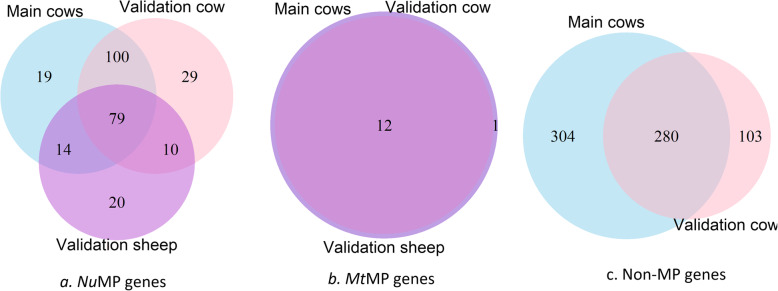
Background: Mutations in the mitochondrial genome have been implicated in mitochondrial disease, often characterized by impaired cellular energy metabolism. Cellular energy metabolism in mitochondria involves mitochondrial proteins (MP) from both the nuclear ( Nu MP) and mitochondrial ( Mt MP) genomes. The expression of MP genes in tissues may be tissue specific to meet varying specific energy demands across the tissues. Currently, the characteristics of MP gene expression in tissues of dairy cattle are not well understood. In this study, we profile the expression of MP genes in 29 adult and six foetal tissues in dairy cattle using RNA sequencing and gene expression analyses: particularly differential gene expression and co-expression network analyses. Results: MP genes were differentially expressed (DE; over-expressed or under-expressed) across tissues in cattle. All 29 tissues showed DE Nu MP genes in varying proportions of over-expression and under-expression. On the other hand, DE of Mt MP genes was observed in < 50% of tissues and notably Mt MP genes within a tissue was either all over-expressed or all under-expressed. A high proportion of Nu MP (up to 60%) and Mt MP (up to 100%) genes were over-expressed in tissues with expected high metabolic demand; heart, skeletal muscles and tongue, and under-expressed (up to 45% of Nu MP, 77% of Mt MP genes) in tissues with expected low metabolic rates; leukocytes, thymus, and lymph nodes. These tissues also invariably had the expression of all Mt MP genes in the direction of dominant Nu MP genes expression. The Nu MP and Mt MP genes were highly co-expressed across tissues and co-expression of genes in a cluster were non-random and functionally enriched for energy generation pathway. The differential gene expression and co-expression patterns were validated in independent cow and sheep datasets. Conclusions: The results of this study support the concept that there are biological interaction of MP genes from the mitochondrial and nuclear genomes given their over-expression in tissues with high energy demand and co-expression in tissues. This highlights the importance of considering MP genes from both genomes in future studies related to mitochondrial functions and traits related to energy metabolism.
Overview
The claims and statistics of this paper haven’t been checked yet.
Run the check — free, no account needed. It reads the open-access text and checks the sources it cites.
Integrity signals
Registry
Cites
Statistics
Figures
Verification
Claims the paper makes
The claims and statistics of this paper haven’t been checked yet.
Run the check — free, no account needed. It reads the open-access text and checks the sources it cites.
Self-check
Percentages, sums and reported differences re-computed from the paper’s own numbers.
The self-check needs the paper’s full text.
Citations
Cites
Global quantification of mammalian gene expression control
Schwanhäusser, B., Busse, D., Li, N., Dittmar, G., Schuchhardt, J., Wolf, J., Chen, W., & Selbach, M. (2011) · Nature · doi:10.1038/nature10098 · Cited by 6,566
Fagerberg, L., Hallström, B. M., Oksvold, P., Kampf, C., Djureinovic, D., Odeberg, J., Habuka, M., Tahmasebpoor, S., Danielsson, A., Edlund, K., et al. (2014) · Molecular & Cellular Proteomics · doi:10.1074/mcp.m113.035600 · Cited by 3,665
Thyroid Hormone Regulation of Metabolism
Mullur, R., Liu, Y.-Y., & Brent, G. A. (2014) · Physiological Reviews · doi:10.1152/physrev.00030.2013 · Cited by 2,421
The mitochondrial basis of aging
Sun, N., Youle, R. J., & Finkel, T. (2016) · Molecular Cell · doi:10.1016/j.molcel.2016.01.028 · Cited by 1,441
Gene co-expression analysis for functional classification and gene–disease predictions
van Dam, S., Võsa, U., van der Graaf, A., Franke, L., & de Magalhães, J. P. (2017) · Briefings in Bioinformatics · doi:10.1093/bib/bbw139 · Cited by 995
Wang, Z., Ying, Z., Bosy-Westphal, A., Zhang, J., Schautz, B., Later, W., Heymsfield, S. B., & Müller, M. J. (2010) · The American Journal of Clinical Nutrition · doi:10.3945/ajcn.2010.29885 · Cited by 546
Organ-tissue mass measurement allows modeling of REE and metabolically active tissue mass
Gallagher, D., Belmonte, D., Deurenberg, P., Wang, Z., Krasnow, N., Pi-Sunyer, F. X., & Heymsfield, S. B. (1998) · American Journal of Physiology-Endocrinology and Metabolism · doi:10.1152/ajpendo.1998.275.2.e249 · Cited by 470
Research works printed but not linked: 72
- Taylor RW, Turnbull DM. Mitochondrial DNA mutations in human disease. Nat Rev Genet. 2005;6(5):389–402. · DOI
- Gorman GS, Chinnery PF, DiMauro S, Hirano M, Koga Y, McFarland R, et al. Mitochondrial diseases. Nat Rev Dis Prim. 2016;2:16080. · DOI
- Wallace DC. Mitochondrial diseases in man and mouse. Science. 1999;283(5407):1482–8. · DOI · Paper page
- Elia M, Livesey G. Energy expenditure and fuel selection in biological systems: the theory and practice of calculations based on indirect calorimetry and tracer methods. World Rev Nutr Diet. 1992;70:68–131. · DOI
- Wang C, Youle RJ. The role of mitochondria in apoptosis*. Annu Rev Genet. 2009;43:95–118. · DOI · Paper page
- Contreras L, Drago I, Zampese E, Pozzan T. Mitochondria: the calcium connection. Biochim Biophys Acta. 2010;1797(6):607–18. · DOI
- Fox TD. Mitochondrial protein synthesis, import, and assembly. Genetics. 2012;192(4):1203–34. · DOI
- Lopez MF, Kristal BS, Chernokalskaya E, Lazarev A, Shestopalov AI, Bogdanova A, et al. High-throughput profiling of the mitochondrial proteome using affinity fractionation and automation. Electrophoresis. 2000;21(16):3427–40. · DOI
- Calvo SE, Clauser KR, Mootha VK. MitoCarta2.0: an updated inventory of mammalian mitochondrial proteins. Nucleic Acids Res. 2016;44(Database issue):D1251–D7. · DOI · Paper page
- Dudek J, Rehling P, van der Laan M. Mitochondrial protein import: common principles and physiological networks. Biochim Biophys Acta. 2013;1833(2):274–85. · DOI
- Chacinska A, Koehler CM, Milenkovic D, Lithgow T, Pfanner N. Importing mitochondrial proteins: machineries and mechanisms. Cell. 2009;138(4):628–44. · DOI
- Margulis L. Origin of eukaryotic cells : evidence and research implications for a theory of the origin and evolution of microbial, plant, and animal cells on the Precambrian earth. New Haven: Yale University Press; 1970.
- Giles RE, Blanc H, Cann HM, Wallace DC. Maternal inheritance of human mitochondrial DNA. Proc Natl Acad Sci. 1980;77(11):6715–5719. · DOI · Paper page
- Hutchison CA, Newbold JE, Potter SS, Edgell MH. Maternal inheritance of mammalian mitochondrial DNA. Nature. 1974;251(5475):536–8. · DOI
- Anderson S, de Bruijn MHL, Coulson AR, Eperon IC, Sanger F, Young IG. Complete sequence of bovine mitochondrial DNA conserved features of the mammalian mitochondrial genome. J Mol Biol. 1982;156(4):683–717. · DOI · Paper page
- Sutarno CJM, Greeff J, Lymbery AJ. Mitochondrial DNA polymorphisms and fertility in beef cattle. Theriogenology. 2002;57(6):1603–10. · DOI
- Holyoake AJ, McHugh P, Wu M, O'Carroll S, Benny P, Sin IL, et al. High incidence of single nucleotide substitutions in the mitochondrial genome is associated with poor semen parameters in men. Int J Androl. 2001;24(3):175–82. · DOI
- Chan CC, Liu VW, Lau EY, Yeung WS, Ng EH, Ho PC. Mitochondrial DNA content and 4977 bp deletion in unfertilized oocytes. Mol Hum Reprod. 2005;11(12):843–6. · DOI
- Schutz MM, Freeman AE, Lindberg GL, Koehler CM, Beitz DC. The effect of mitochondrial DNA on milk production and health of dairy cattle. Livest Prod Sci. 1994;37(3):283–95. · DOI
- Wang J, Shi Y, Elzo MA, Dang S, Jia X, Lai S. Genetic diversity of ATP8 and ATP6 genes is associated with high-altitude adaptation in yak. Mitochondrial DNA Part A. 2018;29(3):385–93. · DOI
- Shi Y, Hu Y, Wang J, Elzo MA, Yang X, Lai S. Genetic diversities of MT-ND1 and MT-ND2 genes are associated with high-altitude adaptation in yak. Mitochondrial DNA Part A. 2018;29(3):485–94. · DOI
- Robin ED, Wong R. Mitochondrial DNA molecules and virtual number of mitochondria per cell in mammalian cells. J Cell Physiol. 1988;136(3):507–13. · DOI
- Goffart S, Wiesner RJ. Regulation and co-ordination of nuclear gene expression during mitochondrial biogenesis. Exp Physiol. 2003;88(1):33–40. · DOI
- Clay Montier LL, Deng JJ, Bai Y. Number matters: control of mammalian mitochondrial DNA copy number. J Genet Genomics. 2009;36(3):125–31. · DOI
- San Segundo-Val I, Sanz-Lozano CS. Introduction to the gene expression analysis. In: Isidoro García M, editor. Molecular genetics of asthma. New York, NY: Springer New York; 2016. p. 29–43. · DOI
- Chamberlain AJ, Vander Jagt CJ, Hayes BJ, Khansefid M, Marett LC, Millen CA, et al. Extensive variation between tissues in allele specific expression in an outbred mammal. BMC Genomics. 2015;16:993. · DOI
- Eisen MB, Spellman PT, Brown PO, Botstein D. Cluster analysis and display of genome-wide expression patterns. Proc Natl Acad Sci U S A. 1998;95(25):14863–8. · DOI · Paper page
- Michalak P. Coexpression, coregulation, and cofunctionality of neighboring genes in eukaryotic genomes. Genomics. 2008;91(3):243–8. · DOI
- Hurst LD, Pal C, Lercher MJ. The evolutionary dynamics of eukaryotic gene order. Nat Rev Genet. 2004;5(4):299–310. · DOI
- Nora EP, Lajoie BR, Schulz EG, Giorgetti L, Okamoto I, Servant N, et al. Spatial partitioning of the regulatory landscape of the X-inactivation Centre. Nature. 2012;485(7398):381–5. · DOI · Paper page
- Harhay GP, Smith TPL, Alexander LJ, Haudenschild CD, Keele JW, Matukumalli LK, et al. An atlas of bovine gene expression reveals novel distinctive tissue characteristics and evidence for improving genome annotation. Genome Biol. 2010;11(10):R102 R. · DOI
- Wang ZM, O'Connor TP, Heshka S, Heymsfield SB. The reconstruction of Kleiber's law at the organ-tissue level. J Nutr. 2001;131:2967–70. · DOI
- Berg JM, Tymoczko JL, Stryer L. Biochemistry. In: Tymoczko JL, Stryer L, editors. National Center for biotechnology I. 5th ed. New York: Basingstoke: W. H. Freeman; 2002.
- Wang Z, Zhang J, Ying Z, Heymsfield SB. Organ-tissue level model of resting energy expenditure across mammals: new insights into Kleiber's law. ISRN Zoology. 2012;2012:9. · DOI
- Clark EL, Bush SJ, McCulloch MEB, Farquhar IL, Young R, Lefevre L, et al. A high resolution atlas of gene expression in the domestic sheep (Ovis aries). PLoS Genet. 2017;13(9):e1006997. · DOI
- Stanley WC, Chandler MP. Energy metabolism in the Normal and failing heart: potential for therapeutic interventions. Heart Fail Rev. 2002;7(2):115–30. · DOI
- Herbers E, Kekäläinen NJ, Hangas A, Pohjoismäki JL, Goffart S. Tissue specific differences in mitochondrial DNA maintenance and expression. Mitochondrion. 2019;44:85–92. · DOI · Paper page
- Glaister M. Multiple sprint work: physiological responses, mechanisms of fatigue and the influence of aerobic fitness. Sports Med (Auckland, NZ). 2005;35(9):757–77. · DOI
- Spriet LL. Anaerobic metabolism in human skeletal muscle during short-term, intense activity. Can J Physiol Pharmacol. 1992;70(1):157–65. · DOI
- Hargreaves M. Skeletal muscle metabolism during exercise in humans. Clin Exp Pharmacol Physiol. 2000;27(3):225–8. · DOI
- Forbes JM. Mitochondria–power players in kidney function? Trends Endocrinol Metab. 2016;27(7):441–2. · DOI
- Bhargava P, Schnellmann RG. Mitochondrial energetics in the kidney. Nat Rev Nephrol. 2017;13:629. · DOI
- Kramer PA, Ravi S, Chacko B, Johnson MS, Darley-Usmar VM. A review of the mitochondrial and glycolytic metabolism in human platelets and leukocytes: implications for their use as bioenergetic biomarkers. Redox Biol. 2014;2:206–10. · DOI
- Yan X, Zhu M-J, Dodson MV, Du M. Developmental programming of fetal skeletal muscle and adipose tissue development. J Genomics. 2013;1:29–38. · DOI
- Strang LB. The lungs at birth. Arch Dis Child. 1965;40:575. · DOI
- Edfors F, Danielsson F, Hallström BM, Käll L, Lundberg E, Pontén F, et al. Gene-specific correlation of RNA and protein levels in human cells and tissues. Mol Syst Biol. 2016;12(10):883. · DOI · Paper page
- Miller FJ, Rosenfeldt FL, Zhang C, Linnane AW, Nagley P. Precise determination of mitochondrial DNA copy number in human skeletal and cardiac muscle by a PCR-based assay: lack of change of copy number with age. Nucleic Acids Res. 2003;31(11):e61–e. · DOI
- Lindinger A, Peterli R, Peters T, Kern B, von Flue M, Calame M, et al. Mitochondrial DNA content in human omental adipose tissue. Obes Surg. 2010;20(1):84–92. · DOI
- Svendsen AJ, Tan Q, Jakobsen MA, Thyagarajan B, Nygaard M, Christiansen L, et al. White blood cell mitochondrial DNA copy number is decreased in rheumatoid arthritis and linked with risk factors. A twin study. J Autoimmun. 2019;96:142–6. · DOI
- Williams RS. Mitochondrial gene expression in mammalian striated muscle. Evidence that variation in gene dosage is the major regulatory event. J Biol Chem. 1986;261(26):12390–4. · DOI
- Aloni Y, Attardi G. Expression of the mitochondrial genome in HeLa cells. II. Evidence for complete transcription of mitochondrial DNA. J Mol Biol. 1971;55(2):251–67. · DOI
- Gelfand R, Attardi G. Synthesis and turnover of mitochondrial ribonucleic acid in HeLa cells: the mature ribosomal and messenger ribonucleic acid species are metabolically unstable. Mol Cell Biol. 1981;1(6):497–511.
- Shokolenko IN, Alexeyev MF. Mitochondrial transcription in mammalian cells. Front Biosci (Landmark edition). 2017;22:835–53. · DOI
- Lee JM, Sonnhammer EL. Genomic gene clustering analysis of pathways in eukaryotes. Genome Res. 2003;13(5):875–82. · DOI
- Mercer Tim R, Neph S, Dinger Marcel E, Crawford J, Smith Martin A, Shearwood A-Marie J, et al. The human mitochondrial Transcriptome. Cell. 2011;146(4):645–58. · DOI · Paper page
- Soler-Oliva ME, Guerrero-Martínez JA, Bachetti V, Reyes JC. Analysis of the relationship between coexpression domains and chromatin 3D organization. PLoS Comput Biol. 2017;13(9):e1005708. · DOI
- Fantz CR, Dagogo-Jack S, Ladenson JH, Gronowski AM. Thyroid function during pregnancy. Clin Chem. 1999;45(12):2250. · DOI
- Bush SJ, Hume DA, Clark EL. Unnormalised raw count estimates for the sheep gene expression atlas,[dataset]: University of Edinburgh; 2019. https://doi.org/10.7488/ds/2616. · DOI
- Zimin AV, Delcher AL, Florea L, Kelley DR, Schatz MC, Puiu D, et al. A whole-genome assembly of the domestic cow, Bos taurus. Genome Biol. 2009;10(4):R42. · DOI
- Dobin A, Davis CA, Schlesinger F, Drenkow J, Zaleski C, Jha S. STAR: ultrafast universal RNA-seq aligner. Bioinformatics. 2013;29(1):15–21. · DOI · Paper page
- Okonechnikov K, Conesa A, García-Alcalde F. Qualimap 2: advanced multi-sample quality control for high-throughput sequencing data. Bioinformatics. 2016;32(2):292–4. · DOI · Paper page
- Liao Y, Smyth GK, Shi W. featureCounts: an efficient general purpose program for assigning sequence reads to genomic features. Bioinformatics. 2014;30(7):923–30. · DOI · Paper page
- da Huang W, Sherman BT, Lempicki RA. Systematic and integrative analysis of large gene lists using DAVID bioinformatics resources. Nat Protoc. 2009;4(1):44–57. · DOI · Paper page
- da Huang W, Sherman BT, Lempicki RA. Bioinformatics enrichment tools: paths toward the comprehensive functional analysis of large gene lists. Nucleic Acids Res. 2009;37(1):1–13. · DOI · Paper page
- Brand MD, Orr AL, Perevoshchikova IV, Quinlan CL. The role of mitochondrial function and cellular bioenergetics in ageing and disease. Br J Dermatol. 2013;169(Suppl 2(0 2)):1–8. · DOI
- Chinnery PF, Schon EA. Mitochondria. J Neurol Neurosurg Psychiatry. 2003;74(9):1188–99. · DOI
- Robinson MD, McCarthy DJ, Smyth GK. edgeR: a bioconductor package for differential expression analysis of digital gene expression data. Bioinformatics. 2010;26(1):139–40. · DOI · Paper page
- Kolde R. Pheatmap: pretty heatmaps. R Package Version 61 ed; 2012.
- Hui S, Sander C, Potylitsine E, Whitaker W, Bader G, Morrison L, et al. ExpressionCorrelation. Makes a similarity network where nodes are genes, and edges denote highly correlated genes. Version 1.1.0 ed 2015.
- Shannon P, Markiel A, Ozier O, Baliga NS, Wang JT, Ramage D, et al. Cytoscape: A software environment for integrated models of biomolecular interaction networks. Genome Res. 2003;13(11):2498–504. · DOI · Paper page
- Wang M, Hancock TP, Chamberlain AJ, Vander Jagt CJ, Pryce JE, Cocks BG, et al. Putative bovine topological association domains and CTCF binding motifs can reduce the search space for causative regulatory variants of complex traits. BMC Genomics. 2018;19(1):395. · DOI
- Kanehisa M, Goto S. KEGG: Kyoto encyclopedia of genes and genomes. Nucleic Acids Res. 2000;28(1):27–30. · DOI · Paper page
Metadata
- Authors
- Dorji, J., Vander Jagt, C. J., Garner, J. B., Marett, L. C., Mason, B. A., Reich, C. M., Xiang, R., Clark, E. L., Cocks, B. G., Chamberlain, A. J., MacLeod, I. M., & Daetwyler, H. D.
- Affiliations
- La Trobe University (AU)
- Agriculture Victoria (AU)
- The University of Melbourne (AU)
- Roslin Institute (GB)
- Corresponding author
- Dorji, Jigme
- ORCID
- Venue
- BMC Genomics
- Published
- 2020-10-19
- Volume
- 21
- Issue
- 1
- Pages
- 720-720
- ISSN
- 1471-2164 (ISSN-L)
- PMC
- PMC7574280
- OpenAlex
- W3092917020
- Cited by
- 26
- References
- 7
- Citations by year
- 2026: 3 · 2025: 2 · 2024: 7 · 2023: 8 · 2022: 1 · 2021: 4 · 2020: 1
- FWCI
- 1.13
- Type
- journal article
- Language
- en
- Update notices
- correction (2022-04-20)
- Open access
- gold
- doi.org
- Locations
- BMC Genomics (publishedVersion, cc-by)
- Research Square (acceptedVersion, cc-by)
- PubMed Central (publishedVersion, cc-by)
- PubMed (publishedVersion)
- DOAJ (DOAJ: Directory of Open Access Journals) (submittedVersion, cc-by-sa)
- Minerva Access (University of Melbourne) (submittedVersion, cc-by)
- Edinburgh Research Explorer (University of Edinburgh) (submittedVersion, cc-by)
- Funders
- Agriculture Victoria & Dairy Australia (DairyBio)
- Topics
- Life Sciences › Biochemistry, Genetics and Molecular Biology › Molecular Biology › Mitochondrial Function and Pathology
- Life Sciences › Biochemistry, Genetics and Molecular Biology › Genetics › Genetic and phenotypic traits in livestock
- Life Sciences › Biochemistry, Genetics and Molecular Biology › Molecular Biology › Genomics and Phylogenetic Studies
- Keywords
- mitochondrial proteins, mitochondrial genome, energy metabolism, dairy cattle, tissue-specific gene expression, differential gene expression, co-expression network, mitochondrial disease, fetal tissue
- MeSH terms
- Animals, Cattle, Energy Metabolism, Female, Sheep, Gene Expression, Gene Expression Profiling, Mitochondrial Proteins, Genome, Mitochondrial
About these checks
Registry, retraction, Cites and statistics results are computed, not judged, with one exception: a printed reference that no index lists is read once by a model before it counts as a citation error. Claims are extracted by a model and kept only when their quote appears verbatim in the text; each cited source is then checked, with a model’s help, for whether it says what the claim relies on. Those verdicts can be wrong — read the claim’s quote and the cited source before relying on one.
Statistics and arithmetic are recomputed, not judged.
Confidence bands are shown only for fields calibrated on our annotated test set. None is calibrated yet, so no band is shown.
What counts as a claim ›How we measure confidence ›How we check this ›
Are you an author, or do you see a problem with this page? Request a review
