

The DOI matches its Crossref record; 6 of the 6 references it cites were found in a registry or an index.
The impact of single and pairwise Toll-like receptor activation on neuroinflammation and neurodegeneration
Overview
The claims and statistics of this paper haven’t been checked yet.
Run the check — free, no account needed. It reads the open-access text and checks the sources it cites.
Integrity signals
Registry
Cites
Statistics
Figures
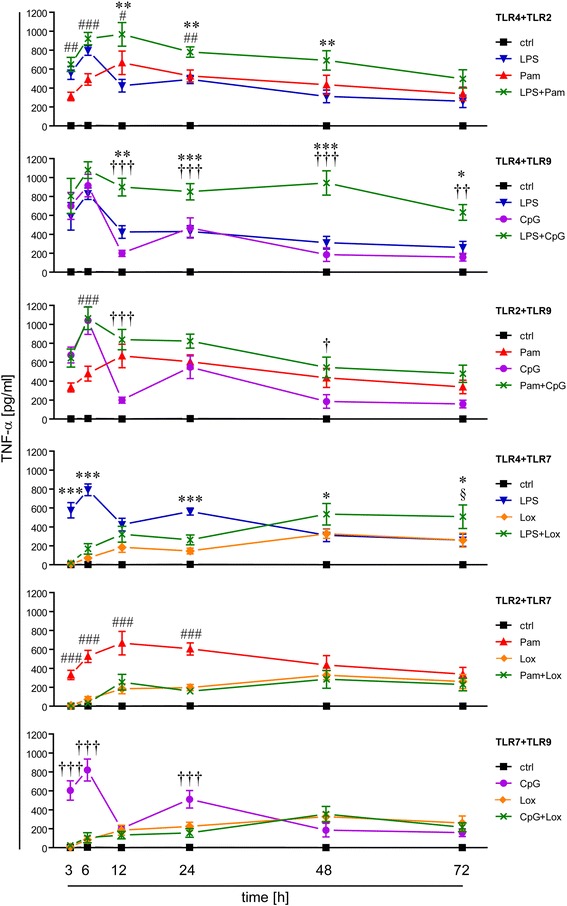
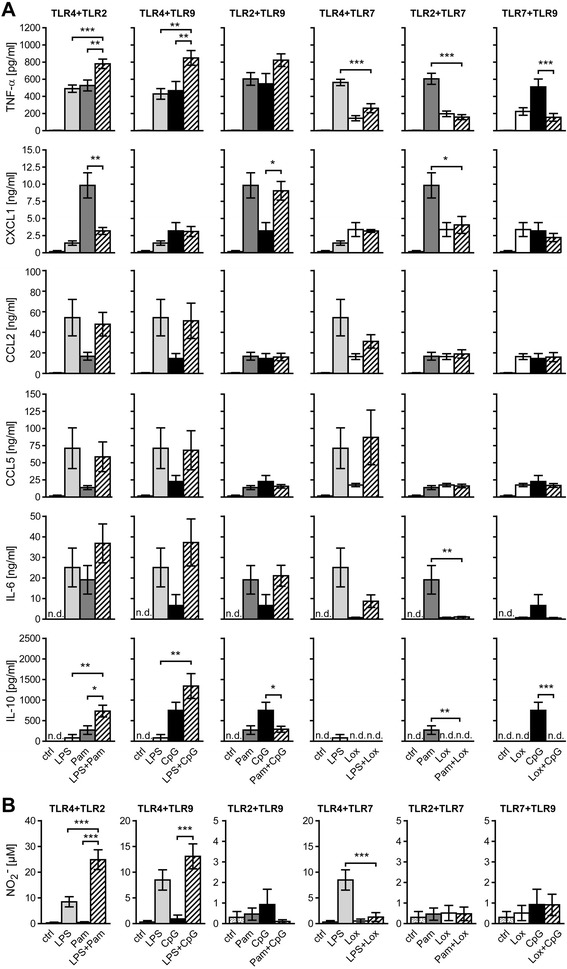
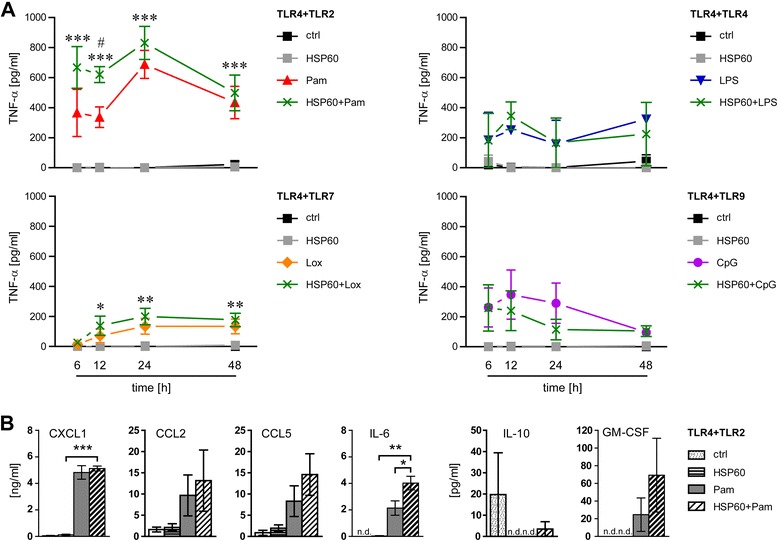
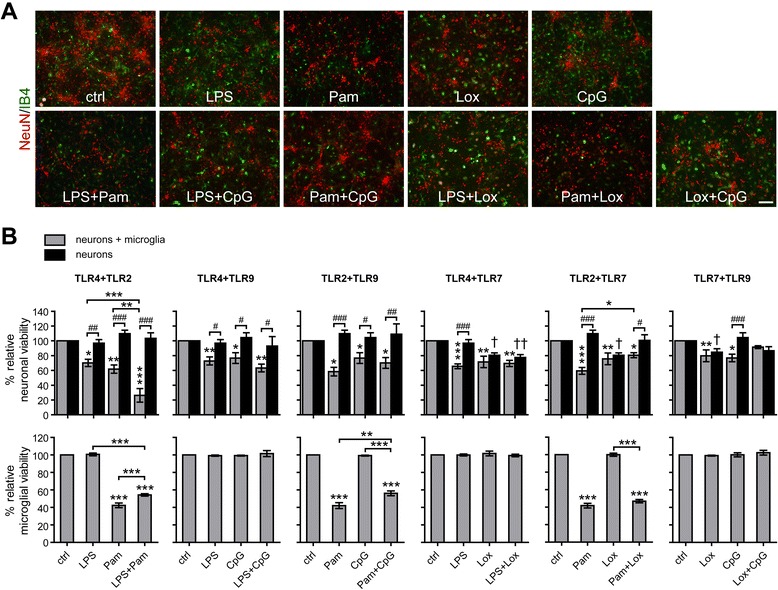
Verification
Claims the paper makes
The claims and statistics of this paper haven’t been checked yet.
Run the check — free, no account needed. It reads the open-access text and checks the sources it cites.
Claims other papers make about this one
Each is checked against this paper’s own text: does it say what the citing paper says it does?
The source backs part of the claim, not all of it — or backs it for a different population, condition or comparison.
In the citing paper
“the model of intrathecal injection has been established over the past years in our laboratory to evaluate the effects of extracellular single-stranded RNA in the CNS in vivo [4, 7, 8, 76, 77]”
From Neurodegenerative disease-associated microRNAs acting as signaling molecules modulate CNS neuron structure and viability (2025) · cites this paper as [77]
Experimental — accuracy not yet measured
Self-check
Percentages, sums and reported differences re-computed from the paper’s own numbers.
The self-check needs the paper’s full text.
Citations
Cites
Three or more routes for leukocyte migration into the central nervous system
Ransohoff, R. M., Kivisäkk, P., & Kidd, G. (2003) · Nature Reviews Immunology · doi:10.1038/nri1130 · Cited by 1,052
TLR signaling tailors innate immune responses in human microglia and astrocytes
Jack, C. S., Arbour, N., Manusow, J., Montgrain, V., Blain, M., McCrea, E., Shapiro, A., & Antel, J. P. (2005) · The Journal of Immunology · doi:10.4049/jimmunol.175.7.4320 · Cited by 734 · cited 1×
“All cells of the CNS express TLRs, while each cell type displays its own subset of differentially expressed TLRs and related signaling adaptor proteins [5-10].”
BackgroundNeuronal injury mediated via stimulation of microglial toll-like receptor-9 (TLR9)
Iliev, A. I., Stringaris, A. K., Nau, R., & Neumann, H. (2004) · The FASEB Journal · doi:10.1096/fj.03-0670fje · Cited by 192
Expression of Toll-Like Receptors in the Developing Brain
Kaul, D., Habbel, P., Derkow, K., Krüger, C., Franzoni, E., Wulczyn, F. G., Bereswill, S., Nitsch, R., Schott, E., Veh, R., et al. (2012) · PLoS ONE · doi:10.1371/journal.pone.0037767 · Cited by 141
Self-citationToll-Like Receptors: Sensor Molecules for Detecting Damage to the Nervous System
Lee, H., Lee, S., Cho, I.-H., & Joong Lee, S. (2013) · Current Protein & Peptide Science · doi:10.2174/1389203711314010006 · Cited by 113 · cited 1×
“DAMPs identified as TLR ligands include heat shock protein 60 (HSP60) and fibrinogen for TLR4 as well as gangliosides and hyaluronic acid fragments for TLR2 [3].”
BackgroundButchi, N. B., Du, M., & Peterson, K. E. (2010) · Glia · doi:10.1002/glia.20952 · Cited by 109
Research works printed but not linked: 53
- Kawai T, Akira S: The role of pattern-recognition receptors in innate immunity: update on Toll-like receptors. Nat Immunol. 2010, 11: 373-384. 10.1038/ni.1863. · DOI · Paper page
- Broz P, Monack DM: Newly described pattern recognition receptors team up against intracellular pathogens. Nat Rev Immunol. 2013, 13: 551-565. 10.1038/nri3479. · DOI
- Owens T: Toll-like receptors in neurodegeneration. Curr Top Microbiol Immunol. 2009, 336: 105-120.
- Bsibsi M, Ravid R, Gveric D, van Noort JM: Broad expression of Toll-like receptors in the human central nervous system. J Neuropathol Exp Neurol. 2002, 61: 1013-1021. · DOI
- Lehmann SM, Rosenberger K, Kruger C, Habbel P, Derkow K, Kaul D, Rybak A, Brandt C, Schott E, Wulczyn FG, Lehnardt S: Extracellularly delivered single-stranded viral RNA causes neurodegeneration dependent on TLR7. J Immunol. 2012, 189: 1448-1458. 10.4049/jimmunol.1201078. · DOI · Paper page
- Tang SC, Arumugam TV, Xu X, Cheng A, Mughal MR, Jo DG, Lathia JD, Siler DA, Chigurupati S, Ouyang X, Magnus T, Camandola S, Mattson MP: Pivotal role for neuronal Toll-like receptors in ischemic brain injury and functional deficits. Proc Natl Acad Sci U S A. 2007, 104: 13798-13803. 10.1073/pnas.0702553104. · DOI · Paper page
- Kim Y, Zhou P, Qian L, Chuang JZ, Lee J, Li C, Iadecola C, Nathan C, Ding A: MyD88-5 links mitochondria, microtubules, and JNK3 in neurons and regulates neuronal survival. J Exp Med. 2007, 204: 2063-2074. 10.1084/jem.20070868. · DOI · Paper page
- Ziegler G, Harhausen D, Schepers C, Hoffmann O, Rohr C, Prinz V, Konig J, Lehrach H, Nietfeld W, Trendelenburg G: TLR2 has a detrimental role in mouse transient focal cerebral ischemia. Biochem Biophys Res Commun. 2007, 359: 574-579. 10.1016/j.bbrc.2007.05.157. · DOI
- Mishra BB, Gundra UM, Teale JM: Expression and distribution of Toll-like receptors 11-13 in the brain during murine neurocysticercosis. J Neuroinflammation. 2008, 5: 53-10.1186/1742-2094-5-53. · DOI
- Hanke ML, Kielian T: Toll-like receptors in health and disease in the brain: mechanisms and therapeutic potential. Clin Sci (Lond). 2011, 121: 367-387. 10.1042/CS20110164. · DOI
- Tahara K, Kim HD, Jin JJ, Maxwell JA, Li L, Fukuchi K: Role of toll-like receptor signalling in Abeta uptake and clearance. Brain. 2006, 129: 3006-3019. 10.1093/brain/awl249. · DOI · Paper page
- Weber JR, Tuomanen EI: Cellular damage in bacterial meningitis: an interplay of bacterial and host driven toxicity. J Neuroimmunol. 2007, 184: 45-52. 10.1016/j.jneuroim.2006.11.016. · DOI
- Lehmann SM, Kruger C, Park B, Derkow K, Rosenberger K, Baumgart J, Trimbuch T, Eom G, Hinz M, Kaul D, Habbel P, Kälin R, Franzoni E, Rybak A, Nguyen D, Veh R, Ninnemann O, Peters O, Nitsch R, Heppner FL, Golenbock D, Schott E, Ploegh HL, Wulczyn FG, Lehnardt S: An unconventional role for miRNA: let-7 activates Toll-like receptor 7 and causes neurodegeneration. Nat Neurosci. 2012, 15: 827-835. 10.1038/nn.3113. · DOI · Paper page
- Boje KM, Arora PK: Microglial-produced nitric oxide and reactive nitrogen oxides mediate neuronal cell death. Brain Res. 1992, 587: 250-256. 10.1016/0006-8993(92)91004-X. · DOI · Paper page
- Lehnardt S, Schott E, Trimbuch T, Laubisch D, Krueger C, Wulczyn G, Nitsch R, Weber JR: A vicious cycle involving release of heat shock protein 60 from injured cells and activation of toll-like receptor 4 mediates neurodegeneration in the CNS. J Neurosci. 2008, 28: 2320-2331. 10.1523/JNEUROSCI.4760-07.2008. · DOI
- Hoffmann O, Braun JS, Becker D, Halle A, Freyer D, Dagand E, Lehnardt S, Weber JR: TLR2 mediates neuroinflammation and neuronal damage. J Immunol. 2007, 178: 6476-6481. 10.4049/jimmunol.178.10.6476. · DOI
- Lehnardt S, Massillon L, Follett P, Jensen FE, Ratan R, Rosenberg PA, Volpe JJ, Vartanian T: Activation of innate immunity in the CNS triggers neurodegeneration through a Toll-like receptor 4-dependent pathway. Proc Natl Acad Sci U S A. 2003, 100: 8514-8519. 10.1073/pnas.1432609100. · DOI · Paper page
- Rieu I, Powers SJ: Real-time quantitative RT-PCR: design, calculations, and statistics. Plant Cell. 2009, 21: 1031-1033. 10.1105/tpc.109.066001. · DOI · Paper page
- Olson JK, Miller SD: Microglia initiate central nervous system innate and adaptive immune responses through multiple TLRs. J Immunol. 2004, 173: 3916-3924. 10.4049/jimmunol.173.6.3916. · DOI · Paper page
- Ebert S, Gerber J, Bader S, Muhlhauser F, Brechtel K, Mitchell TJ, Nau R: Dose-dependent activation of microglial cells by Toll-like receptor agonists alone and in combination. J Neuroimmunol. 2005, 159: 87-96. 10.1016/j.jneuroim.2004.10.005. · DOI
- Bessler WG, Johnson RB, Wiesmuller K, Jung G: B-lymphocyte mitogenicity in vitro of a synthetic lipopeptide fragment derived from bacterial lipoprotein. Hoppe Seylers Z Physiol Chem. 1982, 363: 767-770. 10.1515/bchm2.1982.363.2.767. · DOI
- Takeuchi O, Sato S, Horiuchi T, Hoshino K, Takeda K, Dong Z, Modlin RL, Akira S: Cutting edge: role of Toll-like receptor 1 in mediating immune response to microbial lipoproteins. J Immunol. 2002, 169: 10-14. 10.4049/jimmunol.169.1.10. · DOI
- Yamamoto M, Sato S, Mori K, Hoshino K, Takeuchi O, Takeda K, Akira S: Cutting edge: a novel Toll/IL-1 receptor domain-containing adapter that preferentially activates the IFN-beta promoter in the Toll-like receptor signaling. J Immunol. 2002, 169: 6668-6672. 10.4049/jimmunol.169.12.6668. · DOI
- Yamamoto M, Sato S, Hemmi H, Sanjo H, Uematsu S, Kaisho T, Hoshino K, Takeuchi O, Kobayashi M, Fujita T, Takeda K, Akira S: Essential role for TIRAP in activation of the signalling cascade shared by TLR2 and TLR4. Nature. 2002, 420: 324-329. 10.1038/nature01182. · DOI
- Lehnardt S, Henneke P, Lien E, Kasper DL, Volpe JJ, Bechmann I, Nitsch R, Weber JR, Golenbock DT, Vartanian T: A mechanism for neurodegeneration induced by group B streptococci through activation of the TLR2/MyD88 pathway in microglia. J Immunol. 2006, 177: 583-592. 10.4049/jimmunol.177.1.583. · DOI
- Lehnardt S, Wennekamp J, Freyer D, Liedtke C, Krueger C, Nitsch R, Bechmann I, Weber JR, Henneke P: TLR2 and caspase-8 are essential for group B Streptococcus-induced apoptosis in microglia. J Immunol. 2007, 179: 6134-6143. 10.4049/jimmunol.179.9.6134. · DOI
- Bottcher T, von Mering M, Ebert S, Meyding-Lamade U, Kuhnt U, Gerber J, Nau R: Differential regulation of Toll-like receptor mRNAs in experimental murine central nervous system infections. Neurosci Lett. 2003, 344: 17-20. 10.1016/S0304-3940(03)00404-X. · DOI
- Henneke P, Takeuchi O, Malley R, Lien E, Ingalls RR, Freeman MW, Mayadas T, Nizet V, Akira S, Kasper DL, Golenbock DT: Cellular activation, phagocytosis, and bactericidal activity against group B streptococcus involve parallel myeloid differentiation factor 88-dependent and independent signaling pathways. J Immunol. 2002, 169: 3970-3977. 10.4049/jimmunol.169.7.3970. · DOI · Paper page
- Nicolle D, Fremond C, Pichon X, Bouchot A, Maillet I, Ryffel B, Quesniaux VJ: Long-term control of Mycobacterium bovis BCG infection in the absence of Toll-like receptors (TLRs): investigation of TLR2-, TLR6-, or TLR2-TLR4-deficient mice. Infect Immun. 2004, 72: 6994-7004. 10.1128/IAI.72.12.6994-7004.2004. · DOI
- Kono H, Rock KL: How dying cells alert the immune system to danger. Nat Rev Immunol. 2008, 8: 279-289. 10.1038/nri2215. · DOI · Paper page
- Lehnardt S, Lehmann S, Kaul D, Tschimmel K, Hoffmann O, Cho S, Krueger C, Nitsch R, Meisel A, Weber JR: Toll-like receptor 2 mediates CNS injury in focal cerebral ischemia. J Neuroimmunol. 2007, 190: 28-33. 10.1016/j.jneuroim.2007.07.023. · DOI
- Koedel U, Angele B, Rupprecht T, Wagner H, Roggenkamp A, Pfister HW, Kirschning CJ: Toll-like receptor 2 participates in mediation of immune response in experimental pneumococcal meningitis. J Immunol. 2003, 170: 438-444. 10.4049/jimmunol.170.1.438. · DOI
- Sato S, Nomura F, Kawai T, Takeuchi O, Muhlradt PF, Takeda K, Akira S: Synergy and cross-tolerance between toll-like receptor (TLR) 2- and TLR4-mediated signaling pathways. J Immunol. 2000, 165: 7096-7101. 10.4049/jimmunol.165.12.7096. · DOI
- Beutler E, Gelbart T, West C: Synergy between TLR2 and TLR4: a safety mechanism. Blood Cells Mol Dis. 2001, 27: 728-730. 10.1006/bcmd.2001.0441. · DOI
- Bagchi A, Herrup EA, Warren HS, Trigilio J, Shin HS, Valentine C, Hellman J: MyD88-dependent and MyD88-independent pathways in synergy, priming, and tolerance between TLR agonists. J Immunol. 2007, 178: 1164-1171. 10.4049/jimmunol.178.2.1164. · DOI
- Gao JJ, Xue Q, Papasian CJ, Morrison DC: Bacterial DNA and lipopolysaccharide induce synergistic production of TNF-alpha through a post-transcriptional mechanism. J Immunol. 2001, 166: 6855-6860. 10.4049/jimmunol.166.11.6855. · DOI
- Gao JJ, Zuvanich EG, Xue Q, Horn DL, Silverstein R, Morrison DC: Cutting edge: bacterial DNA and LPS act in synergy in inducing nitric oxide production in RAW 264.7 macrophages. J Immunol. 1999, 163: 4095-4099. · DOI
- Blanco P, Palucka AK, Pascual V, Banchereau J: Dendritic cells and cytokines in human inflammatory and autoimmune diseases. Cytokine Growth Factor Rev. 2008, 19: 41-52. 10.1016/j.cytogfr.2007.10.004. · DOI
- Wang J, Shao Y, Bennett TA, Shankar RA, Wightman PD, Reddy LG: The functional effects of physical interactions among Toll-like receptors 7, 8, and 9. J Biol Chem. 2006, 281: 37427-37434. 10.1074/jbc.M605311200. · DOI
- Berghofer B, Haley G, Frommer T, Bein G, Hackstein H: Natural and synthetic TLR7 ligands inhibit CpG-A- and CpG-C-oligodeoxynucleotide-induced IFN-alpha production. J Immunol. 2007, 178: 4072-4079. 10.4049/jimmunol.178.7.4072. · DOI
- Marshall JD, Heeke DS, Gesner ML, Livingston B, Van Nest G: Negative regulation of TLR9-mediated IFN-alpha induction by a small-molecule, synthetic TLR7 ligand. J Leukoc Biol. 2007, 82: 497-508. 10.1189/jlb.0906575. · DOI
- Hailer NP, Jarhult JD, Nitsch R: Resting microglial cells in vitro: analysis of morphology and adhesion molecule expression in organotypic hippocampal slice cultures. Glia. 1996, 18: 319-331. 10.1002/(SICI)1098-1136(199612)18:4<319::AID-GLIA6>3.0.CO;2-S. · DOI
- Tauber SC, Ebert S, Weishaupt JH, Reich A, Nau R, Gerber J: Stimulation of Toll-like receptor 9 by chronic intraventricular unmethylated cytosine-guanine DNA infusion causes neuroinflammation and impaired spatial memory. J Neuropathol Exp Neurol. 2009, 68: 1116-1124. 10.1097/NEN.0b013e3181b7fde5. · DOI
- Yang QW, Lu FL, Zhou Y, Wang L, Zhong Q, Lin S, Xiang J, Li JC, Fang CQ, Wang JZ: HMBG1 mediates ischemia-reperfusion injury by TRIF-adaptor independent Toll-like receptor 4 signaling. J Cereb Blood Flow Metab. 2011, 31: 593-605. 10.1038/jcbfm.2010.129. · DOI
- Dalpke AH, Lehner MD, Hartung T, Heeg K: Differential effects of CpG-DNA in Toll-like receptor-2/-4/-9 tolerance and cross-tolerance. Immunology. 2005, 116: 203-212. 10.1111/j.1365-2567.2005.02211.x. · DOI
- Mallard C: Innate immune regulation by toll-like receptors in the brain. ISRN Neurol. 2012, 2012: 701950-10.5402/2012/701950. · DOI
- Rosenzweig HL, Minami M, Lessov NS, Coste SC, Stevens SL, Henshall DC, Meller R, Simon RP, Stenzel-Poore MP: Endotoxin preconditioning protects against the cytotoxic effects of TNFalpha after stroke: a novel role for TNFalpha in LPS-ischemic tolerance. J Cereb Blood Flow Metab. 2007, 27: 1663-1674. 10.1038/sj.jcbfm.9600464. · DOI
- Stevens SL, Ciesielski TM, Marsh BJ, Yang T, Homen DS, Boule JL, Lessov NS, Simon RP, Stenzel-Poore MP: Toll-like receptor 9: a new target of ischemic preconditioning in the brain. J Cereb Blood Flow Metab. 2008, 28: 1040-1047. 10.1038/sj.jcbfm.9600606. · DOI
- Hua F, Ma J, Ha T, Kelley J, Williams DL, Kao RL, Kalbfleisch JH, Browder IW, Li C: Preconditioning with a TLR2 specific ligand increases resistance to cerebral ischemia/reperfusion injury. J Neuroimmunol. 2008, 199: 75-82. 10.1016/j.jneuroim.2008.05.009. · DOI
- Pradillo JM, Fernandez-Lopez D, Garcia-Yebenes I, Sobrado M, Hurtado O, Moro MA, Lizasoain I: Toll-like receptor 4 is involved in neuroprotection afforded by ischemic preconditioning. J Neurochem. 2009, 109: 287-294. 10.1111/j.1471-4159.2009.05972.x. · DOI
- Fan H, Cook JA: Molecular mechanisms of endotoxin tolerance. J Endotoxin Res. 2004, 10: 71-84. 10.1179/096805104225003997. · DOI
- Kreutzberg GW: Microglia: a sensor for pathological events in the CNS. Trends Neurosci. 1996, 19: 312-318. 10.1016/0166-2236(96)10049-7. · DOI · Paper page
- Henderson B, Calderwood SK, Coates AR, Cohen I, van Eden W, Lehner T, Pockley AG: Caught with their PAMPs down? The extracellular signalling actions of molecular chaperones are not due to microbial contaminants. Cell Stress Chaperones. 2010, 15: 123-141. 10.1007/s12192-009-0137-6. · DOI
Cited by
Sorted by citations
Microglia: Agents of the CNS Pro-Inflammatory Response
Rodríguez-Gómez, J. A., Kavanagh, E., Engskog-Vlachos, P., Engskog, M. K. R., Herrera, A. J., Espinosa-Oliva, A. M., Joseph, B., Hajji, N., Venero, J. L., & Burguillos, M. A. (2020) · Cells · doi:10.3390/cells9071717 · Cited by 365
Role of Microglia TLRs in Neurodegeneration
Fiebich, B. L., Batista, C. R. A., Saliba, S. W., Yousif, N. M., & de Oliveira, A. C. P. (2018) · Frontiers in Cellular Neuroscience · doi:10.3389/fncel.2018.00329 · Cited by 291
Zeng, J., Bao, T., Yang, K., Zhu, X., Wang, S., Xiang, W., Ge, A., Zeng, L., & Ge, J. (2023) · Frontiers in Immunology · doi:10.3389/fimmu.2022.1047550 · Cited by 175
Clark, I. A., & Vissel, B. (2015) · British Journal of Pharmacology · doi:10.1111/bph.13181 · Cited by 84
TLR-Mediated Signal Transduction and Neurodegenerative Disorders
Adhikarla, S. V., Jha, N. K., Goswami, V. K., Sharma, A., Bhardwaj, A., Dey, A., Villa, C., Kumar, Y., & Jha, S. K. (2021) · Brain Sciences · doi:10.3390/brainsci11111373 · Cited by 50
Kumbol, V., Ivanov, A., McGurran, H., Schüler, J., Zhai, Y., Ludwik, K., Hinkelmann, L., Brehm, M., Krüger, C., Küchler, J., et al. (2025) · Cell Communication and Signaling · doi:10.1186/s12964-025-02199-8 · Cited by 8
Self-citation
Metadata
- Authors
- Rosenberger, K., Derkow, K., Dembny, P., Krüger, C., Schott, E., & Lehnardt, S.
- Venue
- Journal of Neuroinflammation
- Published
- 2014-09-20
- Volume
- 11
- Issue
- 1
- ISSN
- 1742-2094
- PMC
- PMC4182775
- Cited by
- 84
- References
- 6
- Language
- en
About these checks
Registry, retraction, Cites and statistics results are computed, not judged, with one exception: a printed reference that no index lists is read once by a model before it counts as a citation error. Claims are extracted by a model and kept only when their quote appears verbatim in the text; each cited source is then checked, with a model’s help, for whether it says what the claim relies on. Those verdicts can be wrong — read the claim’s quote and the cited source before relying on one.
Statistics and arithmetic are recomputed, not judged.
Confidence bands are shown only for fields calibrated on our annotated test set. None is calibrated yet, so no band is shown.
What counts as a claim ›How we measure confidence ›How we check this ›
Are you an author, or do you see a problem with this page? Request a review
