

The DOI matches its Crossref record; 20 of the 20 references it cites were found in a registry or an index.
iPSC-derived PSEN2 (N141I) astrocytes and microglia exhibit a primed inflammatory phenotype
Published version of a preprint
Abstract
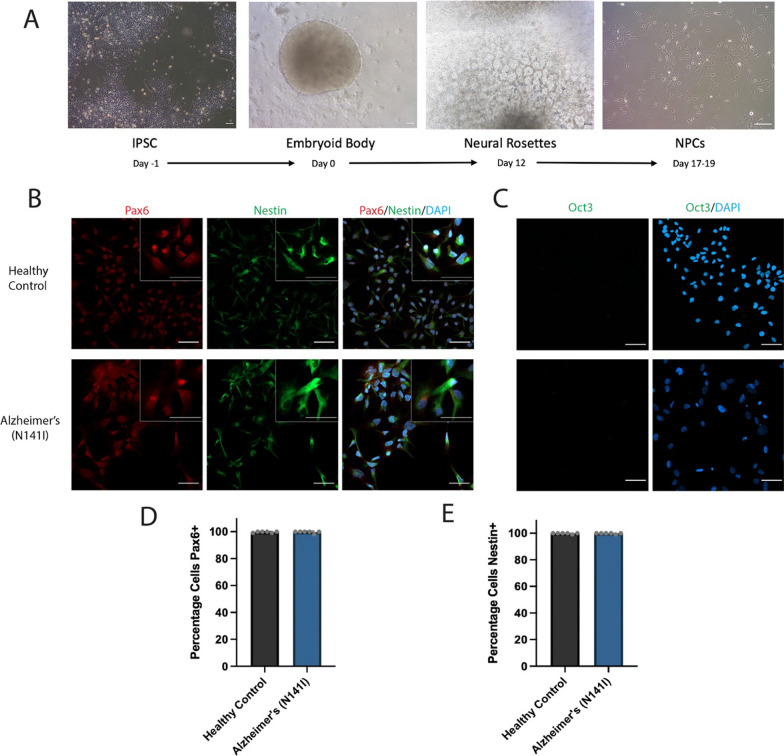
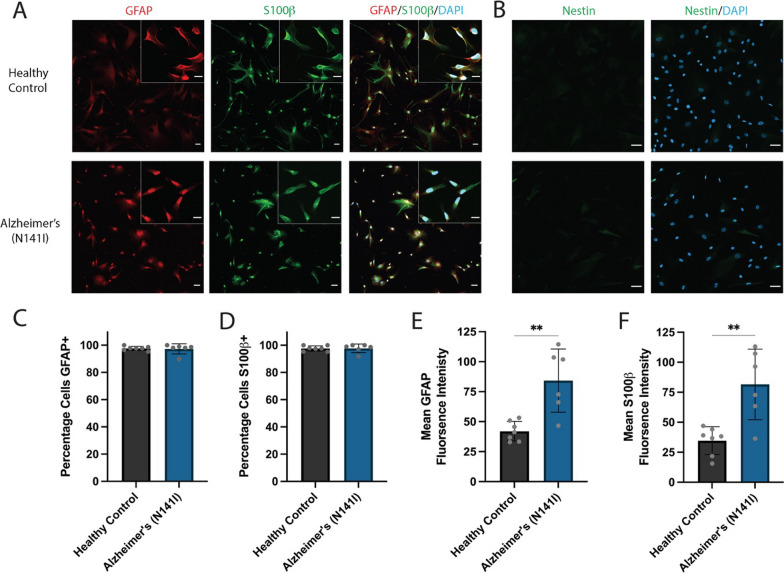
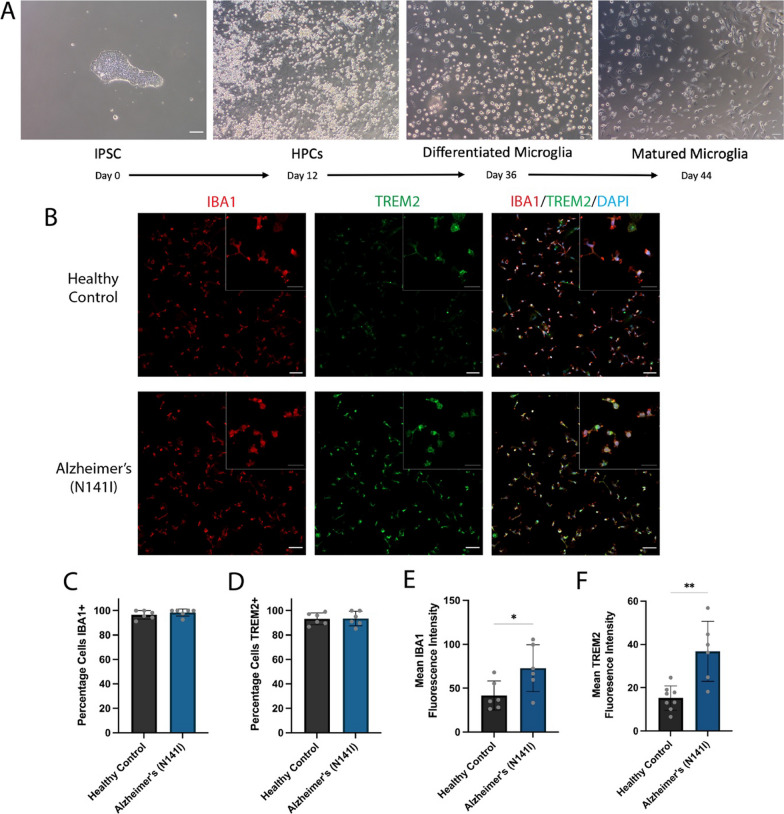
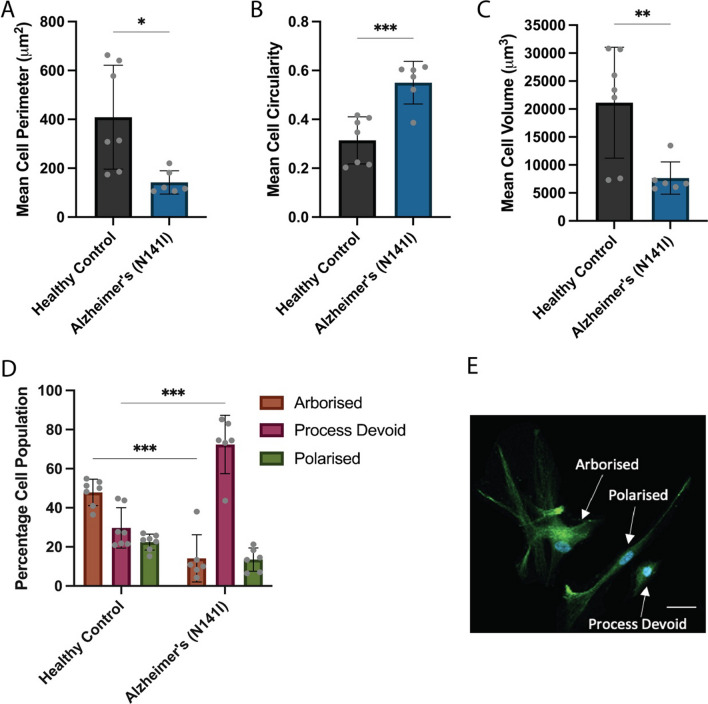
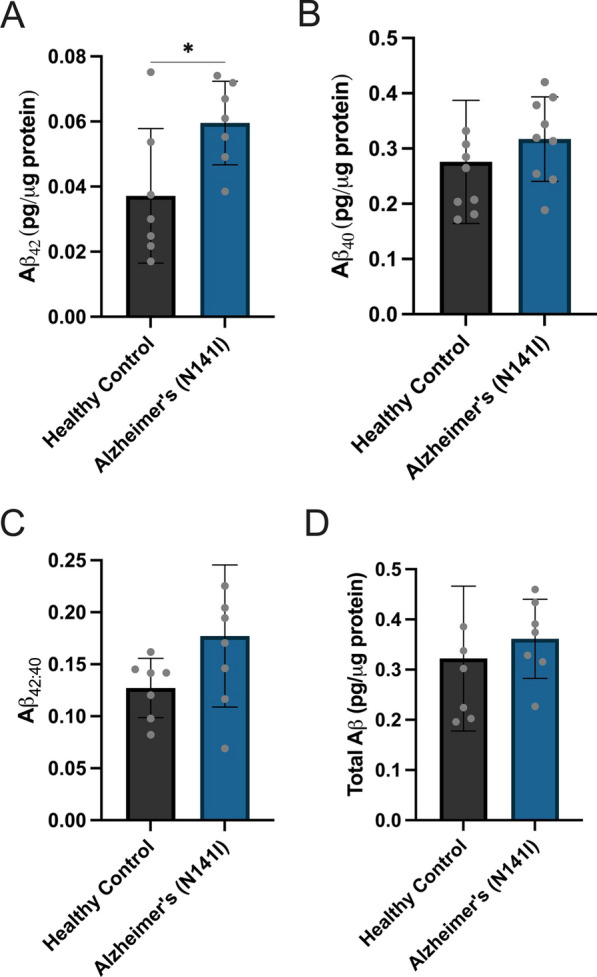
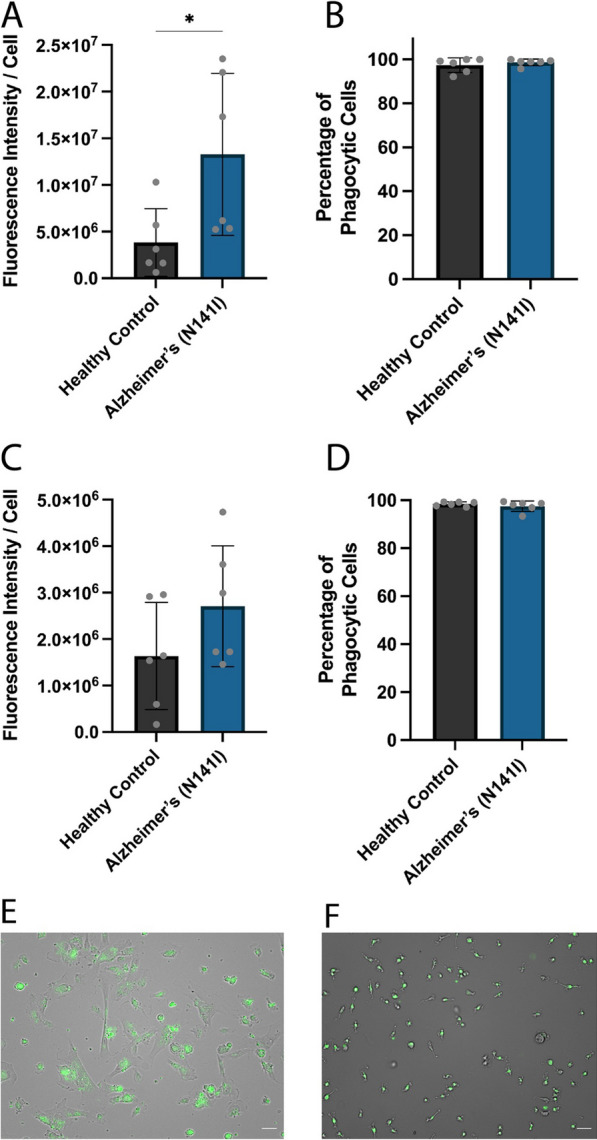
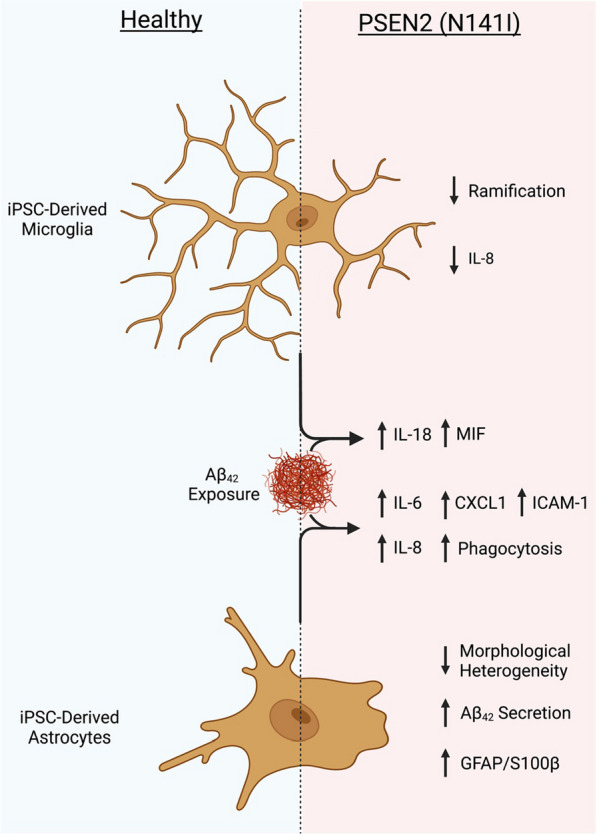
Background: Widescale evidence points to the involvement of glia and immune pathways in the progression of Alzheimer’s disease (AD). AD-associated iPSC-derived glial cells show a diverse range of AD-related phenotypic states encompassing cytokine/chemokine release, phagocytosis and morphological profiles, but to date studies are limited to cells derived from PSEN1, APOE and APP mutations or sporadic patients. The aim of the current study was to successfully differentiate iPSC-derived microglia and astrocytes from patients harbouring an AD-causative PSEN2 (N141I) mutation and characterise the inflammatory and morphological profile of these cells. Methods: iPSCs from three healthy control individuals and three familial AD patients harbouring a heterozygous PSEN2 (N141I) mutation were used to derive astrocytes and microglia-like cells and cell identity and morphology were characterised through immunofluorescent microscopy. Cellular characterisation involved the stimulation of these cells by LPS and Aβ 42 and analysis of cytokine/chemokine release was conducted through ELISAs and multi-cytokine arrays. The phagocytic capacity of these cells was then indexed by the uptake of fluorescently-labelled fibrillar Aβ 42 . Results: AD-derived astrocytes and microglia-like cells exhibited an atrophied and less complex morphological appearance than healthy controls. AD-derived astrocytes showed increased basal expression of GFAP, S100β and increased secretion and phagocytosis of Aβ 42 while AD-derived microglia-like cells showed decreased IL-8 secretion compared to healthy controls. Upon immunological challenge AD-derived astrocytes and microglia-like cells showed exaggerated secretion of the pro-inflammatory IL-6, CXCL1, ICAM-1 and IL-8 from astrocytes and IL-18 and MIF from microglia. Conclusion: Our study showed, for the first time, the differentiation and characterisation of iPSC-derived astrocytes and microglia-like cells harbouring a PSEN2 (N141I) mutation. PSEN2 (N141I)-mutant astrocytes and microglia-like cells presented with a ‘primed’ phenotype characterised by reduced morphological complexity, exaggerated pro-inflammatory cytokine secretion and altered Aβ 42 production and phagocytosis.
Overview
The claims and statistics of this paper haven’t been checked yet.
Run the check — free, no account needed. It reads the open-access text and checks the sources it cites.
Integrity signals
Registry
Cites
Statistics
Figures
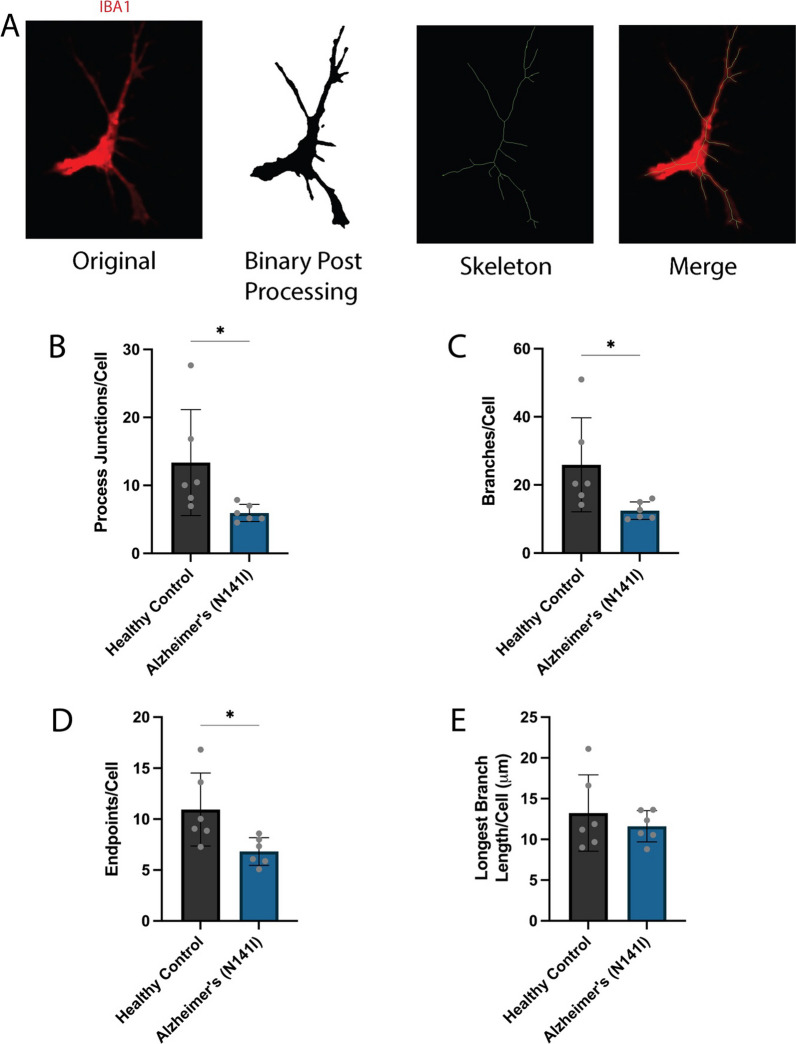
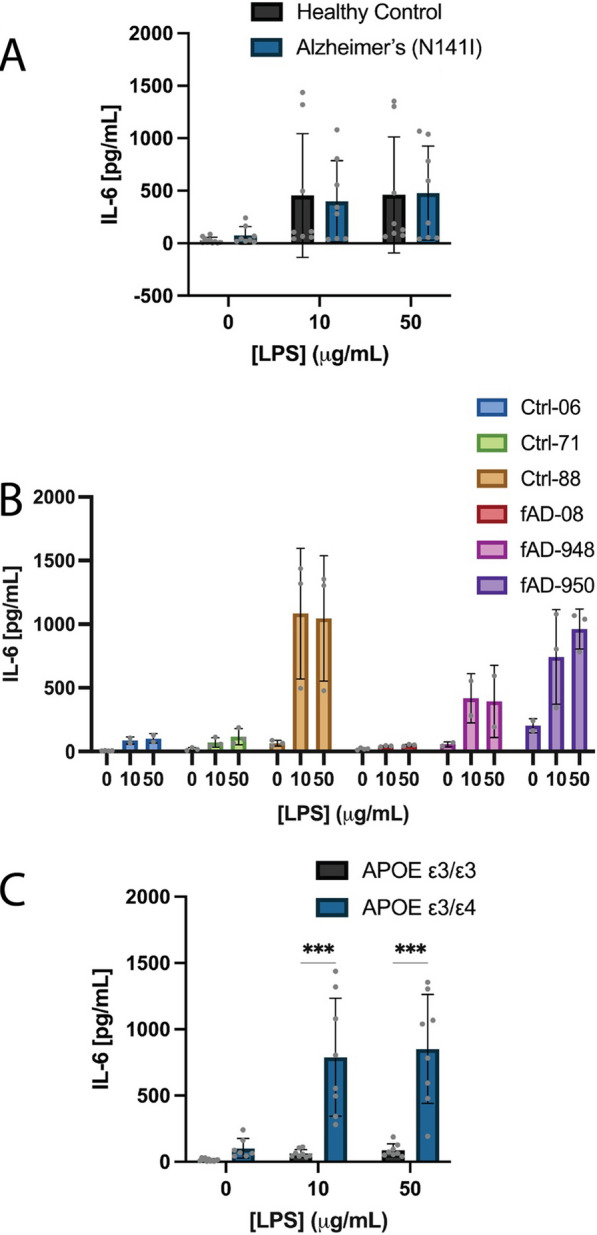
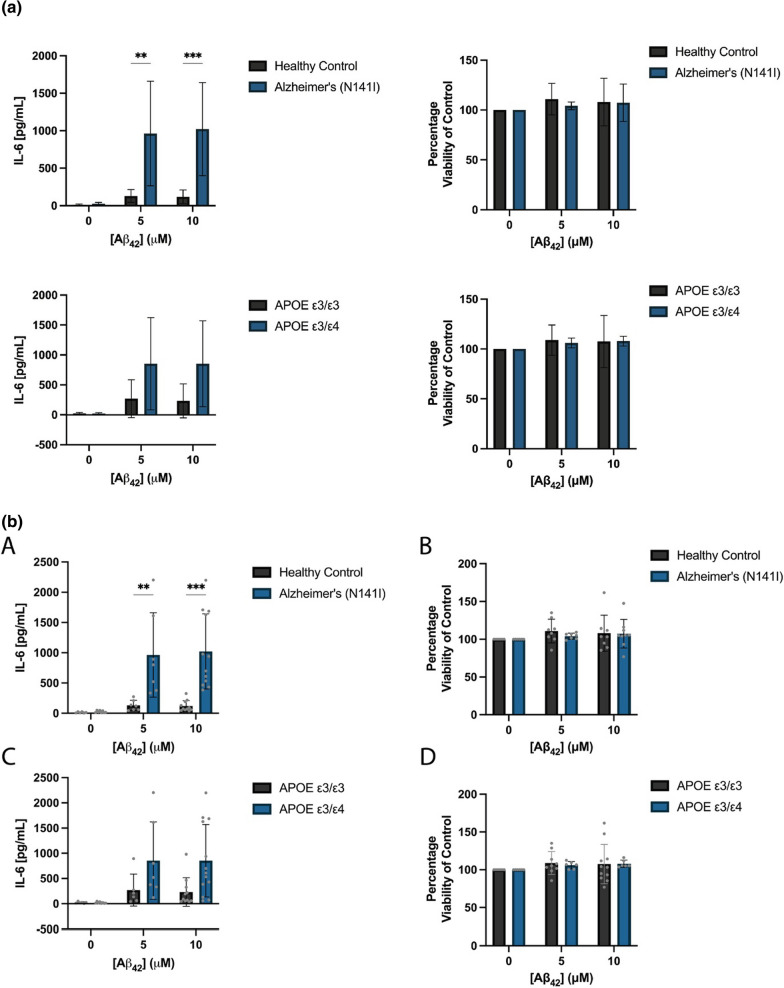
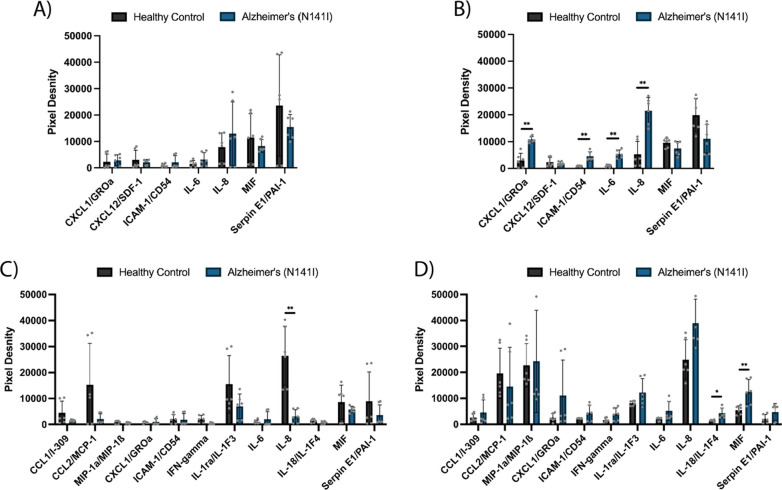
Verification
Claims the paper makes
The claims and statistics of this paper haven’t been checked yet.
Run the check — free, no account needed. It reads the open-access text and checks the sources it cites.
Claims other papers make about this one
Each is checked against this paper’s own text: does it say what the citing paper says it does?
The source backs part of the claim, not all of it — or backs it for a different population, condition or comparison.
In the citing paper
“Notably, iPSC-derived microglia with altered expression of the sAD risk genes APOE4 and TREM2 display pronounced phenotypic differences from control microglia, such as impaired phagocytosis, whereas mutations involved in familial AD have a more limited impact on microglial function [51, 60–63, 119–122].”
From microRNA-132 attenuates inflammation in induced pluripotent stem cell-derived microglia from Alzheimer’s disease patients (2026) · cites this paper as [121]
Experimental — accuracy not yet measured
Self-check
Percentages, sums and reported differences re-computed from the paper’s own numbers.
The self-check needs the paper’s full text.
Citations
Cites
Inflammation as a central mechanism in Alzheimer's disease
Kinney, J. W., Bemiller, S. M., Murtishaw, A. S., Leisgang, A. M., Salazar, A. M., & Lamb, B. T. (2018) · Alzheimer's & Dementia: Translational Research & Clinical Interventions · doi:10.1016/j.trci.2018.06.014 · Cited by 2,253 · cited 1×
“A large body of evidence has implicated neuroinflam-matory changes as a key neuropathological feature within AD progression, largely associated with changes in the states of astrocytes and microglia [13, 68, 69].”
BackgroundMicroglia-specific localisation of a novel calcium binding protein, Iba1
Ito, D., Imai, Y., Ohsawa, K., Nakajima, K., Fukuuchi, Y., & Kohsaka, S. (1998) · Molecular Brain Research · doi:10.1016/s0169-328x(98)00040-0 · Cited by 1,476
Lin, Y.-T., Seo, J., Gao, F., Feldman, H. M., Wen, H.-L., Penney, J., Cam, H. P., Gjoneska, E., Raja, W. K., Cheng, J., et al. (2018) · Neuron · doi:10.1016/j.neuron.2018.05.008 · Cited by 1,125
Alzheimer's disease: experimental models and reality
Drummond, E., & Wisniewski, T. (2017) · Acta Neuropathologica · doi:10.1007/s00401-016-1662-x · Cited by 810
A 3D human triculture system modeling neurodegeneration and neuroinflammation in Alzheimer’s disease
Park, J., Wetzel, I., Marriott, I., Dréau, D., D’Avanzo, C., Kim, D. Y., Tanzi, R. E., & Cho, H. (2018) · Nature Neuroscience · doi:10.1038/s41593-018-0175-4 · Cited by 644
Sloan, S. A., Darmanis, S., Huber, N., Khan, T. A., Birey, F., Caneda, C., Reimer, R., Quake, S. R., Barres, B. A., & Paşca, S. P. (2017) · Neuron · doi:10.1016/j.neuron.2017.07.035 · Cited by 593
Hamelin, L., Lagarde, J., Dorothée, G., Leroy, C., Labit, M., Comley, R. A., de Souza, L. C., Corne, H., Dauphinot, L., Bertoux, M., et al. (2016) · Brain · doi:10.1093/brain/aww017 · Cited by 519
McQuade, A., Coburn, M., Tu, C. H., Hasselmann, J., Davtyan, H., & Blurton-Jones, M. (2018) · Molecular Neurodegeneration · doi:10.1186/s13024-018-0297-x · Cited by 449
NBB-Psy, Böttcher, C., Schlickeiser, S., Sneeboer, M. A. M., Kunkel, D., Knop, A., Paza, E., Fidzinski, P., Kraus, L., Snijders, G. J. L., et al. (2019) · Nature Neuroscience · doi:10.1038/s41593-018-0290-2 · Cited by 436
An Efficient Platform for Astrocyte Differentiation from Human Induced Pluripotent Stem Cells
TCW, J., Wang, M., Pimenova, A. A., Bowles, K. R., Hartley, B. J., Lacin, E., Machlovi, S. I., Abdelaal, R., Karch, C. M., Phatnani, H., et al. (2017) · Stem Cell Reports · doi:10.1016/j.stemcr.2017.06.018 · Cited by 435
Research works printed but not linked: 76
- Bertram L, Tanzi RE. Genome-wide association studies in Alzheimer’s disease. Hum Mol Genet. 2009;18(R2):R137–45. · DOI · Paper page
- D’Avanzo C, Aronson J, Kim YH, Choi SH, Tanzi RE, Kim DY. Alzheimer’s in 3D culture: challenges and perspectives. BioEssays. 2015;37(10):1139–48. · DOI · Paper page
- De Jonghe C, Esselens C, Kumar-Singh S, Craessaerts K, Serneels S, Checler F, et al. Pathogenic APP mutations near the gamma-secretase cleavage site differentially affect Abeta secretion and APP C-terminal fragment stability. Hum Mol Genet. 2001;10(16):1665–71. · DOI · Paper page
- Selkoe DJ. Alzheimer’s disease: genes, proteins, and therapy. Physiol Rev. 2001;81(2):741–66. · DOI · Paper page
- Jayadev S, Leverenz JB, Steinbart E, Stahl J, Klunk W, Yu CE, et al. Alzheimer’s disease phenotypes and genotypes associated with mutations in presenilin 2. Brain. 2010;133(Pt 4):1143–54. · DOI
- Ortiz-Virumbrales M, Moreno CL, Kruglikov I, Marazuela P, Sproul A, Jacob S, et al. CRISPR/Cas9-Correctable mutation-related molecular and physiological phenotypes in iPSC-derived Alzheimer’s PSEN2 N141I neurons. Acta Neuropathol Commun. 2017;5(1):1–20. · DOI
- Tanzi RE, Bertram L. Twenty years of the Alzheimer’s disease amyloid hypothesis: a genetic perspective. Cell. 2005;120(4):545–55. · DOI · Paper page
- Lambert JC, Ibrahim-Verbaas CA, Harold D, Naj AC, Sims R, Bellenguez C, et al. Meta-analysis of 74,046 individuals identifies 11 new susceptibility loci for Alzheimer’s disease. Nat Genet. 2013;45(12):1452–8. · DOI · Paper page
- Cagnin A, Brooks DJ, Kennedy AM, Gunn RN, Myers R, Turkheimer FE, et al. In-vivo measurement of activated microglia in dementia. Lancet. 2001;358(9280):461–7. · DOI · Paper page
- Funato H, Yoshimura M, Yamazaki T, Saido TC, Ito Y, Yokofujita J, et al. Astrocytes containing amyloid beta-protein (Abeta)-positive granules are associated with Abeta40-positive diffuse plaques in the aged human brain. Am J Pathol. 1998;152(4):983–92.
- Kamphuis W, Middeldorp J, Kooijman L, Sluijs JA, Kooi EJ, Moeton M, et al. Glial fibrillary acidic protein isoform expression in plaque related astrogliosis in Alzheimer’s disease. Neurobiol Aging. 2014;35(3):492–510. · DOI
- Nagele RG, D’Andrea MR, Lee H, Venkataraman V, Wang HY. Astrocytes accumulate A beta 42 and give rise to astrocytic amyloid plaques in Alzheimer disease brains. Brain Res. 2003;971(2):197–209. · DOI · Paper page
- Senitz D, Reichenbach A, Smith TG Jr. Surface complexity of human neocortical astrocytic cells: changes with development, aging, and dementia. J Hirnforsch. 1995;36(4):531–7.
- Dandrea MR, Reiser PA, Gumula NA, Hertzog BM, Andrade-Gordon P. Application of triple immunohistochemistry to characterize amyloid plaque-associated inflammation in brains with Alzheimer’s disease. Biotech Histochem. 2001;76(2):97–106. · DOI
- Ishizuka K, Kimura T, Igata-yi R, Katsuragi S, Takamatsu J, Miyakawa T. Identification of monocyte chemoattractant protein-1 in senile plaques and reactive microglia of Alzheimer’s disease. Psychiatry Clin Neurosci. 1997;51(3):135–8. · DOI · Paper page
- Shao Y, Gearing M, Mirra SS. Astrocyte-apolipoprotein E associations in senile plaques in Alzheimer disease and vascular lesions: a regional immunohistochemical study. J Neuropathol Exp Neurol. 1997;56(4):376–81. · DOI
- Camp JG, Badsha F, Florio M, Kanton S, Gerber T, Wilsch-Brauninger M, et al. Human cerebral organoids recapitulate gene expression programs of fetal neocortex development. Proc Natl Acad Sci U S A. 2015;112(51):15672–7. · DOI · Paper page
- Abud EM, Ramirez RN, Martinez ES, Healy LM, Nguyen CHH, Newman SA, et al. iPSC-derived human microglia-like cells to study neurological diseases. Neuron. 2017;94(2):278-93.e9. · DOI · Paper page
- Jones VC, Atkinson-Dell R, Verkhratsky A, Mohamet L. Aberrant iPSC-derived human astrocytes in Alzheimer’s disease. Cell Death Dis. 2017;8(3): e2696. · DOI · Paper page
- Konttinen H, Cabral-da-Silva MEC, Ohtonen S, Wojciechowski S, Shakirzyanova A, Caligola S, et al. PSEN1DeltaE9, APPswe, and APOE4 confer disparate phenotypes in human iPSC-derived microglia. Stem Cell Rep. 2019;13(4):669–83. · DOI · Paper page
- Konttinen H, Gureviciene I, Oksanen M, Grubman A, Loppi S, Huuskonen MT, et al. PPARbeta/delta-agonist GW0742 ameliorates dysfunction in fatty acid oxidation in PSEN1DeltaE9 astrocytes. Glia. 2019;67(1):146–59. · DOI
- Guttikonda SR, Sikkema L, Tchieu J, Saurat N, Walsh RM, Harschnitz O, et al. Fully defined human pluripotent stem cell-derived microglia and tri-culture system model C3 production in Alzheimer’s disease. Nat Neurosci. 2021;24(3):343–54. · DOI
- Xu M, Zhang L, Liu G, Jiang N, Zhou W, Zhang Y. Pathological changes in Alzheimer’s disease analyzed using induced pluripotent stem cell-derived human microglia-like cells. J Alzheimers Dis. 2019;67(1):357–68. · DOI · Paper page
- Walsh DM, Thulin E, Minogue AM, Gustavsson N, Pang E, Teplow DB, et al. A facile method for expression and purification of the Alzheimer’s disease-associated amyloid beta-peptide. FEBS J. 2009;276(5):1266–81. · DOI
- Tian C, Liu Q, Ma K, Wang Y, Chen Q, Ambroz R, et al. Characterization of induced neural progenitors from skin fibroblasts by a novel combination of defined factors. Sci Rep. 2013;3:1345. · DOI
- Liddelow SA, Barres BA. Reactive astrocytes: production, function, and therapeutic potential. Immunity. 2017;46(6):957–67. · DOI · Paper page
- Franco-Bocanegra DK, Gourari Y, McAuley C, Chatelet DS, Johnston DA, Nicoll JAR, et al. Microglial morphology in Alzheimer’s disease and after Abeta immunotherapy. Sci Rep. 2021;11(1):15955. · DOI
- Davies DS, Ma J, Jegathees T, Goldsbury C. Microglia show altered morphology and reduced arborization in human brain during aging and Alzheimer’s disease. Brain Pathol. 2017;27(6):795–808. · DOI · Paper page
- Young K, Morrison H. Quantifying microglia morphology from photomicrographs of immunohistochemistry prepared tissue using imageJ. J Vis Exp. 2018;136:e57648.
- Brandenburg LO, Konrad M, Wruck CJ, Koch T, Lucius R, Pufe T. Functional and physical interactions between formyl-peptide-receptors and scavenger receptor MARCO and their involvement in amyloid beta 1–42-induced signal transduction in glial cells. J Neurochem. 2010;113(3):749–60. · DOI
- Xu X, Lei Y, Luo J, Wang J, Zhang S, Yang XJ, et al. Prevention of beta-amyloid induced toxicity in human iPS cell-derived neurons by inhibition of Cyclin-dependent kinases and associated cell cycle events. Stem Cell Res. 2013;10(2):213–27. · DOI
- Ferreira A, Sinjoanu RC, Nicholson A, Kleinschmidt S. Abeta toxicity in primary cultured neurons. Methods Mol Biol. 2011;670:141–53. · DOI
- Veeraraghavalu K, Zhang C, Zhang X, Tanzi RE, Sisodia SS. Age-dependent, non-cell-autonomous deposition of amyloid from synthesis of beta-amyloid by cells other than excitatory neurons. J Neurosci. 2014;34(10):3668–73. · DOI
- Carpenter AF, Carpenter PW, Markesbery WR. Morphometric analysis of microglia in Alzheimer’s disease. J Neuropathol Exp Neurol. 1993;52(6):601–8. · DOI · Paper page
- Beauquis J, Pavia P, Pomilio C, Vinuesa A, Podlutskaya N, Galvan V, et al. Environmental enrichment prevents astroglial pathological changes in the hippocampus of APP transgenic mice, model of Alzheimer’s disease. Exp Neurol. 2013;239:28–37. · DOI · Paper page
- Olabarria M, Noristani HN, Verkhratsky A, Rodriguez JJ. Concomitant astroglial atrophy and astrogliosis in a triple transgenic animal model of Alzheimer’s disease. Glia. 2010;58(7):831–8. · DOI · Paper page
- Escartin C, Guillemaud O, Carrillo-de Sauvage MA. Questions and (some) answers on reactive astrocytes. Glia. 2019;67(12):2221–47. · DOI · Paper page
- Simpson JE, Ince PG, Lace G, Forster G, Shaw PJ, Matthews F, et al. Astrocyte phenotype in relation to Alzheimer-type pathology in the ageing brain. Neurobiol Aging. 2010;31(4):578–90. · DOI · Paper page
- Kashon ML, Ross GW, O'Callaghan JP, Miller DB, Petrovitch H, Burchfiel CM, et al. Associations of cortical astrogliosis with cognitive performance and dementia status. J Alzheimers Dis. 2004;6(6):595–604; discussion 73–81. · DOI
- Griffin WS, Stanley LC, Ling C, White L, MacLeod V, Perrot LJ, et al. Brain interleukin 1 and S-100 immunoreactivity are elevated in Down syndrome and Alzheimer disease. Proc Natl Acad Sci U S A. 1989;86(19):7611–5. · DOI · Paper page
- Mrak RE, Sheng JG, Griffin WS. Correlation of astrocytic S100 beta expression with dystrophic neurites in amyloid plaques of Alzheimer’s disease. J Neuropathol Exp Neurol. 1996;55(3):273–9. · DOI
- Sheng JG, Mrak RE, Griffin WS. S100 beta protein expression in Alzheimer disease: potential role in the pathogenesis of neuritic plaques. J Neurosci Res. 1994;39(4):398–404. · DOI
- Marshak DR, Pesce SA, Stanley LC, Griffin WS. Increased S100 beta neurotrophic activity in Alzheimer’s disease temporal lobe. Neurobiol Aging. 1992;13(1):1–7. · DOI
- Brozzi F, Arcuri C, Giambanco I, Donato R. S100B protein regulates astrocyte shape and migration via interaction with Src kinase: implications for astrocyte development, activation and tumor growth. J Biol Chem. 2009;284(13):8797–811. · DOI
- Torres-Platas SG, Comeau S, Rachalski A, Bo GD, Cruceanu C, Turecki G, et al. Morphometric characterization of microglial phenotypes in human cerebral cortex. J Neuroinflammation. 2014;11:12. · DOI
- Colonna M, Butovsky O. Microglia function in the central nervous system during health and neurodegeneration. Annu Rev Immunol. 2017;35:441–68. · DOI · Paper page
- Salobrar-Garcia E, Rodrigues-Neves AC, Ramirez AI, de Hoz R, Fernandez-Albarral JA, Lopez-Cuenca I, et al. Microglial activation in the retina of a triple-transgenic Alzheimer’s disease mouse model (3xTg-AD). Int J Mol Sci. 2020;21(3):816. · DOI
- Baron R, Babcock AA, Nemirovsky A, Finsen B, Monsonego A. Accelerated microglial pathology is associated with Abeta plaques in mouse models of Alzheimer’s disease. Aging Cell. 2014;13(4):584–95. · DOI · Paper page
- Leyh J, Paeschke S, Mages B, Michalski D, Nowicki M, Bechmann I, et al. Classification of Microglial Morphological Phenotypes Using Machine Learning. Front Cell Neurosci. 2021;15: 701673. · DOI
- Nam H, Lee Y, Kim B, Lee JW, Hwang S, An HK, et al. Presenilin 2 N141I mutation induces hyperactive immune response through the epigenetic repression of REV-ERBalpha. Nat Commun. 2022;13(1):1972. · DOI
- Fung S, Smith CL, Prater KE, Case A, Green K, Osnis L, et al. Early-onset familial Alzheimer disease variant PSEN2 N141I heterozygosity is associated with altered microglia phenotype. J Alzheimers Dis. 2020;77(2):675–88. · DOI
- Heppner FL, Ransohoff RM, Becher B. Immune attack: the role of inflammation in Alzheimer disease. Nat Rev Neurosci. 2015;16(6):358–72. · DOI · Paper page
- Grehan S, Tse E, Taylor JM. Two distal downstream enhancers direct expression of the human apolipoprotein E gene to astrocytes in the brain. J Neurosci. 2001;21(3):812–22. · DOI · Paper page
- Liu CC, Liu CC, Kanekiyo T, Xu H, Bu G. Apolipoprotein E and Alzheimer disease: risk, mechanisms and therapy. Nat Rev Neurol. 2013;9(2):106–18. · DOI · Paper page
- Corder EH, Saunders AM, Strittmatter WJ, Schmechel DE, Gaskell PC, Small GW, et al. Gene dose of apolipoprotein E type 4 allele and the risk of Alzheimer’s disease in late onset families. Science. 1993;261(5123):921–3. · DOI · Paper page
- den Hartigh LJ, Altman R, Hutchinson R, Petrlova J, Budamagunta MS, Tetali SD, et al. Postprandial apoE isoform and conformational changes associated with VLDL lipolysis products modulate monocyte inflammation. PLoS ONE. 2012;7(11): e50513. · DOI
- Hatters DM, Budamagunta MS, Voss JC, Weisgraber KH. Modulation of apolipoprotein E structure by domain interaction: differences in lipid-bound and lipid-free forms. J Biol Chem. 2005;280(40):34288–95. · DOI · Paper page
- Maezawa I, Maeda N, Montine TJ, Montine KS. Apolipoprotein E-specific innate immune response in astrocytes from targeted replacement mice. J Neuroinflammation. 2006;3:10. · DOI
- Ophir G, Meilin S, Efrati M, Chapman J, Karussis D, Roses A, et al. Human apoE3 but not apoE4 rescues impaired astrocyte activation in apoE null mice. Neurobiol Dis. 2003;12(1):56–64. · DOI
- Fraga VG, Magalhaes CA, Loures CMG, de Souza LC, Guimaraes HC, Zauli DAG, et al. Inflammatory and pro-resolving mediators in frontotemporal dementia and Alzheimer’s disease. Neuroscience. 2019;421:123–35. · DOI
- Ehrlich LC, Hu S, Sheng WS, Sutton RL, Rockswold GL, Peterson PK, et al. Cytokine regulation of human microglial cell IL-8 production. J Immunol. 1998;160(4):1944–8. · DOI
- Araujo DM, Cotman CW. Trophic effects of interleukin-4, -7 and -8 on hippocampal neuronal cultures: potential involvement of glial-derived factors. Brain Res. 1993;600(1):49–55. · DOI
- Verbeek MM, Otte-Holler I, Westphal JR, Wesseling P, Ruiter DJ, de Waal RM. Accumulation of intercellular adhesion molecule-1 in senile plaques in brain tissue of patients with Alzheimer’s disease. Am J Pathol. 1994;144(1):104–16.
- Rozemuller JM, Eikelenboom P, Pals ST, Stam FC. Microglial cells around amyloid plaques in Alzheimer’s disease express leucocyte adhesion molecules of the LFA-1 family. Neurosci Lett. 1989;101(3):288–92. · DOI
- Noe CR, Noe-Letschnig M, Handschuh P, Noe CA, Lanzenberger R. Dysfunction of the Blood-Brain Barrier-A Key Step in Neurodegeneration and Dementia. Front Aging Neurosci. 2020;12:185. · DOI
- Nielsen HM, Londos E, Minthon L, Janciauskiene SM. Soluble adhesion molecules and angiotensin-converting enzyme in dementia. Neurobiol Dis. 2007;26(1):27–35. · DOI · Paper page
- Clark PR, Manes TD, Pober JS, Kluger MS. Increased ICAM-1 expression causes endothelial cell leakiness, cytoskeletal reorganization and junctional alterations. J Invest Dermatol. 2007;127(4):762–74. · DOI
- Rentzos M, Michalopoulou M, Nikolaou C, Cambouri C, Rombos A, Dimitrakopoulos A, et al. The role of soluble intercellular adhesion molecules in neurodegenerative disorders. J Neurol Sci. 2005;228(2):129–35. · DOI · Paper page
- Janelidze S, Mattsson N, Stomrud E, Lindberg O, Palmqvist S, Zetterberg H, et al. CSF biomarkers of neuroinflammation and cerebrovascular dysfunction in early Alzheimer disease. Neurology. 2018;91(9):e867–77. · DOI · Paper page
- Perez-Nievas BG, Johnson L, Beltran-Lobo P, Hughes MM, Gammallieri L, Tarsitano F, et al. Astrocytic C-X-C motif chemokine ligand-1 mediates beta-amyloid-induced synaptotoxicity. J Neuroinflammation. 2021;18(1):306. · DOI
- Prinz M, Hanisch UK. Murine microglial cells produce and respond to interleukin-18. J Neurochem. 1999;72(5):2215–8. · DOI
- Nasiri E, Sankowski R, Dietrich H, Oikonomidi A, Huerta PT, Popp J, et al. Key role of MIF-related neuroinflammation in neurodegeneration and cognitive impairment in Alzheimer’s disease. Mol Med. 2020;26(1):34. · DOI · Paper page
- Ojala J, Alafuzoff I, Herukka SK, van Groen T, Tanila H, Pirttila T. Expression of interleukin-18 is increased in the brains of Alzheimer’s disease patients. Neurobiol Aging. 2009;30(2):198–209. · DOI · Paper page
- Monaco G, van Dam S, Casal Novo Ribeiro JL, Larbi A, de Magalhaes JP. A comparison of human and mouse gene co-expression networks reveals conservation and divergence at the tissue, pathway and disease levels. BMC Evol Biol. 2015;15:259. · DOI
- Mawuenyega KG, Sigurdson W, Ovod V, Munsell L, Kasten T, Morris JC, et al. Decreased clearance of CNS beta-amyloid in Alzheimer’s disease. Science. 2010;330(6012):1774. · DOI · Paper page
- Reich M, Paris I, Ebeling M, Dahm N, Schweitzer C, Reinhardt D, et al. Alzheimer’s risk gene TREM2 determines functional properties of new type of human iPSC-derived microglia. Front Immunol. 2020;11: 617860. · DOI · Paper page
Cited by
Sorted by citations
Penning, A., Snoeck, S., Ormaechea, O. R., Ayyildiz, D., Polzer, O., Buitrago-Arango, M., Capobianco, R., de Winter, F., Balusu, S., Verhaagen, J., et al. (2026) · Acta Neuropathologica Communications · doi:10.1186/s40478-026-02228-8 · Cited by 6
Metadata
- Authors
- Sullivan, M. A., Lane, S. D., McKenzie, A. D. J., Ball, S. R., Sunde, M., Neely, G. G., Moreno, C. L., Maximova, A., Werry, E. L., & Kassiou, M.
- Venue
- Journal of Neuroinflammation
- Published
- 2024-01-04
- Volume
- 21
- Issue
- 1
- ISSN
- 1742-2094
- PMC
- PMC10765839
- Cited by
- 23
- References
- 20
- Language
- en
- Funders
- National Health and Medical Research Council (Program Grant (APP1132524), Principal Research Fellowship (APP1154692))
About these checks
Registry, retraction, Cites and statistics results are computed, not judged, with one exception: a printed reference that no index lists is read once by a model before it counts as a citation error. Claims are extracted by a model and kept only when their quote appears verbatim in the text; each cited source is then checked, with a model’s help, for whether it says what the claim relies on. Those verdicts can be wrong — read the claim’s quote and the cited source before relying on one.
Statistics and arithmetic are recomputed, not judged.
Confidence bands are shown only for fields calibrated on our annotated test set. None is calibrated yet, so no band is shown.
What counts as a claim ›How we measure confidence ›How we check this ›
Are you an author, or do you see a problem with this page? Request a review
