Cited by 113Alzheimer's disease research and treatmentsNeuroinflammation and Neurodegeneration MechanismsNeurological Disease Mechanisms and Treatments

The DOI matches its Crossref record; 55 of the 55 references it cites were found in a registry or an index.

CX3CR1 deficiency aggravates amyloid driven neuronal pathology and cognitive decline in Alzheimer’s disease

Open access

Abstract

Background: Despite its identification as a key checkpoint regulator of microglial activation in Alzheimer’s disease, the overarching role of CX3CR1 signaling in modulating mechanisms of Aβ driven neurodegeneration, including accumulation of hyperphosphorylated tau is not well understood. Methodology: Accumulation of soluble and insoluble Aβ species, microglial activation, synaptic dysregulation, and neurodegeneration is investigated in 4- and 6-month old 5xFAD;Cx3cr1+/+ and 5xFAD;Cx3cr1−/− mice using immunohistochemistry, western blotting, transcriptomic and quantitative real time PCR analyses of purified microglia. Flow cytometry based, in-vivo Aβ uptake assays are used for characterization of the effects of CX3CR1-signaling on microglial phagocytosis and lysosomal acidification as indicators of clearance of methoxy-X-04+ fibrillar Aβ. Lastly, we use Y-maze testing to analyze the effects of Cx3cr1 deficiency on working memory. Results: Disease progression in 5xFAD;Cx3cr1−/− mice is characterized by increased deposition of filamentous plaques that display defective microglial plaque engagement. Microglial Aβ phagocytosis and lysosomal acidification in 5xFAD;Cx3cr1−/− mice is impaired in-vivo. Interestingly, Cx3cr1 deficiency results in heighted accumulation of neurotoxic, oligomeric Aβ, along with severe neuritic dystrophy, preferential loss of post-synaptic densities, exacerbated tau pathology, neuronal loss and cognitive impairment. Transcriptomic analyses using cortical RNA, coupled with qRT-PCR using purified microglia from 6 month-old mice indicate dysregulated TGFβ-signaling and heightened ROS metabolism in 5xFAD;Cx3cr1−/− mice. Lastly, microglia in 6 month-old 5xFAD;Cx3cr1−/− mice express a ‘degenerative’ phenotype characterized by increased levels of Ccl2, Ccl5, Il-1β, Pten and Cybb along with reduced Tnf, Il-6 and Tgfβ1 mRNA. Conclusions: Cx3cr1 deficiency impairs microglial uptake and degradation of fibrillar Aβ, thereby triggering increased accumulation of neurotoxic Aβ species. Furthermore, loss of Cx3cr1 results in microglial dysfunction typified by dampened TGFβ-signaling, increased oxidative stress responses and dysregulated pro-inflammatory activation. Our results indicate that Aβ-driven microglial dysfunction in Cx3cr1−/− mice aggravates tau hyperphosphorylation, neurodegeneration, synaptic dysregulation and impairs working memory.

Overview

The claims and statistics of this paper haven’t been checked yet.

Run the check — free, no account needed. It reads the open-access text and checks the sources it cites.

A few free checks a day · papers already verified open instantly · results are public

Integrity signals

Registry

Crossref · 10.1186/s13024-022-00545-9

Cites

55 of 55 references verified0 citation errors · 0 not checkable

Statistics

Figures

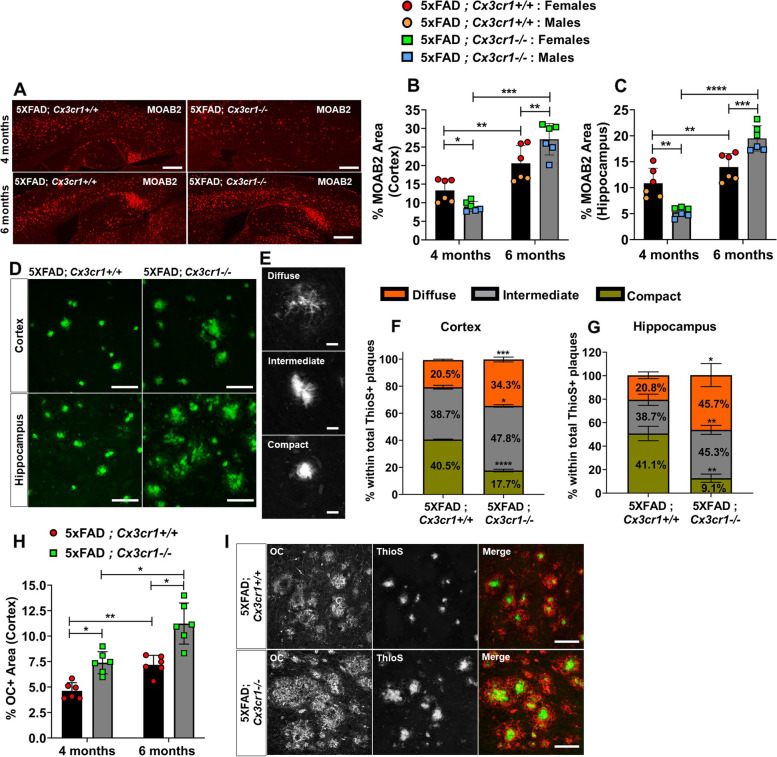
Fig. 1 Accelerated plaque deposition in 5xFAD mice deficient in Cx3cr1. (A) Accumulation of MOAB2+ Aβ42 plaques in (top panels) 4 month-old vs. (bottom panels) 6 month-old 5xFAD;Cx3cr1+/+ and 5xFAD; Cx3cr1−/− mice. Scale bars = 500 μm. Quantification of %MOAB2+ areas in the (B) cortex and (C) hippocampus of 4 and 6 month-old 5xFAD;Cx3cr1+/+ (black bars) and 5xFAD;Cx3cr1−/− (grey bars) mice. Data in B,C represent mean proportions of cortical and hippocampal MOAB2+ areas quantified using n = 6 animals (3 females, 3 males) per genotype, per time-point. Error bars represent SEM. Statistical analysis done using two-way ANOVA (pint cortex < 0.0001, pint hippocampus < 0.0001) followed by Tukey’s post hoc tests. (D) ThioS+ plaques visualized in the (top panels) cortex and (bottom panels) hippocampus of 6 month-old 5xFAD mice with and without Cx3cr1. Scale bars = 50 µm. (E) Identification of morphologically distinct ThioS+ plaques based on circularity scores as follows – Diffuse: Circularity = 0.00–0.14, Intermediate: Circularity = 0.15–0.28, Compact: Circularity = > 0.30. Scale bars = 30 µm. Proportion of ThioS+ plaques with diffuse (orange), intermediate (grey) and compact (green) circularities were quantified in the (F) cortex (G) hippocampus of 6 month-old 5xFAD;Cx3cr1+/+ and 5xFAD;Cx3cr1−/− mice. Data in F,G represent mean proportions of each plaque type quantified using 6 mice (3 females, 3 males) per genotype at each age. Circularity analysis was based on 250–300 cortical plaques and 100–150 hippocampal plaques per animal, per genotype at each age. Error bars represent SEM. Statistical analysis done using two-way ANOVA (pint cortex and pint hippocampus = 0.0002) followed by Tukey’s post hoc tests. (H) Quantification of cortical area occupied by OC+ oAβ in 4- and 6-month-old 5xFAD;Cx3cr1+/+ (black bars) and 5xFAD;Cx3cr1−/− (grey bars) mice. Data represents mean proportion of OC+ cortical area quantified using n = 6 (3 females, 3 males) of each genotype at each age. Statistical analysis done using two-way ANOVA (pint = 0.03) followed by Tukey’s post hoc tests. (I) Accumulation of soluble OC+ oAβ around ThioS+ plaques in 6 month-old 5xFAD;Cx3cr1+/+ and 5xFAD;Cx3cr1.−/− mice. Scale bars = 100 μm. *p < 0.01, **p < 0.001, ***p < 0.0001. ****p < 0.00001. All histology data representative of n = 6 mice (3 females, 3males) per genotype at each age analyzed
Fig. 1 Accelerated plaque deposition in 5xFAD mice deficient in Cx3cr1. (A) Accumulation of MOAB2+ Aβ42 plaques in (top panels) 4 month-old vs. (bottom panels) 6 month-old 5xFAD;Cx3cr1+/+ and 5xFAD; Cx3cr1−/− mice. Scale bars = 500 μm. Quantification of %MOAB2+ areas in the (B) cortex and (C) hippocampus of 4 and 6 month-old 5xFAD;Cx3cr1+/+ (black bars) and 5xFAD;Cx3cr1−/− (grey bars) mice. Data in B,C represent mean proportions of cortical and hippocampal MOAB2+ areas quantified using n = 6 animals (3 females, 3 males) per genotype, per time-point. Error bars represent SEM. Statistical analysis done using two-way ANOVA (pint cortex < 0.0001, pint hippocampus < 0.0001) followed by Tukey’s post hoc tests. (D) ThioS+ plaques visualized in the (top panels) cortex and (bottom panels) hippocampus of 6 month-old 5xFAD mice with and without Cx3cr1. Scale bars = 50 µm. (E) Identification of morphologically distinct ThioS+ plaques based on circularity scores as follows – Diffuse: Circularity = 0.00–0.14, Intermediate: Circularity = 0.15–0.28, Compact: Circularity = > 0.30. Scale bars = 30 µm. Proportion of ThioS+ plaques with diffuse (orange), intermediate (grey) and compact (green) circularities were quantified in the (F) cortex (G) hippocampus of 6 month-old 5xFAD;Cx3cr1+/+ and 5xFAD;Cx3cr1−/− mice. Data in F,G represent mean proportions of each plaque type quantified using 6 mice (3 females, 3 males) per genotype at each age. Circularity analysis was based on 250–300 cortical plaques and 100–150 hippocampal plaques per animal, per genotype at each age. Error bars represent SEM. Statistical analysis done using two-way ANOVA (pint cortex and pint hippocampus = 0.0002) followed by Tukey’s post hoc tests. (H) Quantification of cortical area occupied by OC+ oAβ in 4- and 6-month-old 5xFAD;Cx3cr1+/+ (black bars) and 5xFAD;Cx3cr1−/− (grey bars) mice. Data represents mean proportion of OC+ cortical area quantified using n = 6 (3 females, 3 males) of each genotype at each age. Statistical analysis done using two-way ANOVA (pint = 0.03) followed by Tukey’s post hoc tests. (I) Accumulation of soluble OC+ oAβ around ThioS+ plaques in 6 month-old 5xFAD;Cx3cr1+/+ and 5xFAD;Cx3cr1.−/− mice. Scale bars = 100 μm. *p < 0.01, **p < 0.001, ***p < 0.0001. ****p < 0.00001. All histology data representative of n = 6 mice (3 females, 3males) per genotype at each age analyzedCC BY · PubMed Central
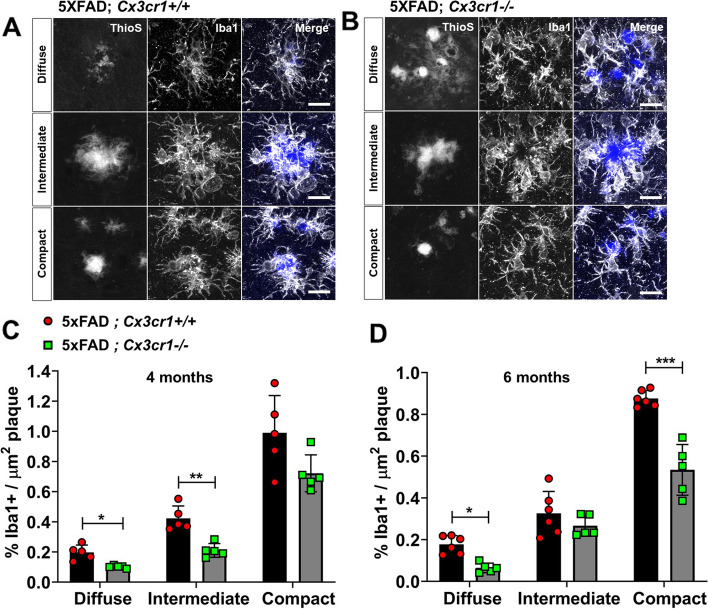
Fig. 2 Impaired microglial plaque engagement in 4- and 6-month old 5xFAD mice deficient in Cx3cr1. Co-labeling of ThioS+ plaques and Iba1+ microglia in the cortex of 6 month-old (A) 5xFAD;Cx3cr1+/+ and (B) 5xFAD;Cx3cr1−/− mice. Images representative of cortical plaques visualized using 6 mice (3 females, 3 males) per genotype. Scale bars = 30 µm. Iba1 occupancy of the area within regions-of-interest (ROI) traced along the boundaries of diffuse, intermediate, and compact plaques calculated for plaques in the cortex of (C) 4 month-old and (D) 6 month-old 5xFAD;Cx3cr1+/+ (black bars) and 5xFAD;Cx3cr1−/− (grey bars) mice. Data in C,D represent the mean %Iba1+ area calculated within ROIs defined around cortical plaques in 4- and 6-month old 5xFAD mice with and without Cx3cr1 (n = 5–6 female and male mice of each genotype, per age). Error bars represent SEM. ~ 250–350 plaques were analyzed using multiple sections for each animal/genotype at each age. Statistical analysis done using Two-way ANOVA (pint 4 month < 0.005, p.int 6 month = 0.0002) followed by Sidak’s post hoc tests. ***p < 0.0001, **p < 0.001, *p < 0.01
Fig. 2 Impaired microglial plaque engagement in 4- and 6-month old 5xFAD mice deficient in Cx3cr1. Co-labeling of ThioS+ plaques and Iba1+ microglia in the cortex of 6 month-old (A) 5xFAD;Cx3cr1+/+ and (B) 5xFAD;Cx3cr1−/− mice. Images representative of cortical plaques visualized using 6 mice (3 females, 3 males) per genotype. Scale bars = 30 µm. Iba1 occupancy of the area within regions-of-interest (ROI) traced along the boundaries of diffuse, intermediate, and compact plaques calculated for plaques in the cortex of (C) 4 month-old and (D) 6 month-old 5xFAD;Cx3cr1+/+ (black bars) and 5xFAD;Cx3cr1−/− (grey bars) mice. Data in C,D represent the mean %Iba1+ area calculated within ROIs defined around cortical plaques in 4- and 6-month old 5xFAD mice with and without Cx3cr1 (n = 5–6 female and male mice of each genotype, per age). Error bars represent SEM. ~ 250–350 plaques were analyzed using multiple sections for each animal/genotype at each age. Statistical analysis done using Two-way ANOVA (pint 4 month < 0.005, p.int 6 month = 0.0002) followed by Sidak’s post hoc tests. ***p < 0.0001, **p < 0.001, *p < 0.01CC BY · PubMed Central
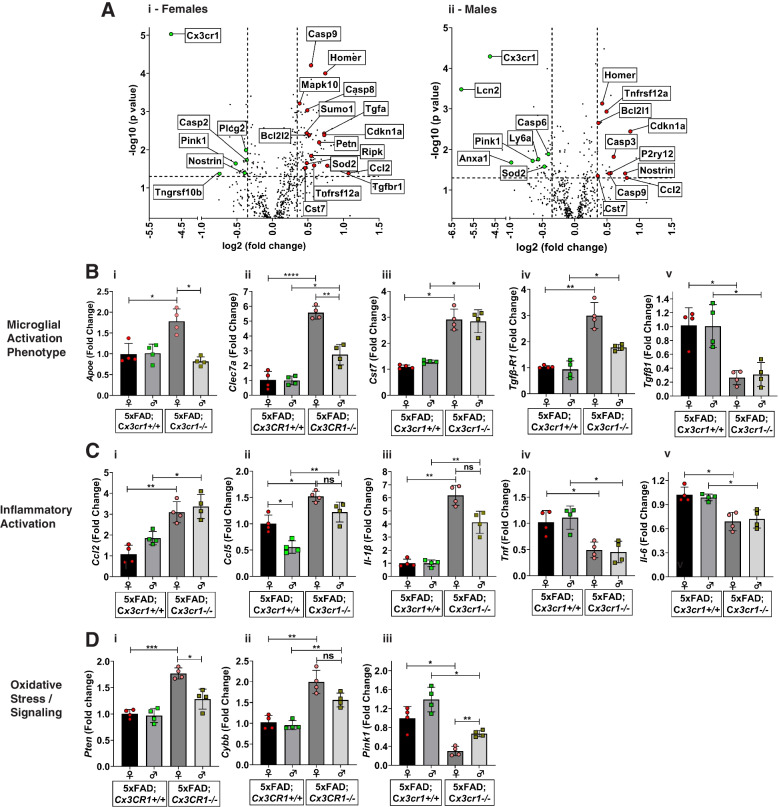
Fig. 3 Dysregulation of microglial activation in the absence of Cx3cr1. (A) Volcano plots showing significant differentially expressed genes (DEGs) identified based on the Nanostring neuroinflammation panel to analyze cortical lysates from (i) 6 month-old female and (ii) 6 month-old male 5xFAD;Cx3cr1−/− mice when compared to sex-matched 5xFAD;Cx3cr1+/+ animals. (B-D) Quantitative real-time PCR (qRT-PCR) analyses performed on CD11b+ microglia purified from brains of 6 month-old 5xFAD;Cx3cr1+/+ and 5xFAD;Cx3cr1−/− mice to validate top DEGs from Nanostring analysis. Gene-expression associated with (Bi-Bv) Disease-associated microglial activation, (Ci-Cv) inflammatory activation and (Di-Diii) oxidative stress responses analyzed using purified microglia from 5xFAD mice with and without Cx3cr1. All gene-expression data are represented as fold-change compared to microglia isolated from female 5xFAD;Cx3cr1+/+ mice (black bars). Data in B-D represent mean ddCT values using 8 mice (4 females, 4 males) per genotype. Error bars represent SEM. Statistics done One-way ANOVA followed by Brown-Forsythe and Welch post-hoc tests. *padj < 0.05, **padj < 0.001, ***padj < 0.0001, ****p.adj < 0.00001
Fig. 3 Dysregulation of microglial activation in the absence of Cx3cr1. (A) Volcano plots showing significant differentially expressed genes (DEGs) identified based on the Nanostring neuroinflammation panel to analyze cortical lysates from (i) 6 month-old female and (ii) 6 month-old male 5xFAD;Cx3cr1−/− mice when compared to sex-matched 5xFAD;Cx3cr1+/+ animals. (B-D) Quantitative real-time PCR (qRT-PCR) analyses performed on CD11b+ microglia purified from brains of 6 month-old 5xFAD;Cx3cr1+/+ and 5xFAD;Cx3cr1−/− mice to validate top DEGs from Nanostring analysis. Gene-expression associated with (Bi-Bv) Disease-associated microglial activation, (Ci-Cv) inflammatory activation and (Di-Diii) oxidative stress responses analyzed using purified microglia from 5xFAD mice with and without Cx3cr1. All gene-expression data are represented as fold-change compared to microglia isolated from female 5xFAD;Cx3cr1+/+ mice (black bars). Data in B-D represent mean ddCT values using 8 mice (4 females, 4 males) per genotype. Error bars represent SEM. Statistics done One-way ANOVA followed by Brown-Forsythe and Welch post-hoc tests. *padj < 0.05, **padj < 0.001, ***padj < 0.0001, ****p.adj < 0.00001CC BY · PubMed Central
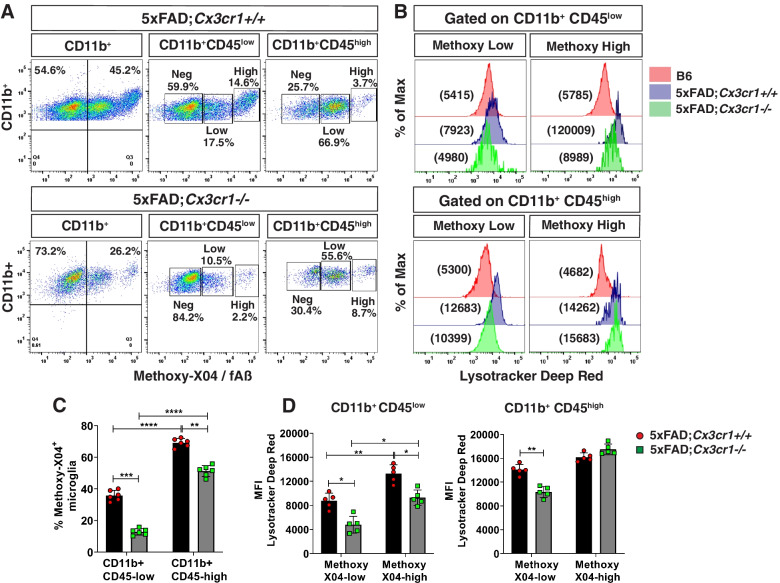
Fig. 4 Impaired uptake of fAβ and lysosomal acidification in 6 month-old 5xFAD;Cx3cr1−/− mice. (A) Representative flow cytometry plots identifying subpopulations of methoxy-X04+CD11b+CD45low and methoxy-X04+CD11b+CD45high microglia and (B) mean fluorescence intensities (MFI) for Lysotracker Deep-Red™ (-DR) to assess the acidification of endolytic compartments of these individual subpopulations. Data representative of flow cytometry experiments done using n = 5–6 mice (males and females) of 6 month-old 5xFAD;Cx3cr1+/+ and 5xFAD;Cx3cr1−/− mice. Quantification of (C) proportion of methoxy-X04+CD11b+CD45low and methoxy-X04+CD11b+CD45high microglia and (D) Lysotracker-DR MFIs for methoxy-X04low and methoxy-X04high microglia within the CD11b+CD45low and CD11b+CD45high subsets in 6 month-old 5xFAD;Cx3cr1+/+ (black bars) and 5xFAD;Cx3cr1.−/− (grey bars) mice. Data in C,D represents means calculated using n = 5–6 mice (males and females) per genotype. Error bars represent SEM. All animals were processed and analyzed in a single experiment to enable MFI comparisons across genotypes and individual mice. Statistics for data in C,D was done using two-way ANOVA with Tukey’s multiple comparison tests. *p < 0.05, **p < 0.001, ***p < 0.0001, ****p < 0.00001
Fig. 4 Impaired uptake of fAβ and lysosomal acidification in 6 month-old 5xFAD;Cx3cr1−/− mice. (A) Representative flow cytometry plots identifying subpopulations of methoxy-X04+CD11b+CD45low and methoxy-X04+CD11b+CD45high microglia and (B) mean fluorescence intensities (MFI) for Lysotracker Deep-Red™ (-DR) to assess the acidification of endolytic compartments of these individual subpopulations. Data representative of flow cytometry experiments done using n = 5–6 mice (males and females) of 6 month-old 5xFAD;Cx3cr1+/+ and 5xFAD;Cx3cr1−/− mice. Quantification of (C) proportion of methoxy-X04+CD11b+CD45low and methoxy-X04+CD11b+CD45high microglia and (D) Lysotracker-DR MFIs for methoxy-X04low and methoxy-X04high microglia within the CD11b+CD45low and CD11b+CD45high subsets in 6 month-old 5xFAD;Cx3cr1+/+ (black bars) and 5xFAD;Cx3cr1.−/− (grey bars) mice. Data in C,D represents means calculated using n = 5–6 mice (males and females) per genotype. Error bars represent SEM. All animals were processed and analyzed in a single experiment to enable MFI comparisons across genotypes and individual mice. Statistics for data in C,D was done using two-way ANOVA with Tukey’s multiple comparison tests. *p < 0.05, **p < 0.001, ***p < 0.0001, ****p < 0.00001CC BY · PubMed Central
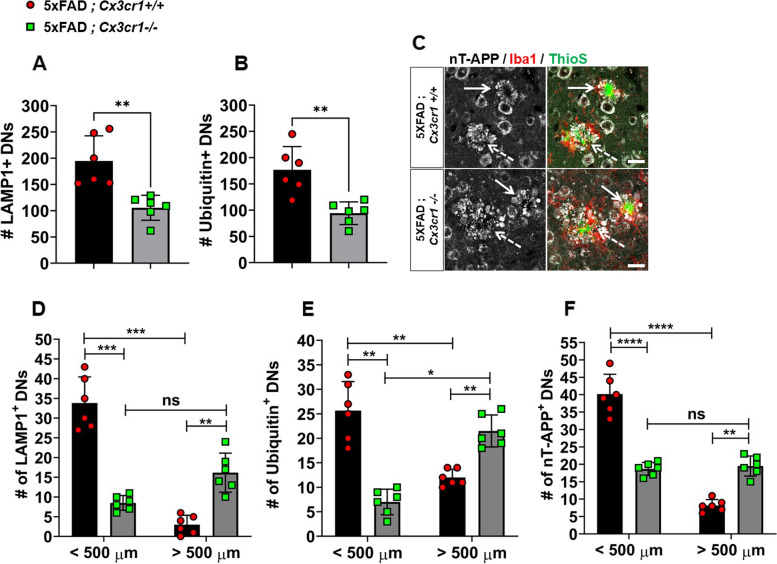
Fig. 5 Early accumulation of larger foci of severe neuritic dystrophy in 4 month-old 5xFAD;Cx3cr1−/− mice. Characterization of cortical dystrophic neurites (DNs) in 4 month-old 5xFAD mice with and without Cx3cr1 using α-LAMP1, α-Ubiquitin and α-nT-APP antibodies. Quantification of (A) LAMP-1+ and (B) Ubiquitin+ DNs in 5xFAD;Cx3cr1+/+ (black bars) and 5xFAD;Cx3cr1−/− (grey bars) mice. Error bars represent SEM. Statistical analysis done using two-tailed, standard Student t test with Welch’s correction for unequal SDs. ** p < 0.005 (C) nT-APP+ neurites (grey) associated with (solid arrows) compact vs. (dashed arrows) diffuse ThioS+ plaques (green) in the cortex of 4 month-old (top panels) 5xFAD;Cx3cr1+/+ and (bottom panels) 5xFAD;Cx3cr1−/− mice. Scale bar = 30 µm. Quantification of (D) LAMP1+, (E) Ubiquitin1+ and (F) nT-APP+ DNs in the cortex of 5xFAD;Cx3cr1+/+ (black bars) and 5xFAD;Cx3cr1−/− (grey bars) mice based on their size distribution at 4 months of age. < 500 µm = 50-500 µm, > 500 µm = 550-1000 µm. Data represents mean cortical DN abundance calculated using multiple sections from n = 6 mice (3 females, 3 males) of each genotype. Statistics done using two-way ANOVA (p.int LAMP1, Ubiquitin-1 and nT-APP < 0.0001) with Tukey’s post-hoc tests.**p < 0.001, ***p < 0.0001, ****p < 0.00001, ns = not significant
Fig. 5 Early accumulation of larger foci of severe neuritic dystrophy in 4 month-old 5xFAD;Cx3cr1−/− mice. Characterization of cortical dystrophic neurites (DNs) in 4 month-old 5xFAD mice with and without Cx3cr1 using α-LAMP1, α-Ubiquitin and α-nT-APP antibodies. Quantification of (A) LAMP-1+ and (B) Ubiquitin+ DNs in 5xFAD;Cx3cr1+/+ (black bars) and 5xFAD;Cx3cr1−/− (grey bars) mice. Error bars represent SEM. Statistical analysis done using two-tailed, standard Student t test with Welch’s correction for unequal SDs. ** p < 0.005 (C) nT-APP+ neurites (grey) associated with (solid arrows) compact vs. (dashed arrows) diffuse ThioS+ plaques (green) in the cortex of 4 month-old (top panels) 5xFAD;Cx3cr1+/+ and (bottom panels) 5xFAD;Cx3cr1−/− mice. Scale bar = 30 µm. Quantification of (D) LAMP1+, (E) Ubiquitin1+ and (F) nT-APP+ DNs in the cortex of 5xFAD;Cx3cr1+/+ (black bars) and 5xFAD;Cx3cr1−/− (grey bars) mice based on their size distribution at 4 months of age. < 500 µm = 50-500 µm, > 500 µm = 550-1000 µm. Data represents mean cortical DN abundance calculated using multiple sections from n = 6 mice (3 females, 3 males) of each genotype. Statistics done using two-way ANOVA (p.int LAMP1, Ubiquitin-1 and nT-APP < 0.0001) with Tukey’s post-hoc tests.**p < 0.001, ***p < 0.0001, ****p < 0.00001, ns = not significantCC BY · PubMed Central
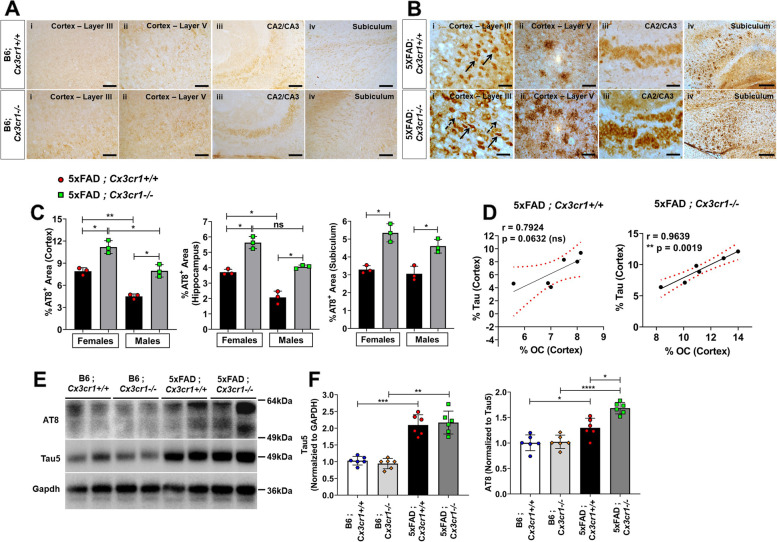
Fig. 6 Aggravated MAPT pathology in 6 month-old 5xFAD;Cx3cr1−/− mice. Distribution of AT8+ pTau in 6 month-old (A) B6;Cx3cr1+/+, B6;Cx3cr1−/− and (B) 5xFAD;Cx3cr1+/+, 5xFAD;Cx3cr1−/− mice. α-AT8 was used to label (6B-i) neuronal (solid arrows) and axonal (dashed arrows) pathology in cortical layer III, (6B-ii) dystrophic neurites in cortical layer V, (6B-iii) neuronal inclusions in CA2/3 and (6B-iv) neuritic plaques in the subiculum of 6 month old (top panels) 5xFAD;Cx3cr1+/+ and (bottom panels) 5xFAD;Cx3cr1−/− mice. Images representative of pTau pathology in n = 6 mice (3 females, 3 males) in each genotype. Scale bars in A,B(i)-A(iii) = 50 µm. Scale bars in A,B(iv) = 100 µm. (C) Quantification of %AT8+ areas in the cortex, hippocampus, and subiculum of 6 month-old 5xFAD;Cx3cr1+/+ (black bars) and 5xFAD;Cx3cr1−/− mice (grey bars). Data represents histological analyses performed using multiple, serial sections from n = 6 mice (3 females, 3 males), of each genotype. Error bars in C represent SEM. Statistical analysis for done using One-way Anova followed by Brown-Forsythe and Welch’s post-hoc tests. *padj < 0.01, **padj < 0.002. (D) Pearson’s Correlation analysis between %AT8+ Tau and %OC+ oAβ in cortices of 6 month-old 5xFAD;Cx3cr1+/+ and 5xFAD;Cx3cr1−/− mice. (E) Western blot analyses to quantify the levels of soluble AT8+ pTau in the cortex of 6 month old 5xFAD;Cx3cr1+/+, 5xFAD;Cx3cr1−/− and their genotype matched B6 controls. Blots representative of n = 6 (3 females, 3 males) per genotype. (F) Densitometric analysis to quantify fold changes in Tau5+ (total tau) and AT8+ (pTau) in the cortex of 6 month-old B6;Cx3cr1+/+ (white bars), B6;Cx3cr1−/− (light grey bars), 5xFAD;Cx3cr1+/+ (black bars) and 5xFAD;Cx3cr1−/− (dark grey bars) mice. Data for AT8 represents fold change in AT8 normalized to total tau levels. Error bars represent SEM. Statistical analysis for done using One-way Anova followed by Brown-Forsythe and Welch’s post-hoc tests. *padj < 0.01, **padj < 0.002, ***padj = 0.0002, ****p.adj < 0.0001
Fig. 6 Aggravated MAPT pathology in 6 month-old 5xFAD;Cx3cr1−/− mice. Distribution of AT8+ pTau in 6 month-old (A) B6;Cx3cr1+/+, B6;Cx3cr1−/− and (B) 5xFAD;Cx3cr1+/+, 5xFAD;Cx3cr1−/− mice. α-AT8 was used to label (6B-i) neuronal (solid arrows) and axonal (dashed arrows) pathology in cortical layer III, (6B-ii) dystrophic neurites in cortical layer V, (6B-iii) neuronal inclusions in CA2/3 and (6B-iv) neuritic plaques in the subiculum of 6 month old (top panels) 5xFAD;Cx3cr1+/+ and (bottom panels) 5xFAD;Cx3cr1−/− mice. Images representative of pTau pathology in n = 6 mice (3 females, 3 males) in each genotype. Scale bars in A,B(i)-A(iii) = 50 µm. Scale bars in A,B(iv) = 100 µm. (C) Quantification of %AT8+ areas in the cortex, hippocampus, and subiculum of 6 month-old 5xFAD;Cx3cr1+/+ (black bars) and 5xFAD;Cx3cr1−/− mice (grey bars). Data represents histological analyses performed using multiple, serial sections from n = 6 mice (3 females, 3 males), of each genotype. Error bars in C represent SEM. Statistical analysis for done using One-way Anova followed by Brown-Forsythe and Welch’s post-hoc tests. *padj < 0.01, **padj < 0.002. (D) Pearson’s Correlation analysis between %AT8+ Tau and %OC+ oAβ in cortices of 6 month-old 5xFAD;Cx3cr1+/+ and 5xFAD;Cx3cr1−/− mice. (E) Western blot analyses to quantify the levels of soluble AT8+ pTau in the cortex of 6 month old 5xFAD;Cx3cr1+/+, 5xFAD;Cx3cr1−/− and their genotype matched B6 controls. Blots representative of n = 6 (3 females, 3 males) per genotype. (F) Densitometric analysis to quantify fold changes in Tau5+ (total tau) and AT8+ (pTau) in the cortex of 6 month-old B6;Cx3cr1+/+ (white bars), B6;Cx3cr1−/− (light grey bars), 5xFAD;Cx3cr1+/+ (black bars) and 5xFAD;Cx3cr1−/− (dark grey bars) mice. Data for AT8 represents fold change in AT8 normalized to total tau levels. Error bars represent SEM. Statistical analysis for done using One-way Anova followed by Brown-Forsythe and Welch’s post-hoc tests. *padj < 0.01, **padj < 0.002, ***padj = 0.0002, ****p.adj < 0.0001CC BY · PubMed Central
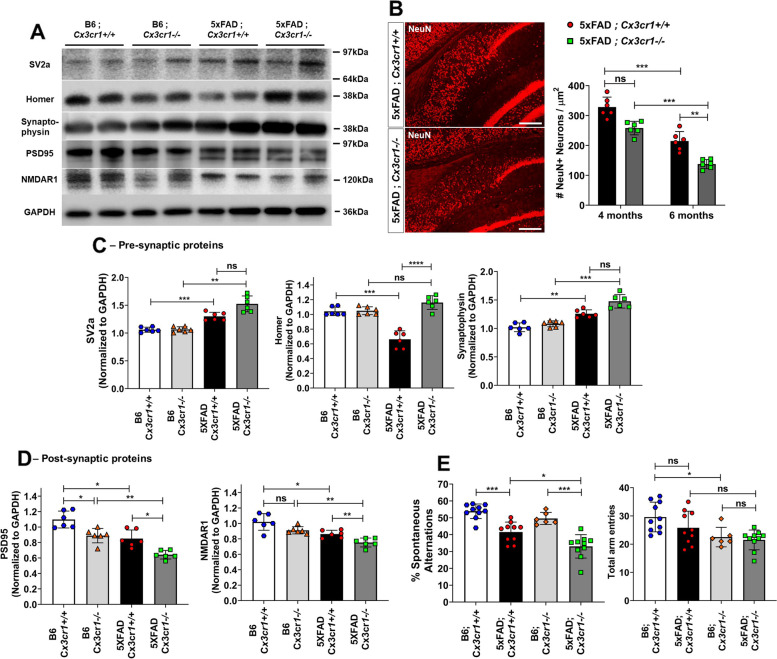
Fig. 7 Aggravated synaptic dysfunction, neuronal loss and cognitive decline in the absence of Cx3cr1. (A) Representative western blots to assess the levels of pre-synaptic proteins—Synaptic Vesicle Protein-2 (SV2a), Synaptophysin and Homer, and post-synaptic proteins—Post-Synaptic Density-19 (PSD19) and NMDA Receptor subunit 1 (NR1) in cortical lysates of 6 month-old 5xFAD;Cx3cr1+/+ and 5xFAD;Cx3cr1−/− mice and their genotype matched controls. Blots representative of n = 6 (3 females, 3 males) per genotype. (B) Visualization and quantitation of NeuN+ neuronal abundance in the subiculum of 4- and 6 month-old 5xFAD;Cx3cr1+/+ (black bars) and 5xFAD;Cx3cr1−/− mice (grey bars). Images representative of NeuN+ neurons in subiculum of 6 month-old cohorts. Scale bars = 100 µm. Histological analyses and related quantification performed using multiple, serial sections from n = 6 mice (3 females, 3 males), of each genotype and at each time-point. Error bars represent SEM. Statistical analysis done using Two-way ANOVA (pint = ns) followed by Tukey’s post-hoc tests. ***p = 0.0002, **p < 0.005. Densitometric analysis to quantify fold changes in (C) pre-synaptic proteins and (D) post-synaptic markers in cortical lysates of B6;Cx3cr1+/+ (white bars), B6;Cx3cr1−/− (light grey bars), 5xFAD;Cx3cr1+/+ (black bars) and 5xFAD;Cx3cr1−/− (dark grey bars) mice 5xFAD;Cx3cr1−/− (dark grey bars). Fold changes were calculated using blots from n = 6 animals (3 females, 3 males) of each genotype run on the same gel to enable comparisons. Statistical analyses done using One-way ANOVA followed by Brown-Forsythe and Welch’s post-hoc tests. *padj < 0.05, **padj < 0.001, ***padj < 0.0001, ****padj < 0.00001. (E) Y-maze based evaluation of working memory in 6 month-old B6;Cx3cr1+/+ mice (white bars), B6;Cx3cr1−/− (light grey bars), 5xFAD;Cx3cr1+/+ (black bars) and 5xFAD; Cx3cr1−/− (dark grey bars). Behavioral testing done using ~ n = 10 animals (5 females, 5 males) per genotype. Statistical analysis done using One-way ANOVA followed by Brown-Forsythe and Welch’s post-hoc tests. *padj = 0.02, ***p.adj < 0.0001, ns = not significant
Fig. 7 Aggravated synaptic dysfunction, neuronal loss and cognitive decline in the absence of Cx3cr1. (A) Representative western blots to assess the levels of pre-synaptic proteins—Synaptic Vesicle Protein-2 (SV2a), Synaptophysin and Homer, and post-synaptic proteins—Post-Synaptic Density-19 (PSD19) and NMDA Receptor subunit 1 (NR1) in cortical lysates of 6 month-old 5xFAD;Cx3cr1+/+ and 5xFAD;Cx3cr1−/− mice and their genotype matched controls. Blots representative of n = 6 (3 females, 3 males) per genotype. (B) Visualization and quantitation of NeuN+ neuronal abundance in the subiculum of 4- and 6 month-old 5xFAD;Cx3cr1+/+ (black bars) and 5xFAD;Cx3cr1−/− mice (grey bars). Images representative of NeuN+ neurons in subiculum of 6 month-old cohorts. Scale bars = 100 µm. Histological analyses and related quantification performed using multiple, serial sections from n = 6 mice (3 females, 3 males), of each genotype and at each time-point. Error bars represent SEM. Statistical analysis done using Two-way ANOVA (pint = ns) followed by Tukey’s post-hoc tests. ***p = 0.0002, **p < 0.005. Densitometric analysis to quantify fold changes in (C) pre-synaptic proteins and (D) post-synaptic markers in cortical lysates of B6;Cx3cr1+/+ (white bars), B6;Cx3cr1−/− (light grey bars), 5xFAD;Cx3cr1+/+ (black bars) and 5xFAD;Cx3cr1−/− (dark grey bars) mice 5xFAD;Cx3cr1−/− (dark grey bars). Fold changes were calculated using blots from n = 6 animals (3 females, 3 males) of each genotype run on the same gel to enable comparisons. Statistical analyses done using One-way ANOVA followed by Brown-Forsythe and Welch’s post-hoc tests. *padj < 0.05, **padj < 0.001, ***padj < 0.0001, ****padj < 0.00001. (E) Y-maze based evaluation of working memory in 6 month-old B6;Cx3cr1+/+ mice (white bars), B6;Cx3cr1−/− (light grey bars), 5xFAD;Cx3cr1+/+ (black bars) and 5xFAD; Cx3cr1−/− (dark grey bars). Behavioral testing done using ~ n = 10 animals (5 females, 5 males) per genotype. Statistical analysis done using One-way ANOVA followed by Brown-Forsythe and Welch’s post-hoc tests. *padj = 0.02, ***p.adj < 0.0001, ns = not significantCC BY · PubMed Central

Verification

Claims the paper makes

The claims and statistics of this paper haven’t been checked yet.

Run the check — free, no account needed. It reads the open-access text and checks the sources it cites.

A few free checks a day · papers already verified open instantly · results are public

Claims other papers make about this one

Each is checked against this paper’s own text: does it say what the citing paper says it does?

Self-check

Percentages, sums and reported differences re-computed from the paper’s own numbers.

The self-check needs the paper’s full text.

Citations

Cites

Show all 55 references

Cited by

Sorted by citations

See all 113

Metadata

Authors
Puntambekar, S. S., Moutinho, M., Lin, P. B.-C., Jadhav, V., Tumbleson-Brink, D., Balaji, A., Benito, M. A., Xu, G., Oblak, A., Lasagna-Reeves, C. A., Landreth, G. E., & Lamb, B. T.
Affiliations
  • Indiana University Indianapolis (US)
  • Indiana University School of Medicine (US)
  • University of Washington (US)
  • Indiana Clinical and Translational Sciences Institute (US)
Corresponding author
  • Puntambekar, Shweta S.
  • Lamb, Bruce T.
Venue
Molecular Neurodegeneration
Published
2022-06-28
Volume
17
Issue
1
Pages
47-47
ISSN
1750-1326 (ISSN-L)
OpenAlex
W4283643624
Cited by
113
References
55
Citations by year
2026: 26 · 2025: 33 · 2024: 23 · 2023: 26 · 2022: 5
FWCI
13.45
Type
journal article
Language
en
Open access
Locations
  • Molecular Neurodegeneration (publishedVersion, cc-by)
  • PubMed Central (publishedVersion, cc-by)
  • PubMed (publishedVersion)
  • Purdue University Indianapolis (Indiana University) (submittedVersion, cc-by)
  • DOAJ (DOAJ: Directory of Open Access Journals) (submittedVersion, cc-by-sa)
  • IUScholarWorks (Indiana University) (submittedVersion, cc-by)
Funders
National Institutes of Health (NIH RF1AG051495, 1RF1AG069425-01)
Topics
  • Life Sciences › Neuroscience › Cellular and Molecular Neuroscience › Alzheimer's disease research and treatments
  • Life Sciences › Neuroscience › Neurology › Neuroinflammation and Neurodegeneration Mechanisms
  • Life Sciences › Neuroscience › Neurology › Neurological Disease Mechanisms and Treatments
Keywords
CX3CR1, Alzheimer's disease, amyloid-beta, microglial dysfunction, 5xFAD mice, tau pathology, neurodegeneration, cognitive decline, TGF-beta signaling, oxidative stress, microglial phagocytosis, lysosomal acidification, microglial polarization, synaptic loss, working memory, neuroinflammation, amyloid plaques, amyloid-beta oligomers
MeSH terms
CX3C Chemokine Receptor 1, Alzheimer Disease, Amyloidosis, Animals, Neurons, Transforming Growth Factor beta, Mice, Plaque, Amyloid, Amyloidogenic Proteins, Cognitive Dysfunction

About these checks

Registry, retraction, Cites and statistics results are computed, not judged, with one exception: a printed reference that no index lists is read once by a model before it counts as a citation error. Claims are extracted by a model and kept only when their quote appears verbatim in the text; each cited source is then checked, with a model’s help, for whether it says what the claim relies on. Those verdicts can be wrong — read the claim’s quote and the cited source before relying on one.

Statistics and arithmetic are recomputed, not judged.

Confidence bands are shown only for fields calibrated on our annotated test set. None is calibrated yet, so no band is shown.

What counts as a claim ›How we measure confidence ›How we check this ›

Are you an author, or do you see a problem with this page? Request a review