

The DOI matches its Crossref record; 39 of the 40 references it cites were found in a registry or an index.
Methylomic profiling of human brain tissue supports a neurodevelopmental origin for schizophrenia
Open accessAbstract
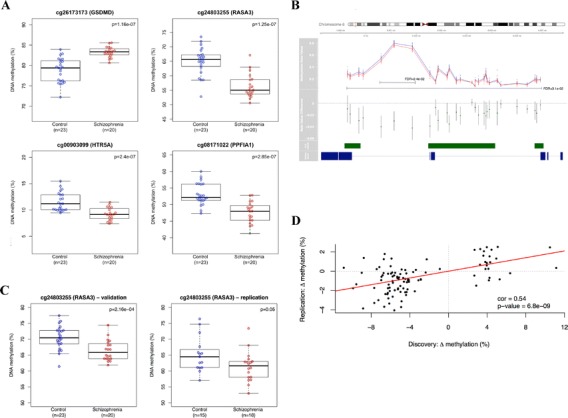
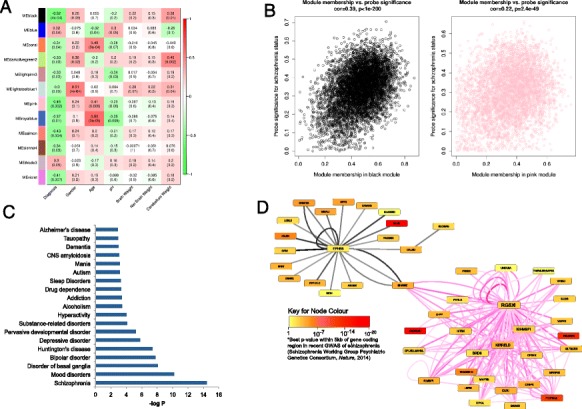
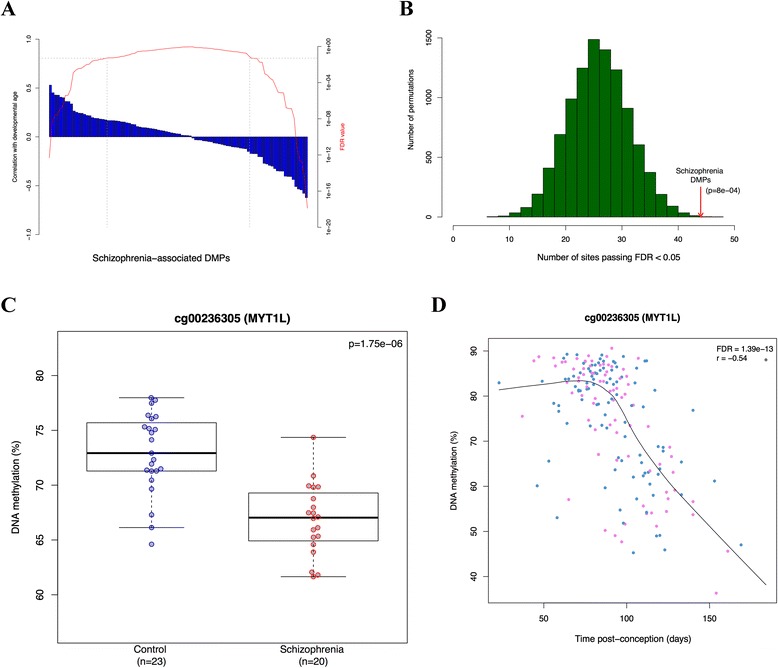
BACKGROUND: Schizophrenia is a severe neuropsychiatric disorder that is hypothesized to result from disturbances ine arly brain development. There is mounting evidence to support a role for developmentally regulated epigenetic variation in the molecular etiology of the disorder. Here, we describe a systematic study of schizophrenia-associated methylomic variation in the adult brain and its relationship to changes in DNA methylation across human fetal brain development. RESULTS: We profile methylomic variation in matched prefrontal cortex and cerebellum brain tissue from schizophrenia patients and controls, identifying disease-associated differential DNA methylation at multiple loci,particularly in the prefrontal cortex, and confirming these differences in an independent set of adult brain samples.Our data reveal discrete modules of co-methylated loci associated with schizophrenia that are enriched for genes involved in neurodevelopmental processes and include loci implicated by genetic studies of the disorder. Methylomic data from human fetal cortex samples, spanning 23 to 184 days post-conception, indicates that schizophrenia-associated differentially methylated positions are significantly enriched for loci at which DNA methylation is dynamically altered during human fetal brain development. CONCLUSIONS: Our data support the hypothesis that schizophrenia has an important early neurodevelopmental component, and suggest that epigenetic mechanisms may mediate these effects.
Overview
The claims and statistics of this paper haven’t been checked yet.
Run the check — free, no account needed. It reads the open-access text and checks the sources it cites.
Integrity signals
Registry
Cites
Statistics
Figures
Verification
Claims the paper makes
The claims and statistics of this paper haven’t been checked yet.
Run the check — free, no account needed. It reads the open-access text and checks the sources it cites.
Claims other papers make about this one
Each is checked against this paper’s own text: does it say what the citing paper says it does?
The source backs part of the claim, not all of it — or backs it for a different population, condition or comparison.
In the citing paper
“Further, EWAS studies have identified differential DNAm in HTR2A (Numata, Ye, Herman, & Lipska, 2014), HTR5A and HTR1E (Nishioka et al., 2013; Pidsley et al., 2014) genes in those with psychosis.”
From Can epigenetics shine a light on the biological pathways underlying major mental disorders? (2022) · cites this paper as Pidsley et al., 2014
Experimental — accuracy not yet measured
Self-check
Percentages, sums and reported differences re-computed from the paper’s own numbers.
The self-check needs the paper’s full text.
Citations
Cites
WGCNA: an R package for weighted correlation network analysis
Langfelder, P., & Horvath, S. (2008) · BMC Bioinformatics · doi:10.1186/1471-2105-9-559 · Cited by 27,252
Smyth, G. K. (2004) · Statistical Applications in Genetics and Molecular Biology · doi:10.2202/1544-6115.1027 · Cited by 11,829
Biological insights from 108 schizophrenia-associated genetic loci
Schizophrenia Working Group of the Psychiatric Genomics Consortium (2014) · Nature · doi:10.1038/nature13595 · Cited by 7,577
A General Framework for Weighted Gene Co-Expression Network Analysis
Zhang, B., & Horvath, S. (2005) · Statistical Applications in Genetics and Molecular Biology · doi:10.2202/1544-6115.1128 · Cited by 5,684
Common polygenic variation contributes to risk of schizophrenia and bipolar disorder
The International Schizophrenia Consortium (2009) · Nature · doi:10.1038/nature08185 · Cited by 4,821
Identifying biological themes within lists of genes with EASE
Hosack, D. A., Dennis, G., Sherman, B. T., Lane, H. C., & Lempicki, R. A. (2003) · Genome biology · doi:10.1186/gb-2003-4-10-r70 · Cited by 1,961
Chen, Y. A., Lemire, M., Choufani, S., Butcher, D. T., Grafodatskaya, D., Zanke, B. W., Gallinger, S., Hudson, T. J., & Weksberg, R. (2013) · Epigenetics · doi:10.4161/epi.23470 · Cited by 1,547
Rare chromosomal deletions and duplications increase risk of schizophrenia
The International Schizophrenia Consortium (2008) · Nature · doi:10.1038/nature07239 · Cited by 1,475
A polygenic burden of rare disruptive mutations in schizophrenia
Purcell, S. M., Moran, J. L., Fromer, M., Ruderfer, D., Solovieff, N., Roussos, P., O’Dushlaine, C., Chambert, K., Bergen, S. E., Kähler, A., et al. (2014) · Nature · doi:10.1038/nature12975 · Cited by 1,385
DNA methylation profiling of human chromosomes 6, 20 and 22
Eckhardt, F., Lewin, J., Cortese, R., Rakyan, V. K., Attwood, J., Burger, M., Burton, J. H., Cox, T. V., Davies, R., Down, T. A., et al. (2006) · Nature Genetics · doi:10.1038/ng1909 · Cited by 1,378
Cited by
Sorted by citations
Pidsley, R., Zotenko, E., Peters, T. J., Lawrence, M. G., Risbridger, G. P., Molloy, P., Van Djik, S., Muhlhausler, B., Stirzaker, C., & Clark, S. J. (2016) · Genome biology · doi:10.1186/s13059-016-1066-1 · Cited by 1,480
An epigenetic clock analysis of race/ethnicity, sex, and coronary heart disease
Horvath, S., Gurven, M., Levine, M. E., Trumble, B. C., Kaplan, H. S., Allayee, H., Ritz, B. R., Chen, B. H., Lu, A. T.-H., Rickabaugh, T. M., et al. (2016) · Genome biology · doi:10.1186/s13059-016-1030-0 · Cited by 749
Mapping DNA methylation across development, genotype and schizophrenia in the human frontal cortex
Jaffe, A. E., Gao, Y., Deep-Soboslay, A., Tao, R., Hyde, T. M., Weinberger, D. R., & Kleinman, J. E. (2016) · Nature Neuroscience · doi:10.1038/nn.4181 · Cited by 511
Hannon, E., Lunnon, K., Schalkwyk, L., & Mill, J. (2015) · Epigenetics · doi:10.1080/15592294.2015.1100786 · Cited by 455
Self-citationHannon, E., Dempster, E., Viana, J., Burrage, J., Smith, A. R., Macdonald, R., St Clair, D., Mustard, C., Breen, G., Therman, S., et al. (2016) · Genome Biology · doi:10.1186/s13059-016-1041-x · Cited by 349
Self-citationMethylation QTLs in the developing brain and their enrichment in schizophrenia risk loci
Hannon, E. J., Spiers, H., Viana, J. F., Pidsley, R., Burrage, J., Murphy, T. M., Troakes, C., Turecki, G., O’Donovan, M. C., Schalkwyk, L. C., et al. (2015) · Nature Neuroscience · doi:10.1038/nn.4182 · Cited by 350
Guidance for DNA methylation studies: statistical insights from the Illumina EPIC array
Mansell, G., Gorrie-Stone, T. J., Bao, Y., Kumari, M., Schalkwyk, L. S., Mill, J., & Hannon, E. (2019) · BMC Genomics · doi:10.1186/s12864-019-5761-7 · Cited by 340
Methylomic trajectories across human fetal brain development
Spiers, H., Hannon, E., Schalkwyk, L. C., Smith, R., Wong, C. C. Y., O’Donovan, M. C., Bray, N. J., & Mill, J. (2015) · Genome Research · doi:10.1101/gr.180273.114 · Cited by 287
BECon: a tool for interpreting DNA methylation findings from blood in the context of brain
Edgar, R. D., Jones, M. J., Meaney, M. J., Turecki, G., & Kobor, M. S. (2017) · Translational Psychiatry · doi:10.1038/tp.2017.171 · Cited by 261
Non-CG Methylation in the Human Genome
He, Y., & Ecker, J. R. (2015) · Annual Review of Genomics and Human Genetics · doi:10.1146/annurev-genom-090413-025437 · Cited by 280
The fetal origins of mental illness
al-Haddad, B. J. S., Oler, E., Armistead, B., Elsayed, N. A., Weinberger, D. R., Bernier, R., Burd, I. D., Kapur, R. P., Jacobsson, B., Wang, C., et al. (2019) · American Journal of Obstetrics and Gynecology · doi:10.1016/j.ajog.2019.06.013 · Cited by 272
Microbiome, inflammation, epigenetic alterations, and mental diseases
Alam, R., Abdolmaleky, H. M., & Zhou, J. (2017) · American Journal of Medical Genetics Part B Neuropsychiatric Genetics · doi:10.1002/ajmg.b.32567 · Cited by 240
Schormair, B., Zhao, C., Bell, S., Tilch, E., Salminen, A. V., Pütz, B., Dauvilliers, Y. A., Stefani, A., Högl, B., Poewe, W. H., et al. (2017) · The Lancet Neurology · doi:10.1016/s1474-4422(17)30327-7 · Cited by 243
The Epigenetic Link between Prenatal Adverse Environments and Neurodevelopmental Disorders
Kundaković, M., & Jarić, I. (2017) · Genes · doi:10.3390/genes8030104 · Cited by 241
Recalibrating the epigenetic clock: implications for assessing biological age in the human cortex
Shireby, G. L., Davies, J. P., Francis, P. T., Burrage, J., Walker, E., Neilson, G., Dahir, A., Thomas, A. J., Love, S., Smith, R. G., et al. (2020) · Brain · doi:10.1093/brain/awaa334 · Cited by 194
Watson, C. T., Roussos, P., Garg, P., Ho, D. J., Azam, N., Katsel, P. L., Haroutunian, V., & Sharp, A. J. (2016) · Genome Medicine · doi:10.1186/s13073-015-0258-8 · Cited by 201
The cerebellum ages slowly according to the epigenetic clock
Horvath, S., Mah, V., Lu, A. T., Woo, J. S., Choi, O.-W., Jasinska, A. J., Riancho, J. A., Tung, S., Coles, N. S., Braun, J., et al. (2015) · Aging · doi:10.18632/aging.100742 · Cited by 191
Watson, C. T., Szutorisz, H., Garg, P., Martin, Q., Landry, J. A., Sharp, A. J., & Hurd, Y. L. (2015) · Neuropsychopharmacology · doi:10.1038/npp.2015.155 · Cited by 185
Richetto, J., & Meyer, U. (2020) · Biological Psychiatry · doi:10.1016/j.biopsych.2020.03.008 · Cited by 189
Association of DNA methylation differences with schizophrenia in an Epigenome-Wide association study
Montano, C., Taub, M. A., Jaffe, A., Briem, E., Feinberg, J. I., Trygvadottir, R., Idrizi, A., Runarsson, A., Berndsen, B., Gur, R. C., et al. (2016) · JAMA Psychiatry · doi:10.1001/jamapsychiatry.2016.0144 · Cited by 180
Smigielski, L., Jagannath, V., Rössler, W., Walitza, S., & Grünblatt, E. (2020) · Molecular Psychiatry · doi:10.1038/s41380-019-0601-3 · Cited by 168
Tobi, E. W., Slieker, R. C., Stein, A. D., Suchiman, H. E. D., Slagboom, P. E., van Zwet, E. W., Heijmans, B. T., & Lumey, L. H. (2015) · International Journal of Epidemiology · doi:10.1093/ije/dyv043 · Cited by 173
Epigenetic profiling of ADHD symptoms trajectories: a prospective, methylome-wide study
Walton, E., Pingault, J., Cecil, C. A. M., Gaunt, T. R., Relton, C. L., Mill, J. S., & Barker, E. D. (2016) · Molecular Psychiatry · doi:10.1038/mp.2016.85 · Cited by 164
Hannon, E., Dempster, E. L., Mansell, G., Burrage, J., Bass, N., Bohlken, M. M., Corvin, A., Curtis, C. J., Dempster, D., Di Forti, M., et al. (2021) · eLife · doi:10.7554/elife.58430 · Cited by 132
“…recent studies have identified schizophrenia-associated DNA methylation differences in analyses of post-mortem brain tissue ( Jaffe et al., 2016 ; Pidsley et al., 2014 ; Viana et al., 2017 ; Wockner et al., 2014 ), and also detected disease-associated variation in peripheral blood samples from…”
Systematic underestimation of the epigenetic clock and age acceleration in older subjects
Khoury, L. Y. E., Gorrie-Stone, T. J., Smart, M., Hughes, A., Bao, Y., Andrayas, A., Burrage, J., Hannon, E. J., Meena Kumari, B., Mill, J. S., et al. (2019) · Genome biology · doi:10.1186/s13059-019-1810-4 · Cited by 135
DNA Methylation and Susceptibility to Autism Spectrum Disorder
Tremblay, M. W., & Jiang, Y. (2019) · Annual Review of Medicine · doi:10.1146/annurev-med-120417-091431 · Cited by 139
Epigenetic Research in Neuropsychiatric Disorders: the “Tissue Issue”
Bakulski, K. M., Halladay, A., Hu, V. W., Mill, J., & Fallin, M. D. (2016) · Current Behavioral Neuroscience Reports · doi:10.1007/s40473-016-0083-4 · Cited by 127
McDermott, E., Ryan, E. J., Tosetto, M., Gibson, D. J., Burrage, J., Keegan, D., Byrne, K., Crowe, E., Sexton, G., Malone, K. M., et al. (2015) · Journal of Crohn s and Colitis · doi:10.1093/ecco-jcc/jjv176 · Cited by 131
Genetic architecture of epigenetic and neuronal ageing rates in human brain regions
Lu, A. T.-H., Hannon, E. J., Levine, M. E., Crimmins, E. M., Lunnon, K., Mill, J. S., Geschwind, D. H., & Horvath, S. (2017) · Nature Communications · doi:10.1038/ncomms15353 · Cited by 121
Cattane, N., Richetto, J., & Cattaneo, A. (2018) · Neuroscience & Biobehavioral Reviews · doi:10.1016/j.neubiorev.2018.07.001 · Cited by 129
Viana, J., Hannon, E., Dempster, E., Pidsley, R., Macdonald, R., Knox, O., Spiers, H., Troakes, C., Al-Saraj, S., Turecki, G., et al. (2016) · Human Molecular Genetics · doi:10.1093/hmg/ddw373 · Cited by 105
Methylomic analysis of salivary DNA in childhood ADHD identifies altered DNA methylation in VIPR 2
Wilmot, B., Fry, R. C., Smeester, L., Musser, E. D., Mill, J. S., & Nigg, J. T. (2015) · Journal of Child Psychology and Psychiatry · doi:10.1111/jcpp.12457 · Cited by 122
Chatterton, Z., Hartley, B. J., Seok, M.-H., Mendelev, N., Chen, S., Milekic, M. H., Rosoklija, G. B., Stankov, A., Trencevsja-Ivanovska, I., Brennand, K., et al. (2017) · Epigenetics & Chromatin · doi:10.1186/s13072-017-0111-y · Cited by 97
DNA Methylation Landscapes of Human Fetal Development
Slieker, R. C., Roost, M. S., van Iperen, L., Suchiman, H. E. D., Tobi, E. W., Carlotti, F., de Koning, E. J. P., Slagboom, P. E., Heijmans, B. T., & Lopes, S. M. C. D. S. (2015) · PLoS Genetics · doi:10.1371/journal.pgen.1005583 · Cited by 101
Murphy, T. M., Crawford, B., Dempster, E. L., Hannon, E. J., Burrage, J., Turecki, G., Kaminsky, Z. A., & Mill, J. S. (2017) · Translational Psychiatry · doi:10.1038/tp.2016.249 · Cited by 96
Variation in 5-hydroxymethylcytosine across human cortex and cerebellum
Lunnon, K., Hannon, E. J., Smith, R. G., Dempster, E. L., Wong, C. C. Y., Burrage, J., Troakes, C., Al‐Sarraj, S., Kepa, A., Schalkwyk, L. C., et al. (2016) · Genome biology · doi:10.1186/s13059-016-0871-x · Cited by 85
DNA Methylation and Psychiatric Disorders
Liu, C., Jiao, C., Wang, K., & Yuan, N. (2018) · Progress in molecular biology and translational science · doi:10.1016/bs.pmbts.2018.01.006 · Cited by 86
The role of epigenomics in personalized medicine
Kronfol, M. M., Dozmorov, M. G., Huang, R., Slattum, P. W., & McClay, J. L. (2017) · Expert Review of Precision Medicine and Drug Development · doi:10.1080/23808993.2017.1284557 · Cited by 87
Fetal programming of schizophrenia: Select mechanisms
Debnath, M., Venkatasubramanian, G., & Berk, M. (2014) · Neuroscience & Biobehavioral Reviews · doi:10.1016/j.neubiorev.2014.12.003 · Cited by 89
Dong, E., Tueting, P. A., Matrisciano, F., Grayson, D. R., & Guidotti, A. (2016) · Translational Psychiatry · doi:10.1038/tp.2015.191 · Cited by 83
Genetic variants near MLST8 and DHX57 affect the epigenetic age of the cerebellum
Lu, A. T.-H., Hannon, E. J., Levine, M. E., Hao, K., Crimmins, E. M., Lunnon, K., Kozlenkov, A., Mill, J. S., Dracheva, S. M., & Horvath, S. (2016) · Nature Communications · doi:10.1038/ncomms10561 · Cited by 72
Chen, J., Zang, Z., Braun, U., Schwarz, K., Harneit, A., Kremer, T., Ma, R., Schweiger, J., Moessnang, C., Geiger, L., et al. (2020) · JAMA Psychiatry · doi:10.1001/jamapsychiatry.2019.4792 · Cited by 69
Garg, P., Joshi, R. S., Watson, C. T., & Sharp, A. J. (2018) · PLoS Genetics · doi:10.1371/journal.pgen.1007707 · Cited by 73
van de Leemput, J., Hess, J., Glatt, S. J., & Tsuang, M. T. (2016) · Advances in genetics · doi:10.1016/bs.adgen.2016.08.001 · Cited by 71
DNA methylation and inflammation marker profiles associated with a history of depression
Crawford, B., Craig, Z., Mansell, G., White, I., Smith, A. R., Spaull, S. R., Imm, J. L., Hannon, E. J., Wood, A. R., Yaghootkar, H., et al. (2018) · Human Molecular Genetics · doi:10.1093/hmg/ddy199 · Cited by 69
Genome-wide DNA methylation meta-analysis in the brains of suicide completers
Policicchio, S., Washer, S., Viana, J., Iatrou, A., Burrage, J., Hannon, E., Turecki, G., Kaminsky, Z., Mill, J., Dempster, E. L., et al. (2020) · Translational Psychiatry · doi:10.1038/s41398-020-0752-7 · Cited by 61
Brain-specific epigenetic markers of schizophrenia
Wockner, L. F., Morris, C. P., Noble, E. P., Lawford, B. R., Whitehall, V., Young, R. M., & Voisey, J. (2015) · Translational Psychiatry · doi:10.1038/tp.2015.177 · Cited by 58
DNA Methylation in Schizophrenia
Pries, L.-K., Gülöksüz, S., & Kenis, G. (2017) · Advances in experimental medicine and biology · doi:10.1007/978-3-319-53889-1_12 · Cited by 61
Epigenomics of Major Depressive Disorders and Schizophrenia: Early Life Decides
Hoffmann, A., Sportelli, V., Ziller, M. J., & Spengler, D. (2017) · International Journal of Molecular Sciences · doi:10.3390/ijms18081711 · Cited by 65
Identification of Key lncRNAs Associated With Atherosclerosis Progression Based on Public Datasets
Wang, C., Shi, H., Chen, L.-H., Li, X.-L., Cao, G.-L., & Hu, X.-F. (2019) · Frontiers in Genetics · doi:10.3389/fgene.2019.00123 · Cited by 58
Characterization of cross-tissue genetic-epigenetic effects and their patterns in schizophrenia
Lin, D., Chen, J., Perrone‐Bizzozero, N. I., Bustillo, J., Du, Y., Calhoun, V. D., & Liu, J. (2018) · Genome Medicine · doi:10.1186/s13073-018-0519-4 · Cited by 58
Stępniak, K., Machnicka, M. A., Mieczkowski, J., Macioszek, A., Wojtaś, B., Gielniewski, B., Poleszak, K., Perycz, M., Król, S. K., Guzik, R., et al. (2021) · Nature Communications · doi:10.1038/s41467-021-23922-2 · Cited by 55
Can epigenetics shine a light on the biological pathways underlying major mental disorders?
Alameda, L., Trotta, G., Quigley, H., Rodriguez, V., Gadelrab, R., Dwir, D., Dempster, E., Wong, C. C. Y., & Forti, M. D. (2022) · Psychological Medicine · doi:10.1017/s0033291721005559 · Cited by 60
“Further, EWAS studies have identified differential DNAm in HTR2A (Numata, Ye, Herman, & Lipska, 2014), HTR5A and HTR1E (Nishioka et al., 2013; Pidsley et al., 2014) genes in those with psychosis.”
BackgroundWang, Y., Grant, O. A., Zhai, X., McDonald-Maier, K. D., & Schalkwyk, L. C. (2023) · GeroScience · doi:10.1007/s11357-023-00871-w · Cited by 55
Li, S., Papale, L. A., Zhang, Q., Madrid, A., Chen, L., Chopra, P., Keleş, S., Jin, P., & Alisch, R. S. (2015) · Neurobiology of Disease · doi:10.1016/j.nbd.2015.11.010 · Cited by 47
Methylomic analysis of monozygotic twins discordant for childhood psychotic symptoms
Fisher, H. L., Murphy, T. M., Arseneault, L., Caspi, A., Moffitt, T. E., Viana, J. F., Hannon, E. J., Pidsley, R., Burrage, J., Dempster, E. L., et al. (2015) · Epigenetics · doi:10.1080/15592294.2015.1099797 · Cited by 47
Boks, M. P., Houtepen, L. C., Xu, Z., He, Y., Ursini, G., Maihofer, A. X., Rajarajan, P., Yu, Q., Xu, H., Wu, Y., et al. (2018) · Schizophrenia · doi:10.1038/s41537-018-0058-4 · Cited by 45
DNA methylation signature as a biomarker of major neuropsychiatric disorders
Shirvani-Farsani, Z., Maloum, Z., Bagheri‐Hosseinabadi, Z., Vilor‐Tejedor, N., & Sadeghi, I. (2021) · Journal of Psychiatric Research · doi:10.1016/j.jpsychires.2021.06.013 · Cited by 46
Regional differences in mitochondrial DNA methylation in human post-mortem brain tissue
Devall, M. A. M., Smith, R. G., Jeffries, A. R., Hannon, E. J., Davies, M. N., Schalkwyk, L. C., Mill, J. S., Weedon, M. N., & Lunnon, K. (2017) · Clinical Epigenetics · doi:10.1186/s13148-017-0337-3 · Cited by 44
Molecular windows into the human brain for psychiatric disorders
Egervári, G., Kozlenkov, A., Dracheva, S. M., & Hurd, Y. L. (2018) · Molecular Psychiatry · doi:10.1038/s41380-018-0125-2 · Cited by 40
Assessment of copy number variations in the brain genome of schizophrenia patients
Sakai, M., Watanabe, Y., Someya, T., Araki, K., Shibuya, M., Niizato, K., Oshima, K., Kunii, Y., Yabe, H., Matsumoto, J., et al. (2015) · Molecular Cytogenetics · doi:10.1186/s13039-015-0144-5 · Cited by 43
Cariaga-Martínez, A. E., Sáiz-Ruiz, J., & Alelú‐Paz, R. (2016) · Frontiers in Neuroscience · doi:10.3389/fnins.2016.00202 · Cited by 48
Early-life stress links 5-hydroxymethylcytosine to anxiety-related behaviors
Papale, L. A., Madrid, A., Li, S., & Alisch, R. S. (2017) · Epigenetics · doi:10.1080/15592294.2017.1285986 · Cited by 42
Jagannath, V., Marinova, Z., Monoranu, C., Walitza, S., & Grünblatt, E. (2017) · Frontiers in Neuroanatomy · doi:10.3389/fnana.2017.00031 · Cited by 37
Gomez, L., Odom, G., Young, J. I., Martin, E. R., Liu, L., Chen, X., Griswold, A. J., Gao, Z., Zhang, L., & Wang, L. (2019) · Nucleic Acids Research · doi:10.1093/nar/gkz590 · Cited by 37
Dynorphin and κ-Opioid Receptor Dysregulation in the Dopaminergic Reward System of Human Alcoholics
Bazov, I., Sarkisyan, D., Kononenko, O., Watanabe, H., Yakovleva, T., Hansson, A. C., Sommer, W. H., Spanagel, R., & Bakalkin, G. Y. (2018) · Molecular Neurobiology · doi:10.1007/s12035-017-0844-4 · Cited by 34
Epigenome-wide association study of suicide attempt in schizophrenia
Bani-Fatemi, A., Jeremian, R., Wang, K. Z., Silveira, J., Zai, C., Kolla, N. J., Graff, A., Gerretsen, P., Strauss, J., & De Luca, V. (2018) · Journal of Psychiatric Research · doi:10.1016/j.jpsychires.2018.07.011 · Cited by 33
Rizzardi, L. F., Hickey, P. F., Idrizi, A., Tryggvadóttir, R., Callahan, C. M., Stephens, K., Taverna, S. D., Zhang, H., Ramazanoglu, S., Hansen, K. D., et al. (2021) · Genome biology · doi:10.1186/s13059-021-02335-w · Cited by 31
Epigenetic Basis of Psychiatric Disorders: A Narrative Review
Panariello, F., Fanelli, G., Fabbri, C., Atti, A. R., Ronchi, D. D., & Serretti, A. (2021) · CNS & Neurological Disorders - Drug Targets · doi:10.2174/1871527320666210825101915 · Cited by 30
Tenenbaum, J. D., Bhuvaneshwar, K., Gagliardi, J. P., Hollis, K. F., Jia, P., Ma, L., Nagarajan, R., Rakesh, G., Subbian, V., Visweswaran, S., et al. (2017) · Briefings in Bioinformatics · doi:10.1093/bib/bbx157 · Cited by 31
Schneider, E., Dittrich, M. T., Böck, J., Nanda, I., Müller, T., Seidmann, L., Tralau, T., Galetzka, D., Hajj, N. E., & Haaf, T. (2016) · Gene · doi:10.1016/j.gene.2016.07.058 · Cited by 29
Starnawska, A., Hansen, C. S., Sparsø, T., Mazin, W., Olsen, L., Bertalan, M., Buil, A., Bybjerg‐Grauholm, J., Bækvad‐Hansen, M., HOUGAARD, D. M., et al. (2017) · Translational Psychiatry · doi:10.1038/tp.2017.181 · Cited by 28
Epigenetic Modifications, Alcoholic Brain and Potential Drug Targets
Jangra, A., Sriram, C. S., Pandey, S. N., Choubey, P., Rajput, P., Saroha, B., Bezbaruah, B. K., & Lahkar, M. (2016) · Annals of Neurosciences · doi:10.1159/000449486 · Cited by 28
Neuroepigenetics of Schizophrenia
Punzi, G., Bharadwaj, R. A., & Ursini, G. (2018) · Progress in molecular biology and translational science · doi:10.1016/bs.pmbts.2018.04.010 · Cited by 27
Machine learning for deciphering cell heterogeneity and gene regulation
Scherer, M., Schmidt, F., Lazareva, O., Walter, J., Baumbach, J., Schulz, M. H., & List, M. (2021) · Nature Computational Science · doi:10.1038/s43588-021-00038-7 · Cited by 26
Sex-specific hippocampal 5-hydroxymethylcytosine is disrupted in response to acute stress
Papale, L. A., Li, S., Madrid, A., Zhang, Q., Chen, L., Chopra, P., Jin, P., Keleş, S., & Alisch, R. S. (2016) · Neurobiology of Disease · doi:10.1016/j.nbd.2016.08.014 · Cited by 26
Understanding the genetic liability to schizophrenia through the neuroepigenome
Fullard, J. F., Halene, T. B., Giambartolomei, C., Haroutunian, V. H., Akbarian, S., & Roussos, P. (2016) · Schizophrenia Research · doi:10.1016/j.schres.2016.01.039 · Cited by 26
Zhu, K., Yang, T.-H. O., Dorie, V., Zheng, T., & Anastassiou, D. (2019) · Translational Psychiatry · doi:10.1038/s41398-018-0358-5 · Cited by 24
Alameda, L., Liu, Z., Sham, P. C., Aas, M., Trotta, G., Rodríguez, V., Forti, M. D., Stilo, S. A., Kandaswamy, R., Arango, C., et al. (2023) · Molecular Psychiatry · doi:10.1038/s41380-023-02044-9 · Cited by 24
Zhang, Z., Wiencke, J. K., Kelsey, K. T., Koestler, D. C., Molinaro, A. M., Pike, S. C., Karra, P., Christensen, B. C., & Salas, L. A. (2023) · Frontiers in Neuroscience · doi:10.3389/fnins.2023.1198243 · Cited by 23
Sex effects on DNA methylation affect discovery in epigenome-wide association study of schizophrenia
Tesfaye, M., Spíndola, L., Stavrum, A.-K., Shadrin, A. A., Melle, I. S., Andreassen, O. A., & Hellard, S. L. (2024) · Molecular Psychiatry · doi:10.1038/s41380-024-02513-9 · Cited by 22
Longitudinal investigation of DNA methylation changes preceding adolescent psychotic experiences
Roberts, S., Suderman, M. J., Zammit, S., Watkins, S., Hannon, E. J., Mill, J. S., Relton, C. L., Arseneault, L., Wong, C. C. Y., & Fisher, H. L. (2019) · Translational Psychiatry · doi:10.1038/s41398-019-0407-8 · Cited by 27
Hannon, E. J., Dempster, E. L., Davies, J. P., Davies, J. P., Blake, G. E. T., Burrage, J., Policicchio, S. S. S., Franklin, A., Walker, E., Bamford, R. A., et al. (2024) · BMC Biology · doi:10.1186/s12915-024-01827-y · Cited by 25
Hatcher, C., Relton, C. L., Gaunt, T. R., & Richardson, T. G. (2019) · Translational Psychiatry · doi:10.1038/s41398-019-0437-2 · Cited by 20
Crucial timing in schizophrenia: role of DNA methylation in early neurodevelopment
Ryan, J. L., & Saffery, R. (2014) · Genome biology · doi:10.1186/s13059-014-0495-y · Cited by 19
Schizophrenia is associated with altered DNA methylation variance
Kiltschewskij, D. J., Reay, W. R., & Cairns, M. J. (2024) · Molecular Psychiatry · doi:10.1038/s41380-024-02749-5 · Cited by 19
The Douglas-Bell Canada Brain Bank Post-mortem Brain Imaging Protocol
Dadar, M., Sanches, L. G., Fouquet, J. P., Moqadam, R., Alasmar, Z., Leppert, I. R., Mirault, D., Maranzano, J., Mechawar, N., Chakravarty, M. M., et al. (2024) · Aperture Neuro · doi:10.52294/001c.123347 · Cited by 18
The impact of HLA-G 3′ UTR variants and sHLA-G on risk and clinical correlates of schizophrenia
Rajasekaran, A., Shivakumar, V., Kalmady, S. V., Narayanaswamy, J. C., Subbanna, M., Venugopal, D., Amaresha, A. C., Venkatasubramanian, G., Berk, M., & Debnath, M. (2016) · Human Immunology · doi:10.1016/j.humimm.2016.08.013 · Cited by 19
Advances in the genetics of schizophrenia: toward a network and pathway view for drug discovery
Collier, D. A., Eastwood, B. J., Malki, K., & Mokrab, Y. (2016) · Annals of the New York Academy of Sciences · doi:10.1111/nyas.13066 · Cited by 16
Fetal origin of sex‐bias brain aging
Islam, M., Strawn, M., & Behura, S. K. (2022) · The FASEB Journal · doi:10.1096/fj.202200255rr · Cited by 17
Improved prediction of chronological age from DNA methylation limits it as a biomarker of ageingPreprint
Zhang, Q., Vallerga, C. L., Walker, R. M., Lin, T., Henders, A. K., Montgomery, G. W., He, J., Fan, D., Fowdar, J., Kennedy, M. A., et al. (2018) · bioRxiv (Cold Spring Harbor Laboratory) · doi:10.1101/327890 · Cited by 16
Rethinking the Epigenetic Framework to Unravel the Molecular Pathology of Schizophrenia
Cariaga-Martínez, A. E., & Alelú‐Paz, R. (2017) · International Journal of Molecular Sciences · doi:10.3390/ijms18040790 · Cited by 15
Moghadam, B. T., Etemadikhah, M., Rajkowska, G., Stockmeier, C. A., Grabherr, M. G., Komorowski, J., Feuk, L., & Carlström, E. L. (2019) · Journal of Psychiatric Research · doi:10.1016/j.jpsychires.2019.04.001 · Cited by 15
Schang, A., Sabéran‐Djoneidi, D., & Mezger, V. (2017) · Clinical Genetics · doi:10.1111/cge.13097 · Cited by 19
Zhou, J., Xia, Y., Li, M., Chen, Y., Dai, R., Liu, C., & Chen, C. (2023) · Molecular Psychiatry · doi:10.1038/s41380-023-02243-4 · Cited by 15
The impact of IL10 polymorphisms and sHLA-G levels on the risk of schizophrenia
Rajasekaran, A., Shivakumar, V., Kalmady, S. V., Narayanaswamy, J. C., Subbanna, M., Venugopal, D., Amaresha, A. C., Venkatasubramanian, G., & Debnath, M. (2016) · Asian Journal of Psychiatry · doi:10.1016/j.ajp.2016.06.018 · Cited by 13
Bak, S. T., Staunstrup, N. H., Starnawska, A., Daugaard, T. F., Nyengaard, J. R., Nyegaard, M., Børglum, A. D., Mors, O. N., Dorph‐Petersen, K., & Nielsen, A. L. (2016) · Molecular Neurobiology · doi:10.1007/s12035-016-0345-x · Cited by 12
Genomic instability in the brain: chromosomal mosaicism in schizophrenia
Yurov, Y. B., Vorsanova, S. G., Ia, D., Сергеевич, К. В., Vm, V., Soloviev, I. V., Uranova, N. A., & Iourov, I. Y. (2016) · S S Korsakov Journal of Neurology and Psychiatry · doi:10.17116/jnevro201611611186-91 · Cited by 12
Xia, L., Xia, K., Weinberger, D. R., & Zhang, F. (2019) · Global Clinical and Translational Research · doi:10.36316/gcatr.01.0003 · Cited by 10
Dean, D., Madrid, A., Planalp, E. M., Moody, J. F., Papale, L. A., Knobel, K. M., Wood, E. K., McAdams, R. M., Coe, C. L., Goldsmith, H. H., et al. (2021) · Scientific Reports · doi:10.1038/s41598-021-91642-0 · Cited by 12
Metadata
- Authors
- Pidsley, R., Viana, J., Hannon, E., Spiers, H., Troakes, C., Al-Saraj, S., Mechawar, N., Turecki, G., Schalkwyk, L. C., Bray, N. J., & Mill, J.
- Affiliations
- Garvan Institute of Medical Research (AU)
- University of Exeter (GB)
- King's College London (GB)
- Douglas Mental Health University Institute (CA)
- University of Essex (GB)
- Corresponding author
- Mill, Jonathan
- ORCID
- Venue
- Genome biology
- Published
- 2014-10-28
- Volume
- 15
- Issue
- 10
- Pages
- 483-483
- ISSN
- 1465-6906 (ISSN-L)
- 1474-760X
- PMC
- PMC4262979
- OpenAlex
- W1980511338
- Cited by
- 157
- References
- 40
- Citations by year
- 2026: 2 · 2025: 2 · 2024: 11 · 2023: 6 · 2022: 10 · 2021: 15 · 2020: 11 · 2019: 15 · 2018: 15 · 2017: 25 · 2016: 24 · 2015: 18 · 2014: 2
- FWCI
- 9.42
- Type
- journal article
- Language
- en
- Open access
- gold
- doi.org
- Locations
- Genome biology (publishedVersion, cc-by)
- PubMed Central (publishedVersion, cc-by)
- PubMed (publishedVersion)
- ORCA Online Research @Cardiff (Cardiff University) (acceptedVersion)
- Open Access at Essex (University of Essex) (acceptedVersion)
- Figshare (submittedVersion)
- Research Portal (King's College London) (submittedVersion, cc-by)
- Open Research Exeter (University of Exeter) (submittedVersion, cc-by)
- Funders
- Wellcome Trust (G0700089, GR082557)
- National Institutes of Health
- Medical Research Council (MC_PC_15004, MR/K013807/1, K013807)
- National Institute on Aging (R01AG036039, AG036039)
- Topics
- Life Sciences › Biochemistry, Genetics and Molecular Biology › Molecular Biology › Epigenetics and DNA Methylation
- Health Sciences › Medicine › Psychiatry and Mental health › Schizophrenia research and treatment
- Life Sciences › Biochemistry, Genetics and Molecular Biology › Molecular Biology › Genomics and Chromatin Dynamics
- Keywords
- schizophrenia, DNA methylation, epigenetics, brain development, prefrontal cortex, cerebellum, fetal brain development, differentially methylated positions
- MeSH terms
- Brain, Cerebellum, Humans, Schizophrenia, Prefrontal Cortex, DNA Methylation, Epigenesis, Genetic, Fetal Development
About these checks
Registry, retraction, Cites and statistics results are computed, not judged, with one exception: a printed reference that no index lists is read once by a model before it counts as a citation error. Claims are extracted by a model and kept only when their quote appears verbatim in the text; each cited source is then checked, with a model’s help, for whether it says what the claim relies on. Those verdicts can be wrong — read the claim’s quote and the cited source before relying on one.
Statistics and arithmetic are recomputed, not judged.
Confidence bands are shown only for fields calibrated on our annotated test set. None is calibrated yet, so no band is shown.
What counts as a claim ›How we measure confidence ›How we check this ›
Are you an author, or do you see a problem with this page? Request a review
