

The DOI matches its Crossref record; 84 of the 84 references it cites were found in a registry or an index.
Single-cell RNA-seq reveals novel regulators of human embryonic stem cell differentiation to definitive endoderm
Open accessAbstract
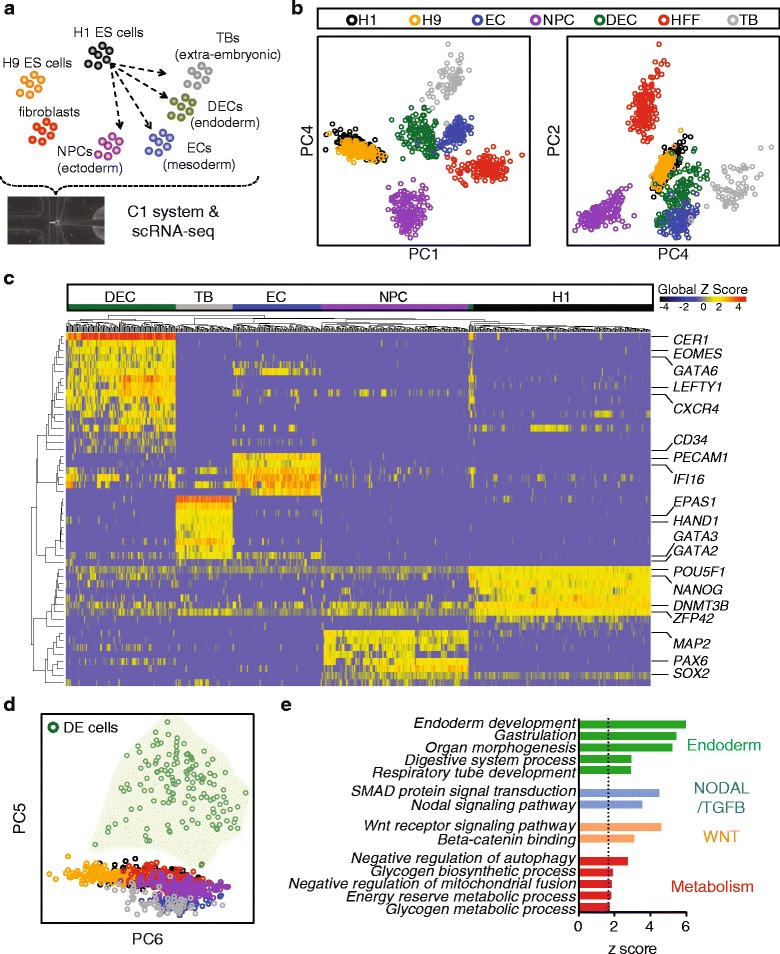
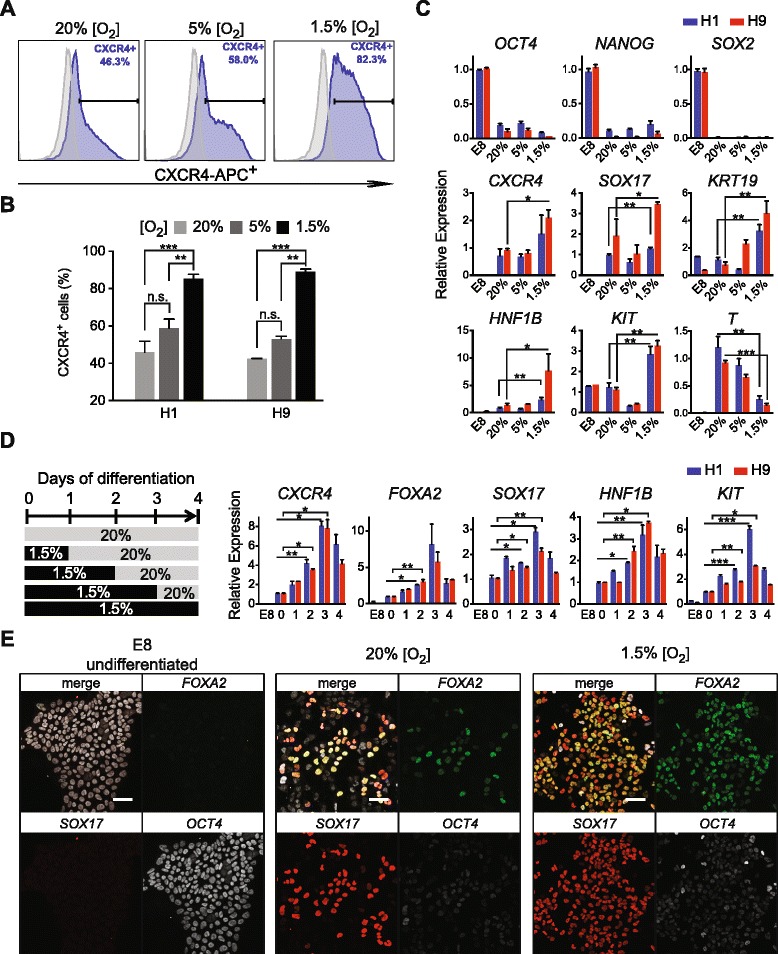
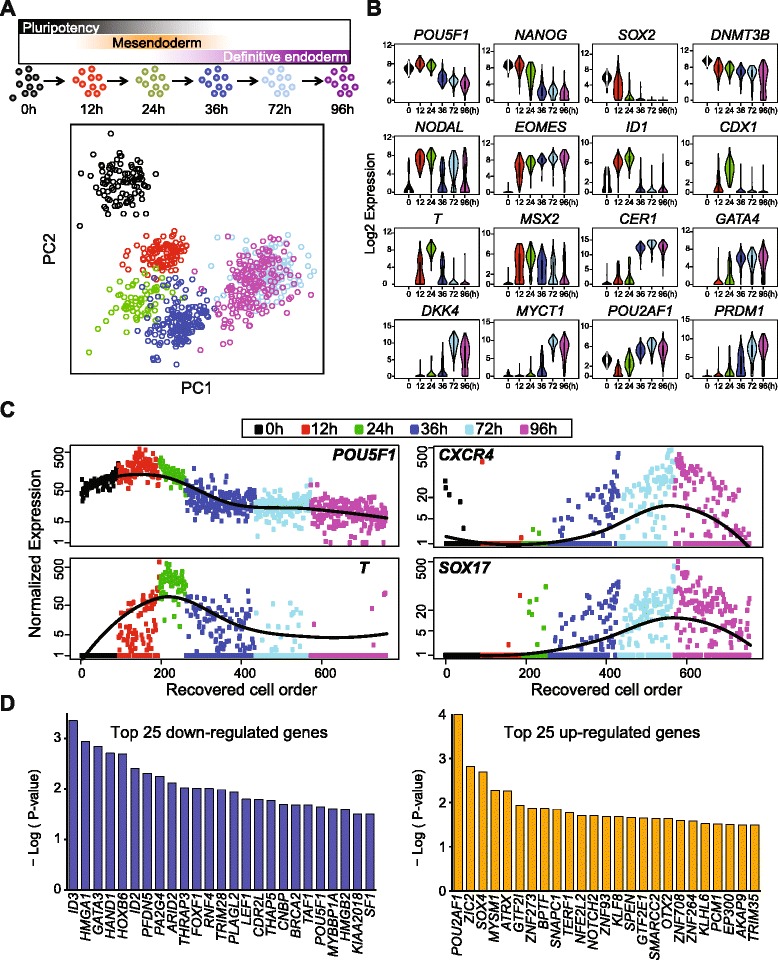
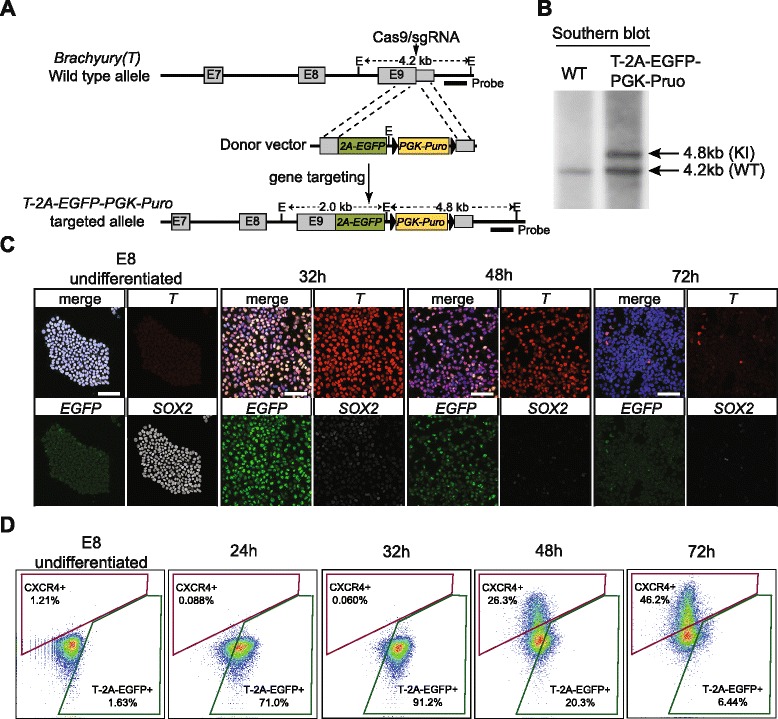
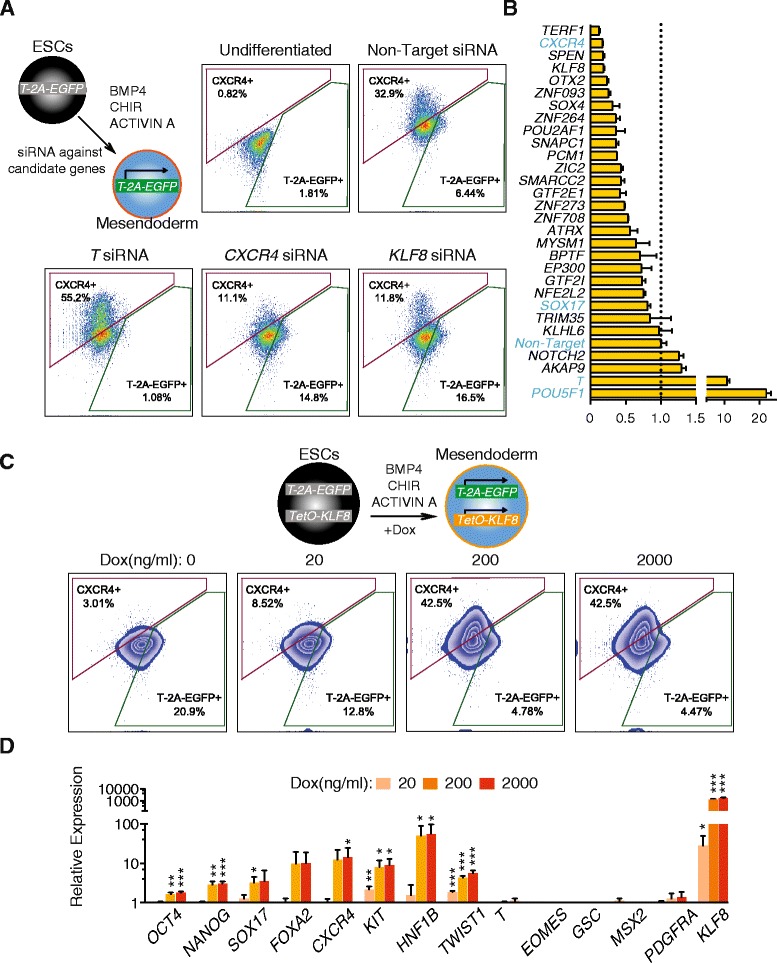
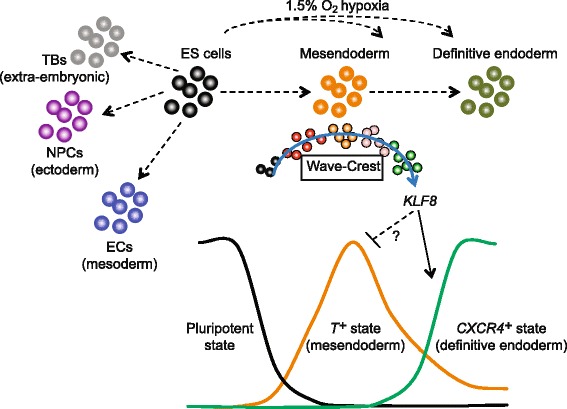
BACKGROUND: Human pluripotent stem cells offer the best available model to study the underlying cellular and molecular mechanisms of human embryonic lineage specification. However, it is not fully understood how individual stem cells exit the pluripotent state and transition towards their respective progenitor states. RESULTS: Here, we analyze the transcriptomes of human embryonic stem cell-derived lineage-specific progenitors by single-cell RNA-sequencing (scRNA-seq). We identify a definitive endoderm (DE) transcriptomic signature that leads us to pinpoint a critical time window when DE differentiation is enhanced by hypoxia. The molecular mechanisms governing the emergence of DE are further examined by time course scRNA-seq experiments, employing two new statistical tools to identify stage-specific genes over time (SCPattern) and to reconstruct the differentiation trajectory from the pluripotent state through mesendoderm to DE (Wave-Crest). Importantly, presumptive DE cells can be detected during the transitory phase from Brachyury (T) (+) mesendoderm toward a CXCR4 (+) DE state. Novel regulators are identified within this time window and are functionally validated on a screening platform with a T-2A-EGFP knock-in reporter engineered by CRISPR/Cas9. Through loss-of-function and gain-of-function experiments, we demonstrate that KLF8 plays a pivotal role modulating mesendoderm to DE differentiation. CONCLUSIONS: We report the analysis of 1776 cells by scRNA-seq covering distinct human embryonic stem cell-derived progenitor states. By reconstructing a differentiation trajectory at single-cell resolution, novel regulators of the mesendoderm transition to DE are elucidated and validated. Our strategy of combining single-cell analysis and genetic approaches can be applied to uncover novel regulators governing cell fate decisions in a variety of systems.
Overview
The claims and statistics of this paper haven’t been checked yet.
Run the check — free, no account needed. It reads the open-access text and checks the sources it cites.
Integrity signals
Registry
Cites
Statistics
Figures
Verification
Claims the paper makes
The claims and statistics of this paper haven’t been checked yet.
Run the check — free, no account needed. It reads the open-access text and checks the sources it cites.
Claims other papers make about this one
Each is checked against this paper’s own text: does it say what the citing paper says it does?
The check wasn’t confident either way, so it gives no verdict — never disputed.
In the citing paper
“A powerful, nonlinear alternative5,105–107 is t-distributed stochastic neighbor embedding108 (t-SNE; introduced for single-cell analysis as viSNE105), especially when computed with an efficient approximation109 compatible with the scale of large genomic data sets110.”
From Revealing the vectors of cellular identity with single-cell genomics (2016) · cites this paper as [108]
Experimental — accuracy not yet measuredIn the citing paper
“In leukemic bone marrow105, t-SNE108 embedding of mass cytometry profiles showed that while some markers were expressed in distinct clusters, others formed a continuous gradient.”
From Revealing the vectors of cellular identity with single-cell genomics (2016) · cites this paper as [108]
In the citing paper
“For example, it is standard to visualize the first principal components of the data, yet in single-cell data, unlike many other data types, those capture only a minute fraction of the variation in the data (note that t-SNE108 too often considers only top principal components in high-dimensional data).”
From Revealing the vectors of cellular identity with single-cell genomics (2016) · cites this paper as [108]
In the citing paper
“This ordering allowed the discovery of novel candidate regulators; for example, a driver of definitive endoderm differentiation (KLF8) was identified and validated by testing for changes in the fraction of differentiated cells post‐KLF8 knockdown.”
From Using single-cell genomics to understand developmental processes and cell fate decisions (2018) · cites this paper as Chu et al, 2016
In the citing paper
“In this study, cells were ordered along the developmental pathway, successfully reconstructing the behaviour of known markers.”
From Using single-cell genomics to understand developmental processes and cell fate decisions (2018) · cites this paper as Chu et al, 2016
In the citing paper
“However, in some datasets, such as that for in vitro differentiation of hESCs into the gastrulation layers (27), the number of expressed genes per cell exhibited considerable intra-phenotypic variation (Fig. 2A, left).”
From Single-cell transcriptional diversity is a hallmark of developmental potential (2020) · cites this paper as [27]
Self-check
Percentages, sums and reported differences re-computed from the paper’s own numbers.
The self-check needs the paper’s full text.
Citations
Cites
1 retracted
RETRACTION: KLF8 is required for bladder cancer cell proliferation and migration
Liang, K., Liu, T., Chu, N., Kang, J., Zhang, R., Yu, Y., Li, D., & Lu, D.-X. (2014) · Biotechnology and Applied Biochemistry · doi:10.1002/bab.1310 · Cited by 17
RetractedRobinson, M. D., McCarthy, D. J., & Smyth, G. K. (2010) · Bioinformatics · doi:10.1093/bioinformatics/btp616 · Cited by 41,364
RSEM: accurate transcript quantification from RNA-Seq data with or without a reference genome
Li, B., & Dewey, C. N. (2011) · BMC Bioinformatics · doi:10.1186/1471-2105-12-323 · Cited by 22,179
Ultrafast and memory-efficient alignment of short DNA sequences to the human genome.
Langmead, B., Trapnell, C., Pop, M., & Salzberg, S. L. (2009) · Genome Biology · doi:10.1186/gb-2009-10-3-r25 · Cited by 21,849 · cited 1×
“8 [77] against the hg19 RefSeq reference (“NM_” designated genes and mitochondrial genes from the Illumina iGenomes annotation).”
BackgroundInduction of Pluripotent Stem Cells from Adult Human Fibroblasts by Defined Factors
Takahashi, K., Tanabe, K., Ohnuki, M., Narita, M., Ichisaka, T., Tomoda, K., & Yamanaka, S. (2007) · Cell · doi:10.1016/j.cell.2007.11.019 · Cited by 20,221
Embryonic Stem Cell Lines Derived from Human Blastocysts
Thomson, J. A., Itskovitz‐Eldor, J., Shapiro, S. S., Waknitz, M. A., Swiergiel, J. J., Marshall, V. S., & Jones, J. M. (1998) · Science · doi:10.1126/science.282.5391.1145 · Cited by 15,947 · cited 1×
“When applied WaveCrest to the scRNA-seq DE differentiation time course data, we selected the genes of interest by combining empirical results from SCPattern and prior knowledge [1, 2, 5, 7, 9, 20].”
MethodSelf-citationDifferential expression analysis for sequence count data
Anders, S., & Huber, W. (2010) · Genome Biology · doi:10.1186/gb-2010-11-10-r106 · Cited by 15,581
Trapnell, C., Williams, B. A., Pertea, G., Mortazavi, A., Kwan, G., van Baren, M. J., Salzberg, S. L., Wold, B. J., & Pachter, L. (2010) · Nature Biotechnology · doi:10.1038/nbt.1621 · Cited by 15,556
Induced Pluripotent Stem Cell Lines Derived from Human Somatic Cells
Yu, J., Vodyanik, M. A., Smuga-Otto, K., Antosiewicz-Bourget, J., Frane, J. L., Tian, S., Nie, J., Jonsdottir, G. A., Ruotti, V., Stewart, R., et al. (2007) · Science · doi:10.1126/science.1151526 · Cited by 10,310 · cited 2×
“When applied WaveCrest to the scRNA-seq DE differentiation time course data, we selected the genes of interest by combining empirical results from SCPattern and prior knowledge [1, 2, 5, 7, 9, 20].”
BackgroundMethodSelf-citationRNA-Guided Human Genome Engineering via Cas9
Mali, P., Yang, L., Esvelt, K. M., Aach, J., Guell, M., DiCarlo, J. E., Norville, J. E., & Church, G. M. (2013) · Science · doi:10.1126/science.1232033 · Cited by 9,210 · cited 1×
“5 μg of pCMV-hCas9 plasmid (Addgene 41815) [56], 7.”
Cited by
Sorted by citations
Items 201–300 of 479
DeepIMAGER: Deeply Analyzing Gene Regulatory Networks from scRNA-seq Data
Zhou, X., Pan, J., Chen, L., Zhang, S., & Chen, Y. (2024) · Biomolecules · doi:10.3390/biom14070766 · Cited by 11
“These six cell lines encompass human embryonic stem cells (hESC) [33], 5G6GR mouse embryonic stem cells (mESC(2)) [34], two mouse hematopoietic stem cell lines [35] representing granulocyte-macrophage lineage (mHSC(GM)), and lymphoid lineage (mHSC(L)), bone marrow-derived macrophages (BMM) and…”
BackgroundKarimnezhad, A. (2022) · Bioinformatics Advances · doi:10.1093/bioadv/vbac049 · Cited by 10
TPD: a web tool for tipping-point detection based on dynamic network biomarker
Chen, P., Zhong, J., Yang, K., Zhang, X., Chen, Y., & Liu, R. (2022) · Briefings in Bioinformatics · doi:10.1093/bib/bbac399 · Cited by 11
Su, Y., Yu, Z., Yang, Y., Wong, K., & Li, X. (2024) · Advanced Science · doi:10.1002/advs.202307280 · Cited by 10
Raharinirina, N. A., Peppert, F., von Kleist, M., Schütte, C., & Sunkara, V. (2021) · Patterns · doi:10.1016/j.patter.2021.100332 · Cited by 10
Nakajima, N., Hayashi, T., Fujiki, K., Shirahige, K., Akiyama, T., Akutsu, T., & Nakato, R. (2021) · Nucleic Acids Research · doi:10.1093/nar/gkab601 · Cited by 10
“Regarding known marker genes, we identified 13 markers described in [44] and analysed which markers were”
BackgroundMethodResultInfluentialZhang, J., Shi, G. W., Pang, J., Zhu, X. Q., Feng, Q., Na, J., Ma, W., Liu, D., & Songyang, Z. (2023) · Stem Cell Research & Therapy · doi:10.1186/s13287-023-03290-y · Cited by 10
“In vitro differentiation assays Cells were seeded onto matrigel-coated plates at a density of 1–2 × 10⁴ cells/cm2 and cultured in differentiation media to derive endoderm or ectoderm cells as previously described [37, 38].”
MethodSelf-citationOptimal transport reveals dynamic gene regulatory networks via gene velocity estimation
Zhao, W., Larschan, E., Sandstede, B., & Singh, R. (2025) · PLoS Computational Biology · doi:10.1371/journal.pcbi.1012476 · Cited by 12
“…performance of OTVelo on five standard benchmarks from BEELINE [16] and STREAM-LINE [38], namely, mouse hematopietic stem cells (mHSC [39]), mouse embryonic stem cells (mESC [40]), mouse dendritic cells (mDC [41]), human mature hepatocytes (hHEP [42]), and human embryonic stem cells (hESC [43]).”
EnTSSR: A Weighted Ensemble Learning Method to Impute Single-Cell RNA Sequencing Data
Lü, F., Lin, Y., Yuan, C., Zhang, X.-F., & Ou-Yang, L. (2021) · IEEE Transactions on Computational Biology and Bioinformatics · doi:10.1109/tcbb.2021.3110850 · Cited by 9
“[31] to evaluate the performance of various imputation methods.”
BackgroundYao, Z., Li, M., & Lv, G. (2023) · Frontiers in Immunology · doi:10.3389/fimmu.2023.1058296 · Cited by 10
Shojaee, A., & Huang, S. C. (2023) · Briefings in Bioinformatics · doi:10.1093/bib/bbad370 · Cited by 11
Recurrent Neural Network for Gene Regulation Network Construction on Time Series Expression Data
Zhao, Y., Joshi, P., & Shin, D. (2019) · IEEE International Conference on Bioinformatics and Biomedicine (BIBM) · doi:10.1109/bibm47256.2019.8983068 · Cited by 9
“The third dataset was a scRNASeq time course derived from definitive endoderm (DE) cells differentiated from human ES cells [19].”
BackgroundBacher, R. L., Chu, L., Argus, C., Bolin, J. M., Knight, P., Thomson, J. A., Stewart, R. M., & Kendziorski, C. M. (2021) · Nucleic Acids Research · doi:10.1093/nar/gkab1071 · Cited by 10
“The Chu et al. (31) data was obtained from the Gene Expression Omnibus (GEO) with the accession number GSE75748.”
BackgroundMethodSelf-citationAccurate and interpretable gene expression imputation on scRNA-seq data using IGSimpute
Xu, K., Cheong, C., Veldsman, W. P., Lü, A., Cheung, W. K., & Zhang, L. (2023) · Briefings in Bioinformatics · doi:10.1093/bib/bbad124 · Cited by 9
Applications of single‐cell sequencing for the field of otolaryngology: A contemporary review
Pyle, M. P., & Hoa, M. (2020) · Laryngoscope Investigative Otolaryngology · doi:10.1002/lio2.388 · Cited by 9
Zheng, X. K., Huang, Y., & Zou, X. (2020) · PLoS Computational Biology · doi:10.1371/journal.pcbi.1007471 · Cited by 9
“Dataset 3 contains data from 758 cells sequenced at 0, 12, 24, 36, 72 and 96 h. Dataset 3 was derived from human ES cells differentiating to definitive endoderm cells [7].”
MethodGraph-Regularized Non-Negative Matrix Factorization for Single-Cell Clustering in scRNA-Seq Data
Jiang, H.-J., Wang, M.-N., Huang, Y., & Huang, Y. (2024) · IEEE Journal of Biomedical and Health Informatics · doi:10.1109/jbhi.2024.3400050 · Cited by 8
Gao, Z., Su, Y., Tang, J., Jin, H., Ding, Y., Cao, R., Wei, P.-J., & Chun-Hou, Z. (2025) · Briefings in Bioinformatics · doi:10.1093/bib/bbaf118 · Cited by 10
“These cell types are: human embryonic stem cells (hESC) [30], hHEP [31], mouse dendritic cells (mDC) [32], mouse embryonic stem cells (mESC) [33], mouse hematopoietic stem cells of the erythroid-lineage (mHSC-E) [34],granulocyte-monocyte-lineage (mHSC-GM) [34], and lymphoid-lineage (mHSC-L) [34].”
Effective single-cell clustering through ensemble feature selection and similarity measurements
Jeong, H., & Khunlertgit, N. (2020) · Computational Biology and Chemistry · doi:10.1016/j.compbiolchem.2020.107283 · Cited by 8
Wang, Y., Lee, H., Fear, J. M., Berger, I., Oliver, B., & Przytycka, T. M. (2022) · Communications Biology · doi:10.1038/s42003-022-04226-7 · Cited by 8
Improving the performance of single-cell RNA-seq data mining based on relative expression orderings
Chen, Y., Zhang, H., & Sun, X. S. (2022) · Briefings in Bioinformatics · doi:10.1093/bib/bbac556 · Cited by 8
“We performed cell marker analysis based on our DRM on the Chu-type dataset [21].”
BackgroundMethodInfluentialEnsInfer: a simple ensemble approach to network inference outperforms any single method
Shen, B., Coruzzi, G. M., & Shasha, D. E. (2023) · BMC Bioinformatics · doi:10.1186/s12859-023-05231-1 · Cited by 9
“The training and testing sets came from a ChiP-Seq network consisting of 130 TFs and 3144 regulatory edges [28].”
MethodA Bayesian factorization method to recover single-cell RNA sequencing data
Wen, Z.-H., Langsam, J. L., Zhang, L., Shen, W., & Zhou, X. (2021) · Cell Reports Methods · doi:10.1016/j.crmeth.2021.100133 · Cited by 8
“In addition to the DE analysis, we also used the time course scRNA-seq data [2] from the same Chu et al study to show Bfimpute improved gene expressions temporal dynamics through pseudotime analysis.”
BackgroundMethodInfluentialQuantifying Cellular Pluripotency and Pathway Robustness Through Forman-Ricci Curvature
Murgas, K. A., Saucan, E., & Sandhu, R. (2021) · Studies in computational intelligence · doi:10.1007/978-3-030-93413-2_51 · Cited by 8
Feng, H., Cottrell, S., Hozumi, Y., & Wei, G. (2024) · Computers in Biology and Medicine · doi:10.1016/j.compbiomed.2024.108211 · Cited by 8
“According to [45] hour data is consistent with the finding that cells from 72th hour and 96th hour were relatively homogeneous [45].”
ResultSingle‐cell analyses to reveal hematopoietic stem cell fate decisions
Lunger, I., Fawaz, M., & Rieger, M. A. (2017) · FEBS Letters · doi:10.1002/1873-3468.12712 · Cited by 9
Characterizing Human Cell Types and Tissue Origin Using the Benford Law
Morag, S., & Salmon‐Divon, M. (2019) · Cells · doi:10.3390/cells8091004 · Cited by 8
“[20], used in this study, indicating the number of single cells within each cell type.”
MethodCollaborative Structure-Preserved Missing Data Imputation for Single-Cell RNA-Seq Clustering
Gao, H., Shen, W., Li, R., Liu, C., & Wu, S. (2024) · IEEE Transactions on Computational Biology and Bioinformatics · doi:10.1109/tcbb.2024.3404013 · Cited by 8
Inference of single-cell network using mutual information for scRNA-seq data analysis
Chang, L.-Y., Hao, T.-Y., Wang, W., & Lin, C. (2024) · BMC Bioinformatics · doi:10.1186/s12859-024-05895-3 · Cited by 7
“The indispensable vital organs in adults, such as the trachea, lungs, liver, pancreas, and thyroid, are all derived from the definitive endoderm [32, 49, 50].”
BackgroundMethodInfluentialApproaches for Benchmarking Single-Cell Gene Regulatory Network Methods
Karamveer, K., & Uzun, Y. (2024) · Bioinformatics and Biology Insights · doi:10.1177/11779322241287120 · Cited by 9
“Five different single-cell RNA-seq data sets, 3 in mouse (mHSCs, 132 mESC, 135 and Mouse dendritic cells 136 ) and 2 in human (hHEPs 138 and hESCs 137 ) containing a total of 7 cell types across these data sets.”
AcImpute: a constraint-enhancing smooth-based approach for imputing single-cell RNA sequencing data
Zhang, W., Liu, T., Zhang, H., & Li, Y. (2025) · Bioinformatics · doi:10.1093/bioinformatics/btae711 · Cited by 7
Ultralow‐Dimensionality Reduction for Identifying Critical Transitions by Spatial‐Temporal PCA
Chen, P., Suo, Y., Aihara, K., Li, Y., Wu, D., Liu, R., & Chen, L. (2025) · Advanced Science · doi:10.1002/advs.202408173 · Cited by 7
“The identified critical transition is validated by the experimental observation, that is, such signal is notably earlier than the typical emergence of DE cells around days 4 or 5 in established human pluripotent stem cell protocols ( 67 ).”
KEGNI: knowledge graph enhanced framework for gene regulatory network inference
Li, P., Li, L., Nan, J., Chen, J., Sun, J., & Cao, Y. (2025) · Genome biology · doi:10.1186/s13059-025-03780-7 · Cited by 7
“…genes dataset), (4) hHep: human mature hepatocytes (425 cells, 948 genes in the TFs + 500 genes dataset, 1448 genes in the TFs + 1000 genes dataset) [79], and (5) hESC: human embryonic stem cells (758 cells, 910 genes in the TFs + 500 genes dataset, 1410 genes in the TFs + 1000 genes dataset) [80].”
Liu, P., & Li, J. J. (2025) · Nature Communications · doi:10.1038/s41467-025-63626-5 · Cited by 7
“Applications of mcRigor to real datasets show that removing dubious metacells detected by mcRigor signi fi cantly enhances down-stream analyses, such as gene co-expression studies and enhancer-gene regulatory inference.”
Ni, X., Geng, B., Zheng, H., Shi, J., Hu, G., & Gao, J. (2021) · IEEE Transactions on Computational Biology and Bioinformatics · doi:10.1109/tcbb.2021.3112951 · Cited by 7
“dataset: There are four experiments derived from [21] called Chu1, Chu2, Chu3, and Chu4.”
MethodInfluentialscWMC: weighted matrix completion-based imputation of scRNA-seq data via prior subspace information
Su, Y., Wang, F., Zhang, S., Liang, Y., Wong, K., & Li, X. (2022) · Bioinformatics · doi:10.1093/bioinformatics/btac570 · Cited by 7
scRecover : Discriminating True and False Zeros in Single‐Cell RNA ‐Seq Data for Imputation
Miao, Z., Lin, X., Li, J., Ho, J., Meng, Q., & Zhang, X. (2025) · Statistics in Medicine · doi:10.1002/sim.10334 · Cited by 7
“The SMART-seq dataset contains pluripotent stem cells [32] with labels marked by fluorescence-activated cell sorting (FACS).”
Single-cell entropy network detects the activity of immune cells based on ribosomal protein genes
Jin, Q., Zuo, C., Cui, H., Li, L., Yang, Y., Dai, H., & Chen, L. (2022) · Computational and Structural Biotechnology Journal · doi:10.1016/j.csbj.2022.06.056 · Cited by 7
Models of Congenital Adrenal Hyperplasia for Gene Therapies Testing
Glazova, O., Bastrich, A., Deviatkin, A. A., Onyanov, N., Kaziakhmedova, S., Shevkova, L., Sakr, N., Petrova, D., Vorontsova, M. V., & Volchkov, P. (2023) · International Journal of Molecular Sciences · doi:10.3390/ijms24065365 · Cited by 7
“Using this approach [69], KLF8 was identified as responsible for the transition from mesendoderm to endodermal progenitor cells.”
BackgroundReagor, C. C., Velez-Angel, N., & Hudspeth, A. J. (2023) · PNAS Nexus · doi:10.1093/pnasnexus/pgad113 · Cited by 6
Non-linear Normalization for Non-UMI Single Cell RNA-Seq
Wu, Z. J., Su, K., & Wu, H. (2021) · Frontiers in Genetics · doi:10.3389/fgene.2021.612670 · Cited by 7
“The fourth data set (GEO accession number GSE75748) comes from a time course experiment that measured hESC cells at different time points, including 758 cells, and is referred to as the “time course" data (Chu et al., 2016).”
BackgroundAkiyama, T., Wakabayashi, S., Soma, A., Sato, S., Nakatake, Y., Oda, M., Murakami, M., Sakota, M., Chikazawa-Nohtomi, N., Ko, S. B. H., et al. (2017) · Stem Cells International · doi:10.1155/2017/7215010 · Cited by 7
Otte, J., Wruck, W., & Adjaye, J. (2017) · FEBS Letters · doi:10.1002/1873-3468.12716 · Cited by 8
Shrivastava, H., Zhang, X., Aluru, S., & Song, L. (2020) · bioRxiv (Cold Spring Harbor Laboratory) · doi:10.1101/2020.04.23.058149 · Cited by 7
“…on seven datasets from five experiments which include human mature hepatocytes (hHEP) (Camp et al. , 2017) , human embryonic stem cells (hESC) (Chu et al. , 2016), mouse embryonic stem cells (mESC) (Hayashi et al. , 2018), mouse dendritic cells (mDC) (Shalek et al. , 2014), and three…”
BackgroundBai, L., Jin, X., & Chan, H. M. (2023) · Archives of Toxicology · doi:10.1007/s00204-023-03580-7 · Cited by 6
Learning Pathway Dynamics from Single‐Cell Proteomic Data: A Comparative Study
Verrou, K., Tsamardinos, I., & Παπουτσόγλου, Γ. (2020) · Cytometry Part A · doi:10.1002/cyto.a.23976 · Cited by 6
A kernel non-negative matrix factorization framework for single cell clustering
Jiang, H., Yi, M., & Zhang, S. (2020) · Applied Mathematical Modelling · doi:10.1016/j.apm.2020.08.065 · Cited by 6
Correlation Imputation for Single-Cell RNA-seq
Gan, L., Vinci, G., & Allen, G. I. (2022) · Journal of Computational Biology · doi:10.1089/cmb.2021.0403 · Cited by 6
“We use three human scRNA-seq data sets in this simulation study: 1. chu: human embryonic stem cells (Chu et al., 2016).”
P-CSN: single-cell RNA sequencing data analysis by partial cell-specific network
Wang, Y., Xuan, C., HanWen, W., Zhang, B., Ding, T., & Gao, J. (2023) · Briefings in Bioinformatics · doi:10.1093/bib/bbad180 · Cited by 6
Gogolewski, K., Sykulski, M., Chung, N. C., & Gambin, A. (2019) · Journal of Computational Biology · doi:10.1089/cmb.2018.0255 · Cited by 6
“Some of biological applications include tracking definitive endoderm cells (DfE) to explain their linage from embryonic stem cells (Chu et al., 2016), classifying sensory neuron types (Usoskin et al., 2015), and identifying potentially damaged cells (Ilicic et al., 2016).”
Reproducibility across single-cell RNA-seq protocols for spatial ordering analysis
Seirup, M., Chu, L., Sengupta, S., Leng, N., Browder, H., Kapadia, K., Shafer, C. M., Duffin, B. M., Elwell, A. L., Bolin, J. M., et al. (2020) · PLoS ONE · doi:10.1371/journal.pone.0239711 · Cited by 6
Self-citationMbadhi, M. N., Tang, J., & Zhang, J. (2021) · Frontiers in Cell and Developmental Biology · doi:10.3389/fcell.2021.759237 · Cited by 6
“Transcriptional regulators, including Nanog, Oct4, and Sox2 that maintain the pluripotency of stem cells, must be deactivated for cellular differentiation to occur (Wang et al., 2012; Chu et al., 2016).”
BackgroundSelf-citationQu, S., Liang, Y., Fang, B., Ye, S., Li, P., Ge, S., Wu, J. H., Qu, D., & Song, H. (2017) · Life Sciences · doi:10.1016/j.lfs.2017.03.017 · Cited by 6
“5% O2) compromised cell proliferation and survival [31].”
BackgroundZhang, W., & Guo, Z. (2025) · Expert Systems with Applications · doi:10.1016/j.eswa.2025.129827 · Cited by 6
Wang, Y., Zhou, F., & Guan, J. (2024) · Bioinformatics · doi:10.1093/bioinformatics/btae433 · Cited by 5
“…by Chen et al. (2021), including datasets of 5G6GR mouse embryonic stem cells [mESC (2)] (Hayashi et al. 2018), human embryonic stem cells (hESC) (Chu et al. 2016), and the three lineages of mouse hematopoietic stem cells (mHSC) including mHSC-E, mHSC-GM, and mHSC-L (Nestorowa et al. 2016).”
COFFEE: consensus single cell-type specific inference for gene regulatory networks
Lodi, M. K., Chernikov, A., & Ghosh, P. (2024) · Briefings in Bioinformatics · doi:10.1093/bib/bbae457 · Cited by 4
“Pseudotime was calculated using Slingshot with Day 0 as the starting cluster and Day 21 as the ending cluster [9]. hESCs [32] Timecourse scRNA-seq experiment from 758 cells using the differentiation protocol in order to produce definitive endoderm cells from human embryonic stem cells, measured at…”
MethodTRENDY: gene regulatory network inference enhanced by transformer
Tian, X., Patel, Y., & Wang, Y. (2025) · Bioinformatics · doi:10.1093/bioinformatics/btaf314 · Cited by 6
“THP-1 data set measures monocytic THP-1 human myeloid leukemia cells (Kouno et al. 2013). hESC data set measures human embryonic stem cell-derived progenitor cells (Chu et al. 2016).”
Xiao, T., Zhang, Q., Zhang, W., & Zou, X. (2019) · Mathematical Biosciences & Engineering · doi:10.3934/mbe.2019294 · Cited by 5
“It has also been suggested that KLF8 functions as a promoter of DE cells by upregulating many other DE cell marker genes, such as CXCR4 [5].”
BackgroundMethodInfluentialA compositional model to assess expression changes from single-cell RNA-seq data
Ma, X., Korthauer, K. D., Kendziorski, C. M., & Newton, M. A. (2021) · The Annals of Applied Statistics · doi:10.1214/20-aoas1423 · Cited by 4
Self-citationRegulatory network-based imputation of dropouts in single-cell RNA sequencing data
Leote, A. C., Wu, X., & Beyer, A. (2022) · Kölner Universitäts PublikationsServer (Universität zu Köln) · Cited by 5
U‐CIE [/juː ‘siː/]: Color encoding of high‐dimensional data
Koutrouli, M., Morris, J. H., & Jensen, L. J. (2022) · Protein Science · doi:10.1002/pro.4388 · Cited by 5
“The ‘Single cells’ track uses a single-cell RNA-seq dataset of human embryonic stem cells (GEO accession code GSE75748) [14].”
BackgroundQi, J., Sheng, Q., Zhou, Y., Hua, J., Xiao, S., & Jin, S. (2022) · Cell & Bioscience · doi:10.1186/s13578-022-00886-4 · Cited by 5
“We performed a differential expression analysis for the Chu (Time Course) dataset [31] containing the scRNA-seq expression matrix and the matched bulk RNA-seq expression matrix.”
MethodVinogradov, A. E., & Anatskaya, O. V. (2022) · International Journal of Molecular Sciences · doi:10.3390/ijms231911486 · Cited by 5
“The databases were GSE75748 (two datasets: ‘cell type’ and ‘time course’) [46], GSE123899 [47], GSE90749 (two datasets: ‘hepatocyte-like’ and ‘white adipocytes’) (unpublished), GSE36552 [48], E-MTAB-3929 [49], and GSE81252 [50].”
Lee, S., Deng, L., Wang, Y., Wang, K., Sartor, M. A., & Wang, X. (2023) · Bioinformatics · doi:10.1093/bioinformatics/btad325 · Cited by 5
“The second scRNAseq dataset is GSE75748 that profiled four lineage-specific progenitor cells derived from human embryonic stem cells (hESCs) (Chu et al. 2016).”
BackgroundZhao, J., Wong, C.-W., Ching, W., & Cheng, X. (2023) · Briefings in Bioinformatics · doi:10.1093/bib/bbad369 · Cited by 5
da Silva, J. E. H., de Carvalho, P. C., Camata, J. J., de Oliveira, I. L., & Bernardino, H. S. (2024) · Biosystems · doi:10.1016/j.biosystems.2024.105126 · Cited by 5
Liu, W., Teng, Z., Li, Z., & Chen, J. (2024) · Interdisciplinary Sciences Computational Life Sciences · doi:10.1007/s12539-024-00633-y · Cited by 6
“The scRNA-seq datasets are provided on Gene Expression Omnibus with GSE81252 (hHEP) [37, 48], GSE75748 (hESC) [36], GSE98664(mESC) [39], GSE48968 (mDC) [38] and GSE81682 (mHSC) [40].”
Peng, H., Fan, W., Fang, C., Gao, W., & Li, Y. (2021) · Computational and Mathematical Methods in Medicine · doi:10.1155/2021/6842752 · Cited by 5
Huang, M., Ye, X., Li, H., & Sakurai, T. (2022) · Frontiers in Genetics · doi:10.3389/fgene.2022.952649 · Cited by 5
Sperm Originated Chromatin Imprints and LincRNAs in Organismal Development and Cancer
Subhash, S., Kanduri, M., & Kanduri, C. (2020) · iScience · doi:10.1016/j.isci.2020.101165 · Cited by 5
Chawla, S., Samydurai, S., Kong, S. L., Wang, Z., Tam, W. L., Sengupta, D., & Kumar, V. (2019) · bioRxiv (Cold Spring Harbor Laboratory) · doi:10.1101/864389 · Cited by 5
Quality assessment of single-cell RNA sequencing data by coverage skewness analysisPreprint
Abugessaisa, I., Noguchi, S., Cardon, M., Hasegawa, A., Watanabe, K., Takahashi, M., Suzuki, H., Katayama, S., Kere, J., & Kasukawa, T. (2019) · bioRxiv (Cold Spring Harbor Laboratory) · doi:10.1101/2019.12.31.890269 · Cited by 5
“As another example, we compared the human datasets GSE75748[28] (Fig.”
BackgroundMethodResultInfluentialGao, Y., Li, L., Amos, C. I., & Li, W. (2020) · bioRxiv (Cold Spring Harbor Laboratory) · doi:10.1101/2020.09.23.310649 · Cited by 5
“As a result, subpopulation 2 was characterized by higher expression of endoderm development marker genes including GATA6, EOMES, and SOX17 (Chu et al. 2016) (Fig.6f, Supplementary Table 3).”
BackgroundMethodInfluentialBabarinde, I. A., Fu, X., Ma, G., Li, Y., Liang, Z., Xu, J., Xiao, Z., Qiao, Y., Zheng, L., Oleynikova, K., et al. (2025) · Nature Communications · doi:10.1038/s41467-025-63080-3 · Cited by 6
DNFE: Directed network flow entropy for detecting tipping points during biological processes
Peng, X., Qiao, R., Li, P., & Chen, L. (2025) · PLoS Computational Biology · doi:10.1371/journal.pcbi.1013336 · Cited by 5
Robust scRNA-seq Cell Types Identification by Self-Guided Deep Clustering Network
Wang, Y., & Wang, M. (2024) · IEEE Access · doi:10.1109/access.2024.3394038 · Cited by 4
“4) Embryonic stem: This dataset represents scRNA-seq data from the differentiation process of embryonic stem cells to definitive endoderm cells [41].”
BackgroundWENDY: Covariance dynamics based gene regulatory network inference
Wang, Y., Zheng, P., Cheng, Y., Wang, Z., & Aravkin, A. Y. (2024) · Mathematical Biosciences · doi:10.1016/j.mbs.2024.109284 · Cited by 4
Clair‐Glover, M. S., Yousuf, A., Kaul, D., Dottori, M., & Adams, D. J. (2025) · Journal of Neurochemistry · doi:10.1111/jnc.70004 · Cited by 4
Zhu, X., Zhao, L., Teng, F., Meng, S., & Xie, M. (2025) · Interdisciplinary Sciences Computational Life Sciences · doi:10.1007/s12539-025-00702-w · Cited by 5
Narad, P., Anand, L., Gupta, R., & Sengupta, A. (2018) · Scientific Reports · doi:10.1038/s41598-018-29480-w · Cited by 4
JOINT for large-scale single-cell RNA-sequencing analysis via soft-clustering and parallel computing
Cui, T., & Wang, T. (2021) · BMC Genomics · doi:10.1186/s12864-020-07302-6 · Cited by 4
Li, J., Yang, F., Wang, F., Rong, Y., Zhao, P., Chen, S., Yao, J., Tang, J., & Guo, F. (2022) · IEEE International Conference on Bioinformatics and Biomedicine (BIBM) · doi:10.1109/bibm55620.2022.9995287 · Cited by 4
“And the hESC dataset is from the study of [19], which conducts single-cell RNA-sequencing on human embryonic stem cells and reveals novel regulators of the mesendoderm transition to definitive endoderm.”
BackgroundWang, Y., Liu, C., Xu, Q., Han, X., & Liu, Z.-P. (2023) · Biochimica et Biophysica Acta (BBA) - Gene Regulatory Mechanisms · doi:10.1016/j.bbagrm.2023.194911 · Cited by 4
FEED: a feature selection method based on gene expression decomposition for single cell clustering
Zhang, C., Duan, Z.-W., Xu, Y., Liu, J., & Li, H. (2023) · Briefings in Bioinformatics · doi:10.1093/bib/bbad389 · Cited by 4
The past, present, and future promise of pluripotent stem cells
Seo, J., Saha, S., & Brown, M. E. (2024) · Journal of Immunology and Regenerative Medicine · doi:10.1016/j.regen.2024.100077 · Cited by 4
Cell-specific gene association network construction from single-cell RNA sequence
Azim, R., & Wang, S. (2021) · Cell Cycle · doi:10.1080/15384101.2021.1978265 · Cited by 4
Regulatory network-based imputation of dropouts in single-cell RNA sequencing dataPreprint
Leote, A. C., Wu, X., & Beyer, A. (2019) · bioRxiv (Cold Spring Harbor Laboratory) · doi:10.1101/611517 · Cited by 4
Comparison of Dimensionality Reduction and Clustering Methods for Single-Cell Transcriptomics DataPreprint
Pandit, V., Swain, A. K., & Yadav, P. (2022) · bioRxiv (Cold Spring Harbor Laboratory) · doi:10.1101/2022.10.15.512334 · Cited by 4
“The Chu dataset contains transcriptomic data of individual pluripotent stem cells [23].”
Backgroundda Silva, J. E. H., Bernardino, H. S., de Oliveira, I. L., & Camata, J. J. (2025) · Biosystems · doi:10.1016/j.biosystems.2025.105464 · Cited by 4
FatePredictor: Cell fate decision-making prediction with an ensemble deep learning model
Shen, J., Chen, N., Niu, B., Zhong, J., & Liu, R. (2025) · The Innovation · doi:10.1016/j.xinn.2025.101010 · Cited by 4
“27 As illustrated in Figure 6A, the differentiation of hESCs into DECs is divided into five distinct pseudotime stages: pseudotime 0–1 (12 h), pseudotime 1–2 (24 h), and three additional pseudotimes at 36, 72, and 96 h, with a cell fate decision-making occurring at the transition between pseudotime…”
Nishimura, T., Kimura, K., Igarashi, K. J., Shishida, K., Sugisaki, H., Tsukamoto, M., Balakumar, A., Funamoto, C., Hirabayashi, M., Kol, A., et al. (2025) · Stem Cell Reports · doi:10.1016/j.stemcr.2025.102640 · Cited by 3
Deciphering splicing heterogeneity at single-cell resolution by SCSES
Xiao, W., Lv, X., Guo, D. H., Han, N., Zhou, L., Wang, P., & Liu, Z. (2025) · Nature Communications · doi:10.1038/s41467-025-64517-5 · Cited by 6
Zhang, D., Liu, Z., & Gao, R. (2025) · Briefings in Bioinformatics · doi:10.1093/bib/bbaf621 · Cited by 3
“To demonstrate LogicSR’s capacity to recover master regulators, we applied LogicSR to a human ES cell dataset, which contains cells developing from human ES cells to induced definitive endoderm (DE) cells at 0, 12, 24, 36, 72, and 96 h of differentiation [56].”
Liu, J., Li, Z., Liu, G., Pei, Z., Liu, W. G., Yang, W., Li, F., & Huo, L. (2025) · Chinese Medical Journal · doi:10.1097/cm9.0000000000003966 · Cited by 3
Transcriptomic Profile of Directed Differentiation of iPSCs into Hepatocyte-like Cells
Panchuk, I., Kovalskaia, V. A., Kochergin-Nikitsky, K. S., Yakushina, V. D., Balinova, N., Рыжкова, О. П., Лавров, А. В., & Smirnikhina, S. (2026) · International Journal of Molecular Sciences · doi:10.3390/ijms27020633 · Cited by 3
“The progressive upregulation metabolic genes SERPINA1 and UGT2B15 during differentiation confirms that the organoids achieved elevated expression of some hepatocyte-associated genes (Figure 7) [10,18,19,25].”
SPSID: A Single-Parameter Shrinkage Inverse-Diffusion for Denoising Gene-Regulatory Networks
Chen, H., Han, G., Ding, W., & Grazian, C. (2026) · IEEE Journal of Biomedical and Health Informatics · doi:10.1109/jbhi.2026.3674779 · Cited by 4
scZiva: imputation method for single-cell RNA-seq data with zero-inflated variational autoencoder
Vo, L. T., Le, V. V., Ha, Q. T., & Nguyen, A. H. G. ;. (2026) · BMC Bioinformatics · doi:10.1186/s12859-026-06422-2 · Cited by 3
“This experiment is performed on a real dataset available from the GEO database under the Series accession number GSE75748 [40].”
Tsukamoto, M., Kimura, K., Yoshida, T., Sugiura, K., & Hatoya, S. (2022) · Regenerative Therapy · doi:10.1016/j.reth.2022.10.002 · Cited by 3
“Because PSCs pass through the mesendoderm stage, which is in a bipotent state, into DE and mesodermal lineages [2], the development of the cardiac lineage from ciPSCs indicated that some cells differentiated toward the mesoderm at the DE stage.”
BackgroundGong, L., Xiong, C., Liu, Y., Cai, L., & Gao, Z. (2024) · Computers in Biology and Medicine · doi:10.1016/j.compbiomed.2024.108225 · Cited by 3
Intoh, A., Watanabe-Susaki, K., Kato, T., Kiritani, H., & Kurisaki, A. (2024) · Stem Cells Translational Medicine · doi:10.1093/stcltm/szae036 · Cited by 4
Metadata
- Authors
- Chu, L.-F., Leng, N., Zhang, J., Hou, Z., Mamott, D., Vereide, D. T., Choi, J., Kendziorski, C., Stewart, R., & Thomson, J. A.
- Affiliations
- Morgridge Institute for Research (US)
- Genentech (US)
- Harvard University (US)
- University of Wisconsin–Madison (US)
- Corresponding author
- Chu, Li-Fang
- Thomson, James A.
- ORCID
- Venue
- Genome Biology
- Published
- 2016-08-17
- Volume
- 17
- Issue
- 1
- Pages
- 173-173
- ISSN
- 1465-6906 (ISSN-L)
- 1474-760X
- PMC
- PMC4989499
- OpenAlex
- W2511896561
- Cited by
- 477
- References
- 83
- Citations by year
- 2026: 41 · 2025: 52 · 2024: 71 · 2023: 48 · 2022: 61 · 2021: 66 · 2020: 49 · 2019: 39 · 2018: 21 · 2017: 22 · 2016: 5
- FWCI
- 15.07
- Type
- journal article
- Language
- en
- Open access
- gold
- doi.org
- Locations
- Genome biology (publishedVersion, cc-by)
- Europe PMC (PubMed Central) (publishedVersion, cc-by)
- PubMed Central (publishedVersion, cc-by)
- PubMed (publishedVersion)
- Digital Access to Scholarship at Harvard (DASH) (Harvard University) (submittedVersion, cc-by)
- Funders
- National Institutes of Health (4UH3TR000506-03, 5U01HL099773-06, GM102756, U54 AI117924)
- Topics
- Life Sciences › Biochemistry, Genetics and Molecular Biology › Molecular Biology › Pluripotent Stem Cells Research
- Life Sciences › Biochemistry, Genetics and Molecular Biology › Molecular Biology › Developmental Biology and Gene Regulation
- Life Sciences › Biochemistry, Genetics and Molecular Biology › Molecular Biology › Single-cell and spatial transcriptomics
- Keywords
- definitive endoderm differentiation, human embryonic stem cells, mesendoderm, lineage specification, hypoxia, KLF8, Brachyury, CXCR4, cell fate determination, pluripotency exit
- MeSH terms
- Human Embryonic Stem Cells, Cell Differentiation, Endoderm, Humans, RNA, Gene Expression Regulation, Developmental, Cell Culture Techniques, Hepatocytes, Pluripotent Stem Cells, Single-Cell Analysis, High-Throughput Nucleotide Sequencing
About these checks
Registry, retraction, Cites and statistics results are computed, not judged, with one exception: a printed reference that no index lists is read once by a model before it counts as a citation error. Claims are extracted by a model and kept only when their quote appears verbatim in the text; each cited source is then checked, with a model’s help, for whether it says what the claim relies on. Those verdicts can be wrong — read the claim’s quote and the cited source before relying on one.
Statistics and arithmetic are recomputed, not judged.
Confidence bands are shown only for fields calibrated on our annotated test set. None is calibrated yet, so no band is shown.
What counts as a claim ›How we measure confidence ›How we check this ›
Are you an author, or do you see a problem with this page? Request a review
