

The DOI matches its Crossref record; 50 of the 51 references it cites were found in a registry or an index.
Robustness and applicability of transcription factor and pathway analysis tools on single-cell RNA-seq data
Open accessPublished version of a preprint
Abstract
Background: Many functional analysis tools have been developed to extract functional and mechanistic insight from bulk transcriptome data. With the advent of single-cell RNA sequencing (scRNA-seq), it is in principle possible to do such an analysis for single cells. However, scRNA-seq data has characteristics such as drop-out events and low library sizes. It is thus not clear if functional TF and pathway analysis tools established for bulk sequencing can be applied to scRNA-seq in a meaningful way. Results: To address this question, we perform benchmark studies on simulated and real scRNA-seq data. We include the bulk-RNA tools PROGENy, GO enrichment, and DoRothEA that estimate pathway and transcription factor (TF) activities, respectively, and compare them against the tools SCENIC/AUCell and metaVIPER, designed for scRNA-seq. For the in silico study, we simulate single cells from TF/pathway perturbation bulk RNA-seq experiments. We complement the simulated data with real scRNA-seq data upon CRISPR-mediated knock-out. Our benchmarks on simulated and real data reveal comparable performance to the original bulk data. Additionally, we show that the TF and pathway activities preserve cell type-specific variability by analyzing a mixture sample sequenced with 13 scRNA-seq protocols. We also provide the benchmark data for further use by the community. Conclusions: Our analyses suggest that bulk-based functional analysis tools that use manually curated footprint gene sets can be applied to scRNA-seq data, partially outperforming dedicated single-cell tools. Furthermore, we find that the performance of functional analysis tools is more sensitive to the gene sets than to the statistic used.
Overview
The claims and statistics of this paper haven’t been checked yet.
Run the check — free, no account needed. It reads the open-access text and checks the sources it cites.
Integrity signals
Registry
Cites
Statistics
Figures
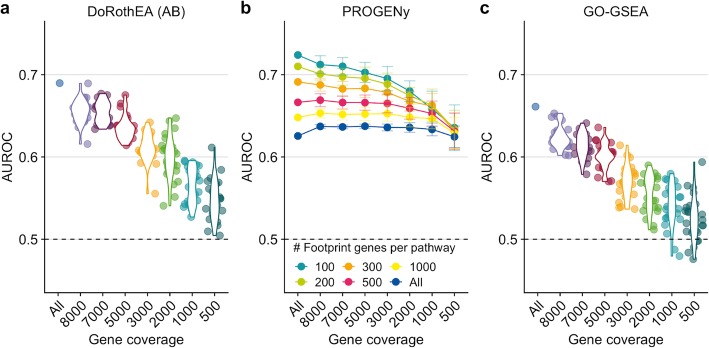
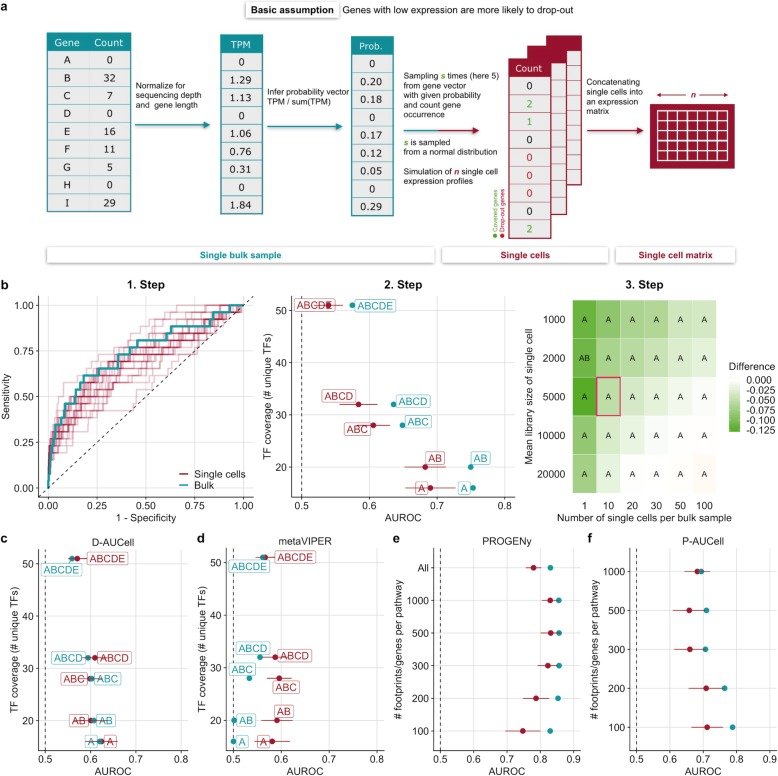
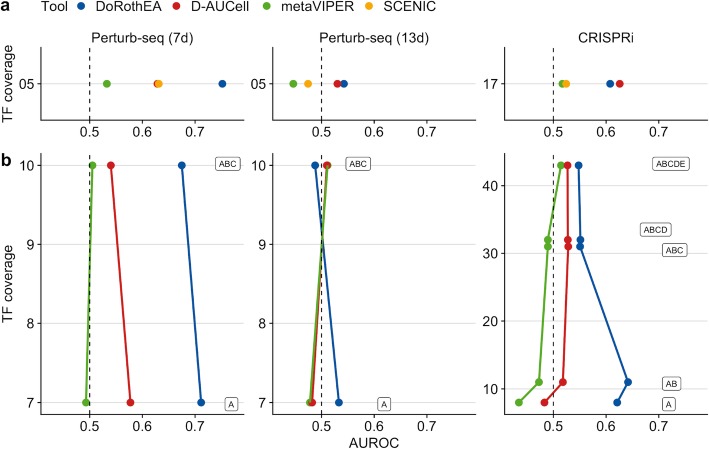
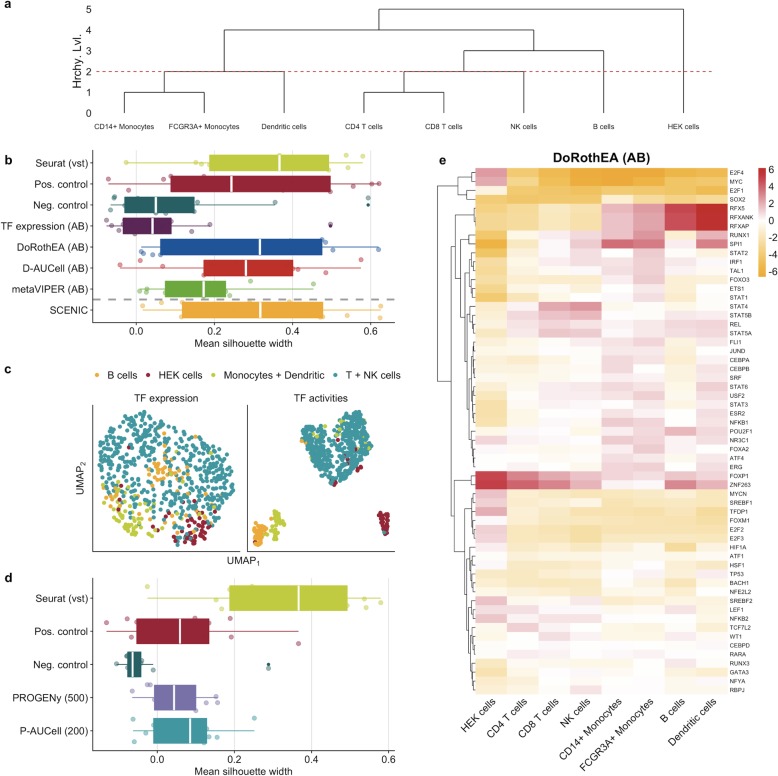
Verification
Claims the paper makes
The claims and statistics of this paper haven’t been checked yet.
Run the check — free, no account needed. It reads the open-access text and checks the sources it cites.
Claims other papers make about this one
Each is checked against this paper’s own text: does it say what the citing paper says it does?
In the citing paper
“Enrichment methods developed for bulk transcriptomics can be applied to scRNA-seq102”
From Best practices for single-cell analysis across modalities (2023) · cites this paper as [102]
In the citing paper
“Gene set enrichment analysis was found to be more sensitive to the choice of gene sets rather than statistical methods102”
From Best practices for single-cell analysis across modalities (2023) · cites this paper as [102]
Self-check
Percentages, sums and reported differences re-computed from the paper’s own numbers.
The self-check needs the paper’s full text.
Citations
Cites
R: A Language and Environment for Statistical Computing
R Core Team (2000) · doi:10.32614/r.manuals · Cited by 355,893
Subramanian, A., Tamayo, P., Mootha, V. K., Mukherjee, S., Ebert, B. L., Gillette, M. A., Paulovich, A., Pomeroy, S. L., Golub, T. R., Lander, E. S., et al. (2005) · Proceedings of the National Academy of Sciences · doi:10.1073/pnas.0506580102 · Cited by 53,625
Gene Ontology: tool for the unification of biology
Ashburner, M., Ball, C. A., Blake, J. A., Botstein, D., Butler, H., Cherry, J. M., Davis, A. P., Dolinski, K., Dwight, S. S., Eppig, J. T., et al. (2000) · Nature Genetics · doi:10.1038/75556 · Cited by 43,206
Robinson, M. D., McCarthy, D. J., & Smyth, G. K. (2010) · Bioinformatics · doi:10.1093/bioinformatics/btp616 · Cited by 41,364
limma powers differential expression analyses for RNA-sequencing and microarray studies
Ritchie, M. E., Phipson, B., Wu, D., Hu, Y., Law, C. W., Shi, W., & Smyth, G. K. (2015) · Nucleic Acids Research · doi:10.1093/nar/gkv007 · Cited by 40,458
Wickham, H., Averick, M., Bryan, J., Chang, W., McGowan, L., François, R., Grolemund, G., Hayes, A., Henry, L., Hester, J., et al. (2019) · Journal of Open Source Software · doi:10.21105/joss.01686 · Cited by 22,138
Silhouettes: A graphical aid to the interpretation and validation of cluster analysis
Rousseeuw, P. J. (1987) · Journal of Computational and Applied Mathematics · doi:10.1016/0377-0427(87)90125-7 · Cited by 21,392
The Molecular Signatures Database Hallmark Gene Set Collection
Liberzon, A., Birger, C., Thorvaldsdóttir, H., Ghandi, M., Mesirov, J. P., & Tamayo, P. (2015) · Cell Systems · doi:10.1016/j.cels.2015.12.004 · Cited by 13,807
Gene Expression Omnibus: NCBI gene expression and hybridization array data repository
Edgar, R. (2002) · Nucleic Acids Research · doi:10.1093/nar/30.1.207 · Cited by 13,288
Integrating single-cell transcriptomic data across different conditions, technologies, and species
Butler, A., Hoffman, P., Smibert, P., Papalexi, E., & Satija, R. (2018) · Nature Biotechnology · doi:10.1038/nbt.4096 · Cited by 13,174
NF-κB signaling in inflammation
Liu, T., Zhang, L., Joo, D., & Sun, S.-C. (2017) · Signal Transduction and Targeted Therapy · doi:10.1038/sigtrans.2017.23 · Cited by 8,791
Scenic: single-cell regulatory network inference and clustering.
Aibar, S., González-Blas, C. B., Moerman, T., Huynh-Thu, V. A., Imrichova, H., Hulselmans, G., Rambow, F., Marine, J.-C., Geurts, P., Aerts, J., et al. (2017) · Nature Methods · doi:10.1038/nmeth.4463 · Cited by 6,520
mRNA-Seq whole-transcriptome analysis of a single cell
Tang, F., Barbacioru, C., Wang, Y., Nordman, E., Lee, C., Xu, N., Wang, X., Bodeau, J., Tuch, B. B., Siddiqui, A., et al. (2009) · Nature Methods · doi:10.1038/nmeth.1315 · Cited by 3,969
Next-generation characterization of the Cancer Cell Line Encyclopedia
Ghandi, M., Huang, F. W., Jané-Valbuena, J., Kryukov, G. V., Lo, C. C., McDonald, E. R., Barretina, J., Gelfand, E. T., Bielski, C. M., Li, H., et al. (2019) · Nature · doi:10.1038/s41586-019-1186-3 · Cited by 3,394
Margolin, A. A., Nemenman, I., Basso, K., Wiggins, C., Stolovitzky, G., Favera, R. D., & Califano, A. (2006) · BMC Bioinformatics · doi:10.1186/1471-2105-7-s1-s7 · Cited by 2,420
Margolin, A. A., Nemenman, I. M., Basso, K., Wiggins, C. H., Stolovitzky, G. A., Favera, R. D., & Califano, A. (2006) · BMC Bioinformatics · doi:10.7916/d8g15zbp · Cited by 2,260
Dixit, A., Parnas, O., Li, B., Chen, J., Fulco, C. P., Jerby-Arnon, L., Marjanovic, N. D., Dionne, D., Burks, T., Raychowdhury, R., et al. (2016) · Cell · doi:10.1016/j.cell.2016.11.038 · Cited by 1,863
Ten Years of Pathway Analysis: Current Approaches and Outstanding Challenges
Khatri, P., Sirota, M., & Butte, A. J. (2012) · PLoS Computational Biology · doi:10.1371/journal.pcbi.1002375 · Cited by 1,635
A step-by-step workflow for low-level analysis of single-cell RNA-seq data
Lun, A. T. L., McCarthy, D. J., & Marioni, J. C. (2016) · F1000Research · doi:10.12688/f1000research.9501.1 · Cited by 1,551
Regev, A., Teichmann, S. A., Lander, E. S., Amit, I., Benoist, C. O., Birney, E., Bodenmiller, B., & al, E. (2017) · Zurich Open Repository and Archive (University of Zurich) · doi:10.5167/uzh-162597 · Cited by 1,457
Bayesian approach to single-cell differential expression analysis
Kharchenko, P. V., Silberstein, L., & Scadden, D. T. (2014) · Nature Methods · doi:10.1038/nmeth.2967 · Cited by 1,348
Computational and analytical challenges in single-cell transcriptomics
Stegle, O., Teichmann, S. A., & Marioni, J. C. (2015) · Nature Reviews Genetics · doi:10.1038/nrg3833 · Cited by 1,170
Self-citationChEA3: transcription factor enrichment analysis by orthogonal omics integration
Keenan, A. B., Torre, D., Lachmann, A., Leong, A. K., Wojciechowicz, M. L., Utti, V., Jagodnik, K. M., Kropiwnicki, E., Wang, Z., & Ma’ayan, A. (2019) · Nucleic Acids Research · doi:10.1093/nar/gkz446 · Cited by 1,136
Benchmark and integration of resources for the estimation of human transcription factor activities
Garcia-Alonso, L., Holland, C. H., Ibrahim, M. M., Turei, D., & Saez-Rodriguez, J. (2019) · Genome Research · doi:10.1101/gr.240663.118 · Cited by 1,122
Self-citationAlvarez, M. J., Shen, Y., Giorgi, F. M., Lachmann, A., Ding, B. B., Ye, B. H., & Califano, A. (2016) · Nature Genetics · doi:10.1038/ng.3593 · Cited by 966
Splatter: simulation of single-cell RNA sequencing data
Zappia, L., Phipson, B., & Oshlack, A. (2017) · Genome Biology · doi:10.1186/s13059-017-1305-0 · Cited by 905
A Novel Approach to High-Quality Postmortem Tissue Procurement: The GTEx Project
Carithers, L. J., Ardlie, K., Barcus, M., Branton, P. A., Britton, A., Buia, S. A., Compton, C. C., DeLuca, D. S., Peter-Demchok, J., Gelfand, E. T., et al. (2015) · Biopreservation and Biobanking · doi:10.1089/bio.2015.0032 · Cited by 833
Massive mining of publicly available RNA-seq data from human and mouse
Lachmann, A., Torre, D., Keenan, A. B., Jagodnik, K. M., Lee, H. J., Wang, L., Silverstein, M. C., & Ma’ayan, A. (2018) · Nature Communications · doi:10.1038/s41467-018-03751-6 · Cited by 701
Benchmarking single-cell RNA-sequencing protocols for cell atlas projects
Mereu, E., Lafzi, A., Moutinho, C., Ziegenhain, C., McCarthy, D. J., Álvarez-Varela, A., Batlle, E., Sagar, Grün, D., Lau, J. K., et al. (2020) · Nature Biotechnology · doi:10.1038/s41587-020-0469-4 · Cited by 499
Self-citationMcFarland, J. M., Ho, Z. V., Kugener, G., Dempster, J. M., Montgomery, P. G., Bryan, J. G., Krill-Burger, J., Green, T. M., Vazquez, F., Boehm, J., et al. (2018) · Nature Communications · doi:10.1038/s41467-018-06916-5 · Cited by 348
Gene set enrichment analysis: performance evaluation and usage guidelines
Hung, J., Yang, T.-H., Hu, Z., Weng, Z., & DeLisi, C. (2011) · Briefings in Bioinformatics · doi:10.1093/bib/bbr049 · Cited by 270
Pathway analysis using random forests classification and regression
Pang, H., Lin, A., Holford, M. E., Enerson, B. E., Lu, B., Lawton, M. P., Floyd, E., & Zhao, H. (2006) · Bioinformatics · doi:10.1093/bioinformatics/btl344 · Cited by 244
Identifying significantly impacted pathways: a comprehensive review and assessment
Nguyen, T., Shafi, A., Nguyen, T., & Drăghici, S. (2019) · Genome biology · doi:10.1186/s13059-019-1790-4 · Cited by 219
Biological plasticity rescues target activity in CRISPR knock outs
Smits, A. H., Ziebell, F., Joberty, G., Zinn, N., Mueller, W. F., Clauder-Münster, S., Eberhard, D., Fälth Savitski, M., Grandi, P., Jakob, P., et al. (2019) · Nature Methods · doi:10.1038/s41592-019-0614-5 · Cited by 219
Macrophage-specific gene functions in Spi1-directed innate immunity
Zakrzewska, A., Cui, C., Stockhammer, O. W., Benard, E. L., Spaink, H. P., & Meijer, A. H. (2010) · Blood · doi:10.1182/blood-2010-01-262873 · Cited by 201
Essaghir, A., Toffalini, F., Knoops, L., Kallin, A., van Helden, J., & Demoulin, J. (2010) · Nucleic Acids Research · doi:10.1093/nar/gkq149 · Cited by 196
Feng, X., Wang, H., Takata, H., Day, T. J., Willen, J., & Hu, H. (2011) · Nature Immunology · doi:10.1038/ni.2034 · Cited by 191
Transfer of regulatory knowledge from human to mouse for functional genomics analysis
Holland, C. H., Szalai, B., & Sáez-Rodríguez, J. (2019) · Biochimica et Biophysica Acta (BBA) - Gene Regulatory Mechanisms · doi:10.1016/j.bbagrm.2019.194431 · Cited by 143
Self-citationDing, H., Douglass, E. F., Sonabend, A. M., Mela, A., Bose, S., Gonzalez, C., Canoll, P., Sims, P. A., Alvarez, M. J., & Califano, A. (2018) · Nature Communications · doi:10.1038/s41467-018-03843-3 · Cited by 116
SCRABBLE: single-cell RNA-seq imputation constrained by bulk RNA-seq data
Peng, T., Zhu, Q., Yin, P., & Tan, K. (2019) · Genome biology · doi:10.1186/s13059-019-1681-8 · Cited by 104
Genga, R. M. J., Kernfeld, E. M., Parsi, K. M., Parsons, T. J., Ziller, M. J., & Maehr, R. (2019) · Cell Reports · doi:10.1016/j.celrep.2019.03.076 · Cited by 92
Discovering causal signaling pathways through gene-expression patterns
Parikh, J. R., Klinger, B., Xia, Y., Marto, J. A., & Blüthgen, N. (2010) · Nucleic Acids Research · doi:10.1093/nar/gkq424 · Cited by 69
Hegde, M., Strand, C., Hanna, R. E., & Doench, J. G. (2018) · PLOS ONE · doi:10.1371/journal.pone.0197547 · Cited by 66
Classification of gene signatures for their information value and functional redundancy
Cantini, L., Calzone, L., Martignetti, L., Rydenfelt, M., Blüthgen, N., Barillot, E., & Zinovyev, A. Y. (2017) · npj Systems Biology and Applications · doi:10.1038/s41540-017-0038-8 · Cited by 54
Footprint-based functional analysis of multiomic data
Dugourd, A., & Saez-Rodriguez, J. (2019) · Current Opinion in Systems Biology · doi:10.1016/j.coisb.2019.04.002 · Cited by 53
TRAIL-R1 and TRAIL-R2 Mediate TRAIL-Dependent Apoptosis in Activated Primary Human B Lymphocytes
Staniek, J., Lorenzetti, R., Heller, B., Janowska, I., Schneider, P., Unger, S., Warnatz, K., Seidl, M., Venhoff, N., Thiel, J., et al. (2019) · Frontiers in Immunology · doi:10.3389/fimmu.2019.00951 · Cited by 22
Burd, A. L., Ingraham, R. H., Goldrick, S. E., Kroe‐Barrett, R., Crute, J. J., & Grygon, C. A. (2004) · Biochemistry · doi:10.1021/bi030262o · Cited by 17
Trescher, S., Münchmeyer, J., & Leser, U. (2017) · BMC Systems Biology · doi:10.1186/s12918-017-0419-z · Cited by 13
Transfer of regulatory knowledge from human to mouse for functional genomic analysisPreprint
Holland, C. H., Szalai, B., & Sáez-Rodríguez, J. (2019) · bioRxiv (Cold Spring Harbor Laboratory) · doi:10.1101/532739 · Cited by 8
Self-citation
Research works printed but not linked: 1
- Sergushichev A. An algorithm for fast preranked gene set enrichment analysis using cumulative statistic calculation. bioRxiv. 2016:060012 [cited 2018 Jul 17]. Available from: https://www.biorxiv.org/content/early/2016/06/20/060012.abstract.
Cited by
Sorted by citations
Best practices for single-cell analysis across modalities
Heumos, L., Schaar, A. C., Lance, C., Litinetskaya, A., Drost, F., Zappia, L., Lücken, M. D., Strobl, D. C., Henao, J., Curion, F., et al. (2023) · Nature Reviews Genetics · doi:10.1038/s41576-023-00586-w · Cited by 1,051
“3).”
Self-citationdecoupleR: ensemble of computational methods to infer biological activities from omics data
(2022) · doi:10.1093/bioadv/vbac016 · Cited by 1,098
Self-citationDecoding myofibroblast origins in human kidney fibrosis
Kuppe, C., Ibrahim, M. M., Kranz, J., Zhang, X., Ziegler, S., Perales-Patón, J., Jansen, J., Reimer, K. C., Smith, J. R., Dobie, R., et al. (2021) · Nature · doi:10.1038/s41586-020-2941-1 · Cited by 769
Self-citationBenchmarking single-cell RNA-sequencing protocols for cell atlas projects
Mereu, E., Lafzi, A., Moutinho, C., Ziegenhain, C., McCarthy, D. J., Álvarez-Varela, A., Batlle, E., Sagar, Grün, D., Lau, J. K., et al. (2020) · Nature Biotechnology · doi:10.1038/s41587-020-0469-4 · Cited by 499
Self-citationSalcher, S., Sturm, G., Horvath, L., Untergasser, G., Kuempers, C., Fotakis, G., Panizzolo, E., Martowicz, A., Trebo, M., Pall, G., et al. (2022) · Cancer Cell · doi:10.1016/j.ccell.2022.10.008 · Cited by 503
Metadata
- Authors
- Holland, C. H., Tanevski, J., Perales-Patón, J., Gleixner, J., Kumar, M. P., Mereu, E., Joughin, B. A., Stegle, O., Lauffenburger, D. A., Heyn, H., Szalai, B., & Saez-Rodriguez, J.
- Affiliations
- Heidelberg University (DE)
- German Cancer Research Center (DE)
- Barcelona Institute of Science and Technology (ES)
- Koch Institute for Integrative Cancer Research At MIT (US)
- European Bioinformatics Institute (GB)
- Massachusetts Institute of Technology (US)
- Universitat Pompeu Fabra (ES)
- Semmelweis University (HU)
- ORCID
- Venue
- Genome Biology
- Published
- 2020-02-12
- Volume
- 21
- Issue
- 1
- Pages
- 36-36
- ISSN
- 1465-6906 (ISSN-L)
- 1474-760X
- PMC
- PMC7017576
- OpenAlex
- W3007199577
- Cited by
- 323
- References
- 51
- Citations by year
- 2026: 37 · 2025: 39 · 2024: 67 · 2023: 60 · 2022: 61 · 2021: 38 · 2020: 18
- FWCI
- 14.34
- Type
- journal article
- Language
- en
- Open access
- gold
- doi.org
- Locations
- Genome biology (publishedVersion, cc-by)
- bioRxiv (Cold Spring Harbor Laboratory) (acceptedVersion, cc-by)
- PubMed Central (publishedVersion, cc-by)
- PubMed (publishedVersion)
- Repositori digital de la UPF (Universitat Pompeu Fabra) (publishedVersion, cc-by-nc)
- DOAJ (DOAJ: Directory of Open Access Journals) (submittedVersion, cc-by-sa)
- DSpace@MIT (Massachusetts Institute of Technology) (submittedVersion, cc-by-nc)
- Semmelweis University Repository (Semmelweis University) (submittedVersion)
- Funders
- Bundesministerium für Bildung und Forschung (FKZ: 031L0049)
- National Institutes of Health (U54-CA217377)
- Ministry of Science, Innovation and Universities (SAF2017-89109-P)
- Topics
- Life Sciences › Biochemistry, Genetics and Molecular Biology › Molecular Biology › Single-cell and spatial transcriptomics
- Life Sciences › Biochemistry, Genetics and Molecular Biology › Molecular Biology › Bioinformatics and Genomic Networks
- Life Sciences › Biochemistry, Genetics and Molecular Biology › Molecular Biology › Genomics and Phylogenetic Studies
- Keywords
- single-cell RNA sequencing, transcription factor activity, pathway activity, benchmarking, offspring, SCENIC, AUCell, Dorothea, gene ontology enrichment, simulated data
- MeSH terms
- RNA-Seq, Animals, Humans, Software, Transcription Factors, Benchmarking, Gene Regulatory Networks, Single-Cell Analysis, Transcriptome
About these checks
Registry, retraction, Cites and statistics results are computed, not judged, with one exception: a printed reference that no index lists is read once by a model before it counts as a citation error. Claims are extracted by a model and kept only when their quote appears verbatim in the text; each cited source is then checked, with a model’s help, for whether it says what the claim relies on. Those verdicts can be wrong — read the claim’s quote and the cited source before relying on one.
Statistics and arithmetic are recomputed, not judged.
Confidence bands are shown only for fields calibrated on our annotated test set. None is calibrated yet, so no band is shown.
What counts as a claim ›How we measure confidence ›How we check this ›
Are you an author, or do you see a problem with this page? Request a review
