

The DOI matches its Crossref record; 65 of the 65 references it cites were found in a registry or an index.
APOE genotype and sex affect microglial interactions with plaques in Alzheimer’s disease mice
Open accessAbstract
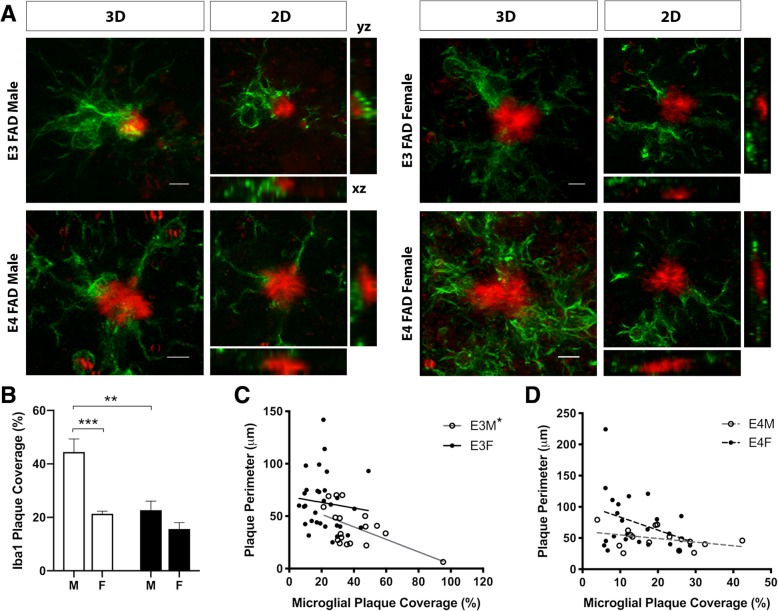
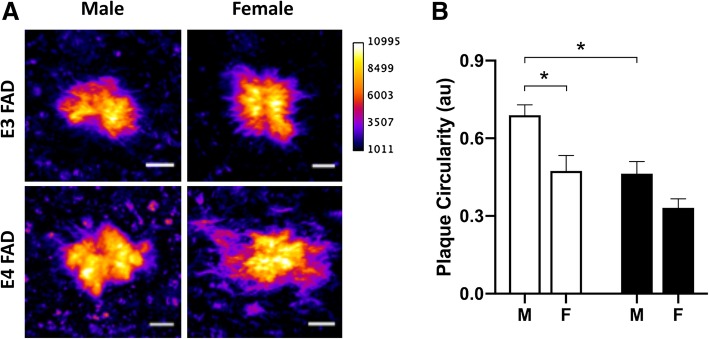
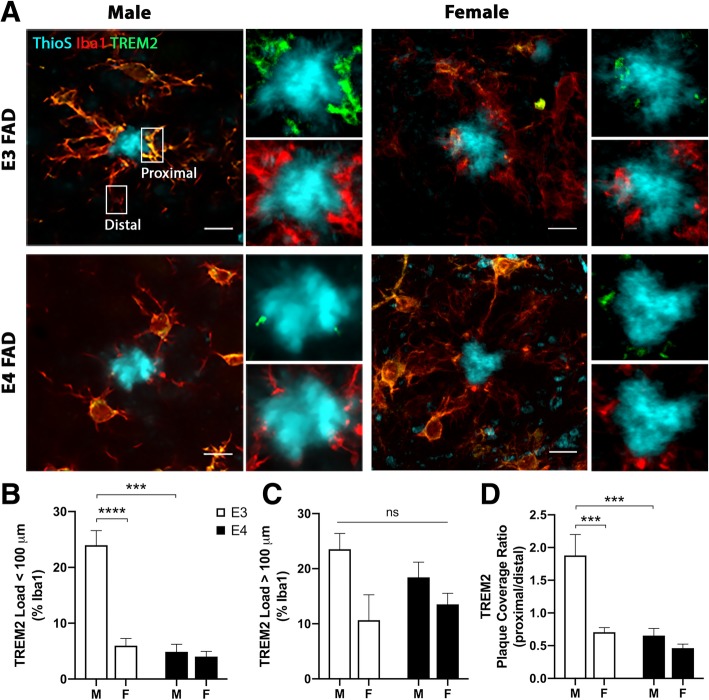
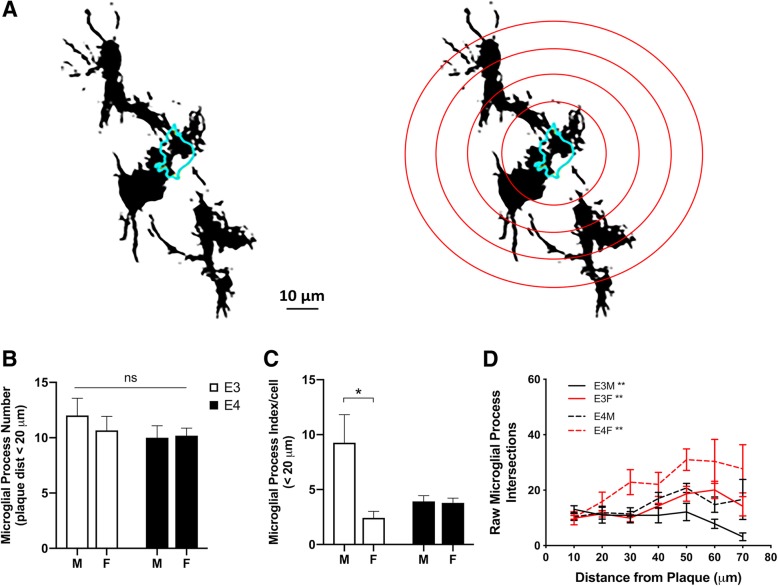
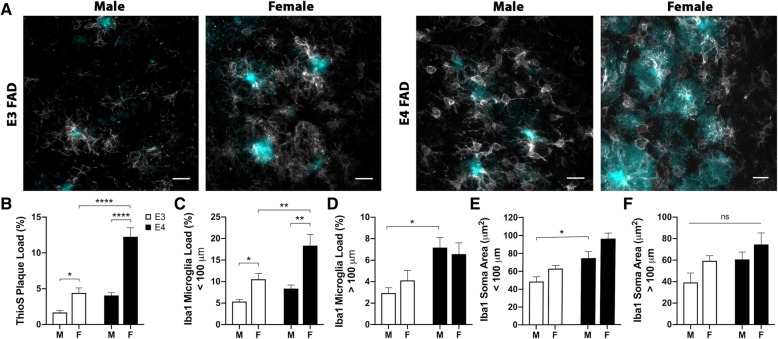
Microglia affect Alzheimer's disease (AD) pathogenesis in opposing manners, by protecting against amyloid accumulation in early phases of the disease and promoting neuropathology in advanced stages. Recent research has identified specific microglial interactions with amyloid plaques that exert important protective functions including attenuation of early pathology. It is unknown how these protective microglial interactions with plaques are affected by apolipoprotein E (APOE) genotype and sex, two well-established AD risk factors that modulate microglial function. We investigated this question using quantitative confocal microscopy to compare microglial interactions with amyloid plaques in male and female EFAD mice across APOE3 and APOE4 genotypes at 6 months of age. We observed that microglial coverage of plaques is highest in male APOE3 mice with significant reductions in coverage observed with both APOE4 genotype and female sex. Plaque compaction, a beneficial consequence of microglial interactions with plaques, showed a similar pattern in which APOE4 genotype and female sex were associated with significantly lower values. Within the plaque environment, microglial expression of triggering receptor expressed on myeloid cells 2 (TREM2), a known regulator of microglial plaque coverage, was highest in male APOE3 mice and reduced by APOE4 genotype and female sex. These differences in plaque interactions were unrelated to the number of microglial processes in the plaque environment across groups. Interestingly, the pattern of amyloid burden across groups was opposite to that of microglial plaque coverage, with APOE4 genotype and female sex showing the highest amyloid levels. These findings suggest a possible mechanism by which microglia may contribute to the increased AD risk associated with APOE4 genotype and female sex.
Overview
The claims and statistics of this paper haven’t been checked yet.
Run the check — free, no account needed. It reads the open-access text and checks the sources it cites.
Integrity signals
Registry
Cites
Statistics
Figures
Verification
Claims the paper makes
The claims and statistics of this paper haven’t been checked yet.
Run the check — free, no account needed. It reads the open-access text and checks the sources it cites.
Claims other papers make about this one
Each is checked against this paper’s own text: does it say what the citing paper says it does?
The source backs part of the claim, not all of it — or backs it for a different population, condition or comparison.
In the citing paper
“Reactive microglia migrate towards Aβ plaques, surround them and upregulate APOE, which binds to TREM2 and promotes plaque compaction154.”
From Multifaceted roles of APOE in Alzheimer disease (2024) · cites this paper as [154]
Experimental — accuracy not yet measuredThe source backs part of the claim, not all of it — or backs it for a different population, condition or comparison.
In the citing paper
“Previous reports have demonstrated that gender can affect AD pathology, microglia response and APOE expression (Stephen et al, 2019; Thomas et al, 2016; Sala Frigerio et al, 2019), while the protective and disease causing effects of APOE2 and APOE4 are variable in different ethnic populations (Farrer et al, 1997; Naslavsky et al, 2022).”
From APOE from astrocytes restores Alzheimer’s Aβ-pathology and DAM-like responses in APOE deficient microglia (2024) · cites this paper as Stephen et al, 2019
Experimental — accuracy not yet measuredThe cited source says what the claim attributes to it.
In the citing paper
“They discovered that microglial coverage of amyloid plaques is highest in male APOE3 mice and reduced by female sex and APOE4 genotype.”
Self-check
Percentages, sums and reported differences re-computed from the paper’s own numbers.
The self-check needs the paper’s full text.
Citations
Cites
Neuroinflammation in Alzheimer's disease
Heneka, M. T., Carson, M. J., Khoury, J. E., Landreth, G. E., Brosseron, F., Feinstein, D. L., Jacobs, A. H., Wyss-Coray, T., Vitorica, J., Ransohoff, R. M., et al. (2015) · The Lancet Neurology · doi:10.1016/s1474-4422(15)70016-5 · Cited by 6,226
A Unique Microglia Type Associated with Restricting Development of Alzheimer’s Disease
Keren-Shaul, H., Spinrad, A., Weiner, A., Matcovitch-Natan, O., Dvir-Szternfeld, R., Ulland, T. K., David, E., Baruch, K., Lara-Astaiso, D., Toth, B., et al. (2017) · Cell · doi:10.1016/j.cell.2017.05.018 · Cited by 5,493
Harold, D., Abraham, R., Hollingworth, P., Sims, R., Gerrish, A., Hamshere, M. L., Pahwa, J. S., Moskvina, V., Dowzell, K., Williams, A., et al. (2009) · Nature Genetics · doi:10.1038/ng.440 · Cited by 3,326
Krasemann, S., Madore, C., Cialic, R., Baufeld, C., Calcagno, N., El Fatimy, R., Beckers, L., O’Loughlin, E., Xu, Y., Fanek, Z., et al. (2017) · Immunity · doi:10.1016/j.immuni.2017.08.008 · Cited by 2,979
Variant of TREM2 Associated with the Risk of Alzheimer's Disease
Jonsson, T., Stefansson, H., Steinberg, S., Jonsdottir, I., Jonsson, P. V., Snaedal, J., Bjornsson, S., Huttenlocher, J., Levey, A. I., Lah, J. J., et al. (2013) · New England Journal of Medicine · doi:10.1056/nejmoa1211103 · Cited by 2,558
Identification of a unique TGF-β–dependent molecular and functional signature in microglia
Butovsky, O., Jedrychowski, M. P., Moore, C. S., Cialic, R., Lanser, A. J., Gabriely, G., Koeglsperger, T., Dake, B., Wu, P. M., Doykan, C. E., et al. (2014) · Nature Neuroscience · doi:10.1038/nn.3599 · Cited by 2,543
Genome-wide association study identifies variants at CLU and CR1 associated with Alzheimer's disease
the European Alzheimer's Disease Initiative Investigators, Lambert, J.-C., Heath, S., Even, G., Campion, D., Sleegers, K., Hiltunen, M., Combarros, O., Zelenika, D., Bullido, M. J., et al. (2009) · Nature Genetics · doi:10.1038/ng.439 · Cited by 2,234
the Immunological Genome Consortium, Gautier, E. L., Shay, T., Miller, J., Greter, M., Jakubzick, C., Ivanov, S., Helft, J., Chow, A., Elpek, K. G., et al. (2012) · Nature Immunology · doi:10.1038/ni.2419 · Cited by 1,972
TREM2 Lipid Sensing Sustains the Microglial Response in an Alzheimer’s Disease Model
Wang, Y., Cella, M., Mallinson, K., Ulrich, J. D., Young, K. L., Robinette, M. L., Gilfillan, S., Krishnan, G. M., Sudhakar, S., Zinselmeyer, B. H., et al. (2015) · Cell · doi:10.1016/j.cell.2015.01.049 · Cited by 1,736
The microglial sensome revealed by direct RNA sequencing
Hickman, S. E., Kingery, N. D., Ohsumi, T. K., Borowsky, M. L., Wang, L.-C., Means, T. K., & El Khoury, J. (2013) · Nature Neuroscience · doi:10.1038/nn.3554 · Cited by 1,511
An english translation of alzheimer’s 1907 paper, “über eine eigenartige erkankung der hirnrinde”
Stelzmann, R. A., Norman Schnitzlein, H., & Reed Murtagh, F. (1995) · Clinical Anatomy · doi:10.1002/ca.980080612 · Cited by 1,455
Alzheimer’s Disease Risk Genes and Mechanisms of Disease Pathogenesis
Karch, C. M., & Goate, A. M. (2015) · Biological Psychiatry · doi:10.1016/j.biopsych.2014.05.006 · Cited by 1,357
TREM2 Maintains Microglial Metabolic Fitness in Alzheimer’s Disease
Ulland, T. K., Song, W. M., Huang, S. C.-C., Ulrich, J. D., Sergushichev, A., Beatty, W. L., Loboda, A. A., Zhou, Y., Cairns, N. J., Kambal, A., et al. (2017) · Cell · doi:10.1016/j.cell.2017.07.023 · Cited by 1,263
Lin, Y.-T., Seo, J., Gao, F., Feldman, H. M., Wen, H.-L., Penney, J., Cam, H. P., Gjoneska, E., Raja, W. K., Cheng, J., et al. (2018) · Neuron · doi:10.1016/j.neuron.2018.05.008 · Cited by 1,125
Yeh, F. L., Wang, Y., Tom, I., Gonzalez, L. C., & Sheng, M. (2016) · Neuron · doi:10.1016/j.neuron.2016.06.015 · Cited by 943
Relationship of microglia and astrocytes to amyloid deposits of Alzheimer disease
Itagaki, S., McGeer, P. L., Akiyama, H., Zhu, S., & Selkoe, D. (1989) · Journal of Neuroimmunology · doi:10.1016/0165-5728(89)90115-x · Cited by 940
Sex modifies the APOE ‐related risk of developing Alzheimer disease
Altmann, A., Tian, L., Henderson, V. W., Greicius, M. D., & Alzheimer's Disease Neuroimaging Initiative Investigators (2014) · Annals of Neurology · doi:10.1002/ana.24135 · Cited by 891
TREM2-mediated early microglial response limits diffusion and toxicity of amyloid plaques
Wang, Y., Ulland, T. K., Ulrich, J. D., Song, W., Tzaferis, J. A., Hole, J. T., Yuan, P., Mahan, T. E., Shi, Y., Gilfillan, S., et al. (2016) · Journal of Experimental Medicine · doi:10.1084/jem.20151948 · Cited by 840
Yuan, P., Condello, C., Keene, C. D., Wang, Y., Bird, T. D., Paul, S. M., Luo, W., Colonna, M., Baddeley, D., & Grutzendler, J. (2016) · Neuron · doi:10.1016/j.neuron.2016.05.003 · Cited by 817
Microglia constitute a barrier that prevents neurotoxic protofibrillar Aβ42 hotspots around plaques
Condello, C., Yuan, P., Schain, A., & Grutzendler, J. (2015) · Nature Communications · doi:10.1038/ncomms7176 · Cited by 718
The role of microglia in amyloid clearance from the AD brain
Lee, C. Y. D., & Landreth, G. E. (2010) · Journal of Neural Transmission · doi:10.1007/s00702-010-0433-4 · Cited by 701
Sex differences in microglial colonization of the developing rat brain
Schwarz, J. M., Sholar, P. W., & Bilbo, S. D. (2012) · Journal of Neurochemistry · doi:10.1111/j.1471-4159.2011.07630.x · Cited by 672
Sex-specific features of microglia from adult mice
Villa, A., Gelosa, P., Castiglioni, L., Cimino, M., Rizzi, N., Pepe, G., Lolli, F., Marcello, E., Sironi, L., Vegeto, E., et al. (2018) · Cell Reports · doi:10.1016/j.celrep.2018.05.048 · Cited by 651
Holtman, I. R., Raj, D. D., Miller, J. A., Schaafsma, W., Yin, Z., Brouwer, N., Wes, P. D., Möller, T., Orre, M., Kamphuis, W., et al. (2015) · Acta Neuropathologica Communications · doi:10.1186/s40478-015-0203-5 · Cited by 619
Apolipoprotein E Is a Ligand for Triggering Receptor Expressed on Myeloid Cells 2 (TREM2)
Atagi, Y., Liu, C.-C., Painter, M. M., Chen, X.-F., Verbeeck, C., Zheng, H., Li, X., Rademakers, R., Kang, S. S., Xu, H., et al. (2015) · Journal of Biological Chemistry · doi:10.1074/jbc.m115.679043 · Cited by 587
Loss of TREM2 function increases amyloid seeding but reduces plaque-associated ApoE
Parhizkar, S., Arzberger, T., Brendel, M., Kleinberger, G., Deussing, M., Focke, C., Nuscher, B., Xiong, M., Ghasemigharagoz, A., Katzmarski, N., et al. (2019) · Nature Neuroscience · doi:10.1038/s41593-018-0296-9 · Cited by 555
Dynamics of the Microglial/Amyloid Interaction Indicate a Role in Plaque Maintenance
Bolmont, T., Haiss, F., Eicke, D., Radde, R., Mathis, C. A., Klunk, W. E., Kohsaka, S., Jucker, M., & Calhoun, M. E. (2008) · The Journal of Neuroscience · doi:10.1523/jneurosci.4814-07.2008 · Cited by 526
Microglia Are Essential to Masculinization of Brain and Behavior
Lenz, K. M., Nugent, B. M., Haliyur, R., & McCarthy, M. M. (2013) · The Journal of Neuroscience · doi:10.1523/jneurosci.1268-12.2013 · Cited by 526
TREM2 sustains microglial expansion during aging and response to demyelination
Poliani, P. L., Wang, Y., Fontana, E., Robinette, M. L., Yamanishi, Y., Gilfillan, S., & Colonna, M. (2015) · Journal of Clinical Investigation · doi:10.1172/jci77983 · Cited by 525
A transcriptomic atlas of aged human microglia
Olah, M., Patrick, E., Villani, A.-C., Xu, J., White, C. C., Ryan, K. J., Piehowski, P., Kapasi, A., Nejad, P., Cimpean, M., et al. (2018) · Nature Communications · doi:10.1038/s41467-018-02926-5 · Cited by 482
TREM2 in Neurodegenerative Diseases
Jay, T. R., von Saucken, V. E., & Landreth, G. E. (2017) · Molecular Neurodegeneration · doi:10.1186/s13024-017-0197-5 · Cited by 427
Sex and the development of Alzheimer's disease
Pike, C. J. (2016) · Journal of Neuroscience Research · doi:10.1002/jnr.23827 · Cited by 416
Self-citationTREM2- and DAP12-dependent activation of PI3K requires DAP10 and is inhibited by SHIP1
Peng, Q., Malhotra, S., Torchia, J. A., Kerr, W. G., Coggeshall, K. M., & Humphrey, M. B. (2010) · Science Signaling · doi:10.1126/scisignal.2000500 · Cited by 413
Hanamsagar, R., & Bilbo, S. D. (2015) · The Journal of Steroid Biochemistry and Molecular Biology · doi:10.1016/j.jsbmb.2015.09.039 · Cited by 404
Targeting mi R‐155 restores abnormal microglia and attenuates disease in SOD 1 mice
Butovsky, O., Jedrychowski, M. P., Cialic, R., Krasemann, S., Murugaiyan, G., Fanek, Z., Greco, D. J., Wu, P. M., Doykan, C. E., Kiner, O., et al. (2015) · Annals of Neurology · doi:10.1002/ana.24304 · Cited by 358
Loss of TREM2 function increases amyloid seeding but reduces plaque-associated ApoE
Parhizkar, S., Arzberger, T., Brendel, M., Kleinberger, G., Deußing, M., Focke, C., Nuscher, B., Xiong, M., Ghasemigharagoz, A., Katzmarski, N., et al. (2019) · doi:10.7892/boris.125653 · Cited by 352
Age and gender effects on microglia and astrocyte numbers in brains of mice
Mouton, P. R., Long, J. M., Lei, D.-L., Howard, V., Jucker, M., Calhoun, M. E., & Ingram, D. K. (2002) · Brain Research · doi:10.1016/s0006-8993(02)03475-3 · Cited by 320
Humanized TREM2 mice reveal microglia-intrinsic and -extrinsic effects of R47H polymorphism
Song, W. M., Joshita, S., Zhou, Y., Ulland, T. K., Gilfillan, S., & Colonna, M. (2018) · Journal of Experimental Medicine · doi:10.1084/jem.20171529 · Cited by 305
The Triggering Receptor Expressed on Myeloid Cells 2 Binds Apolipoprotein E
Bailey, C. C., DeVaux, L. B., & Farzan, M. (2015) · Journal of Biological Chemistry · doi:10.1074/jbc.m115.677286 · Cited by 303
Altered microglial response to Aβ plaques in APPPS1-21 mice heterozygous for TREM2
Ulrich, J. D., Finn, M. B., Wang, Y., Shen, A., Mahan, T. E., Jiang, H., Stewart, F. R., Piccio, L., Colonna, M., & Holtzman, D. M. (2014) · Molecular Neurodegeneration · doi:10.1186/1750-1326-9-20 · Cited by 302
ApoE facilitates the microglial response to amyloid plaque pathology
Ulrich, J. D., Ulland, T. K., Mahan, T. E., Nyström, S., Nilsson, K. P., Song, W. M., Zhou, Y., Reinartz, M., Choi, S., Jiang, H., et al. (2018) · Journal of Experimental Medicine · doi:10.1084/jem.20171265 · Cited by 297
Fernandez, C. G., Hamby, M. E., McReynolds, M. L., & Ray, W. J. (2019) · Frontiers in Aging Neuroscience · doi:10.3389/fnagi.2019.00014 · Cited by 277
APOE4-specific Changes in Aβ Accumulation in a New Transgenic Mouse Model of Alzheimer Disease
Youmans, K. L., Tai, L. M., Nwabuisi-Heath, E., Jungbauer, L., Kanekiyo, T., Gan, M., Kim, J., Eimer, W. A., Estus, S., Rebeck, G. W., et al. (2012) · Journal of Biological Chemistry · doi:10.1074/jbc.m112.407957 · Cited by 268
Self-citationPayami, H., Zareparsi, S., Montee, K. R., Sexton, G. J., Kaye, J. A., Bird, T. D., Yu, C. E., Wijsman, E. M., Heston, L. L., Litt, M. J., et al. (1996) · PubMed Central · Cited by 248
Emerging Concepts in Alzheimer's Disease
Vinters, H. V. (2014) · Annual Review of Pathology Mechanisms of Disease · doi:10.1146/annurev-pathol-020712-163927 · Cited by 244
Kozlowski, C., & Weimer, R. M. (2012) · PLoS ONE · doi:10.1371/journal.pone.0031814 · Cited by 218
The Role of APOE and TREM2 in Alzheimer′s Disease—Current Understanding and Perspectives
Wolfe, C. M., Fitz, N. F., Nam, K. N., Lefterov, I. M., & Koldamova, R. P. (2018) · International Journal of Molecular Sciences · doi:10.3390/ijms20010081 · Cited by 201
Human APOE4 increases microglia reactivity at Aβ plaques in a mouse model of Aβ deposition
Rodriguez, G. A., Tai, L. M., LaDu, M. J., & Rebeck, G. W. (2014) · Journal of Neuroinflammation · doi:10.1186/1742-2094-11-111 · Cited by 193
Self-citationGenetics of Alzheimer's Disease
Guerreiro, R. J., & Hardy, J. (2014) · Neurotherapeutics · doi:10.1007/s13311-014-0295-9 · Cited by 168
Tai, L. M., Ghura, S., Koster, K. P., Liakaite, V., Maienschein‐Cline, M., Kanabar, P., Collins, N., Ben‐Aissa, M., Lei, A. Z., Bahroos, N., et al. (2015) · Journal of Neurochemistry · doi:10.1111/jnc.13072 · Cited by 165
Self-citationMicroglia limit the expansion of β-amyloid plaques in a mouse model of Alzheimer’s disease
Zhao, R., Hu, W., Tsai, J., Li, W., & Gan, W.-B. (2017) · Molecular Neurodegeneration · doi:10.1186/s13024-017-0188-6 · Cited by 151
Stephen, T., Higgs, N., Sheehan, D. F., Awabdh, S. A., López‐Doménech, G., Arancibia‐Cárcamo, I. L., & Kittler, J. T. (2015) · Journal of Neuroscience · doi:10.1523/jneurosci.2068-15.2015 · Cited by 140
Self-citationMicroglia-Mediated Neuroprotection, TREM2, and Alzheimer’s Disease: Evidence From Optical Imaging
Condello, C., Yuan, P., & Grutzendler, J. (2018) · Biological Psychiatry · doi:10.1016/j.biopsych.2017.10.007 · Cited by 131
Farrer, L. A. (1997) · JAMA · doi:10.1001/jama.1997.03550160069041 · Cited by 124
Ultrastructural evidence of microglial heterogeneity in Alzheimer’s disease amyloid pathology
El Hajj, H., Savage, J. C., Bisht, K., Parent, M., Vallières, L., Rivest, S., & Tremblay, M.-È. (2019) · Journal of Neuroinflammation · doi:10.1186/s12974-019-1473-9 · Cited by 119
Plescher, M., Seifert, G., Hansen, J. N., Bedner, P., Steinhäuser, C., & Halle, A. (2018) · Glia · doi:10.1002/glia.23318 · Cited by 108
Interactions between inflammation, sex steroids, and Alzheimer’s disease risk factors
Uchoa, M. F., Moser, V. A., & Pike, C. J. (2016) · Frontiers in Neuroendocrinology · doi:10.1016/j.yfrne.2016.09.001 · Cited by 105
Self-citationBrain Response to Injuries: When Microglia Go Sexist
Rahimian, R., Cordeau, P., & Križ, J. (2018) · Neuroscience · doi:10.1016/j.neuroscience.2018.02.048 · Cited by 101
Jendresen, C., Årskog, V., Daws, M. R., & Nilsson, L. N. G. (2017) · Journal of Neuroinflammation · doi:10.1186/s12974-017-0835-4 · Cited by 94
The APOE4 allele shows opposite sex bias in microbleeds and Alzheimer’s Disease of humans and mice
Cacciottolo, M., Christensen, A., Moser, A., Liu, J., Pike, C., Smith, C., LaDu, M., Sullivan, P., Morgan, T., Dolzhenko, E., et al. (2015) · Neurobiology of Aging · doi:10.1016/j.neurobiolaging.2015.10.010 · Cited by 93
Self-citationEFAD transgenic mice as a human APOE relevant preclinical model of Alzheimerʼns disease
Tai, L. M., Balu, D., Avila-Munoz, E., Abdullah, L., Thomas, R., Collins, N., Valencia-Olvera, A. C., & LaDu, M. J. (2017) · Journal of Lipid Research · doi:10.1194/jlr.r076315 · Cited by 93
Self-citationObesity Accelerates Alzheimer-Related Pathology inAPOE4but notAPOE3Mice
Moser, V. A., & Pike, C. J. (2017) · eNeuro · doi:10.1523/eneuro.0077-17.2017 · Cited by 85
Self-citationLi, X., Montine, K. S., Keene, C. D., & Montine, T. J. (2015) · The FASEB Journal · doi:10.1096/fj.14-262683 · Cited by 54
A Tale of Two Genes: Microglial Apoe and Trem2
Pimenova, A. A., Marcora, E. M., & Goate, A. (2017) · Immunity · doi:10.1016/j.immuni.2017.08.015 · Cited by 52
Yang, Y. J., Cudaback, E., Jorstad, N. L., Hemingway, J. F., Hagan, C. E., Melief, E. J., Li, X., Yoo, T., Khademi, S. B., Montine, K. S., et al. (2013) · American Journal Of Pathology · doi:10.1016/j.ajpath.2013.05.009 · Cited by 37
Cited by
Sorted by citations
Mechanisms of sex differences in Alzheimer’s disease
Lopez-Lee, C., Torres, E. R. S., Carling, G., & Gan, L. (2024) · Neuron · doi:10.1016/j.neuron.2024.01.024 · Cited by 376
APOE mediated neuroinflammation and neurodegeneration in Alzheimer’s disease
Parhizkar, S., & Holtzman, D. M. (2022) · Seminars in Immunology · doi:10.1016/j.smim.2022.101594 · Cited by 255
Multifaceted roles of APOE in Alzheimer disease
Jackson, R. J., Hyman, B. T., & Serrano-Pozo, A. (2024) · Nature Reviews Neurology · doi:10.1038/s41582-024-00988-2 · Cited by 193
Sex Differences in Alzheimer’s Disease: Insights From the Multiomics Landscape
Guo, L., Zhong, M. B., Zhang, L., Zhang, B., & Cai, D. (2022) · Biological Psychiatry · doi:10.1016/j.biopsych.2021.02.968 · Cited by 164
Exploring Sex-Related Differences in Microglia May Be a Game-Changer in Precision Medicine
Lynch, M. A. (2022) · Frontiers in Aging Neuroscience · doi:10.3389/fnagi.2022.868448 · Cited by 146
Metadata
- Authors
- Stephen, T. L., Cacciottolo, M., Balu, D., Morgan, T. E., LaDu, M. J., Finch, C. E., & Pike, C. J.
- Affiliations
- University of Southern California (US)
- University of Illinois Chicago (US)
- Corresponding author
- Pike, C. J.
- Venue
- Acta Neuropathologica Communications
- Published
- 2019-05-21
- Volume
- 7
- Issue
- 1
- Pages
- 82-82
- ISSN
- 2051-5960 (ISSN-L)
- PMC
- PMC6528326
- OpenAlex
- W2946924931
- Cited by
- 115
- References
- 65
- Citations by year
- 2026: 8 · 2025: 14 · 2024: 30 · 2023: 13 · 2022: 15 · 2021: 17 · 2020: 14 · 2019: 4
- FWCI
- 5.50
- Type
- journal article
- Language
- en
- Open access
- gold
- doi.org
- Locations
- Acta Neuropathologica Communications (publishedVersion, cc-by)
- PubMed Central (publishedVersion, cc-by)
- PubMed (publishedVersion)
- DOAJ (DOAJ: Directory of Open Access Journals) (submittedVersion, cc-by-sa)
- Funders
- National Institute on Aging (AG058068)
- Cure Alzheimer's Fund
- Topics
- Life Sciences › Neuroscience › Neurology › Neuroinflammation and Neurodegeneration Mechanisms
- Life Sciences › Neuroscience › Cellular and Molecular Neuroscience › Alzheimer's disease research and treatments
- Life Sciences › Neuroscience › Neurology › Neurological Disease Mechanisms and Treatments
- Keywords
- Alzheimer's disease, microglia, amyloid plaques, apolipoprotein E, APOE ε4, APOE3, sex differences, TREM2, amyloid burden, neuroprotection
- MeSH terms
- Alzheimer Disease, Animals, Brain, Female, Genotype, Male, Membrane Glycoproteins, Mice, Transgenic, Receptors, Immunologic, Sex Characteristics, Microglia, Apolipoprotein E3, Apolipoprotein E4, Plaque, Amyloid
About these checks
Registry, retraction, Cites and statistics results are computed, not judged, with one exception: a printed reference that no index lists is read once by a model before it counts as a citation error. Claims are extracted by a model and kept only when their quote appears verbatim in the text; each cited source is then checked, with a model’s help, for whether it says what the claim relies on. Those verdicts can be wrong — read the claim’s quote and the cited source before relying on one.
Statistics and arithmetic are recomputed, not judged.
Confidence bands are shown only for fields calibrated on our annotated test set. None is calibrated yet, so no band is shown.
What counts as a claim ›How we measure confidence ›How we check this ›
Are you an author, or do you see a problem with this page? Request a review
