

The DOI matches its Crossref record; 65 of the 65 references it cites were found in a registry or an index.
Different effects of constitutive and induced microbiota modulation on microglia in a mouse model of Alzheimer’s disease
Open accessAbstract
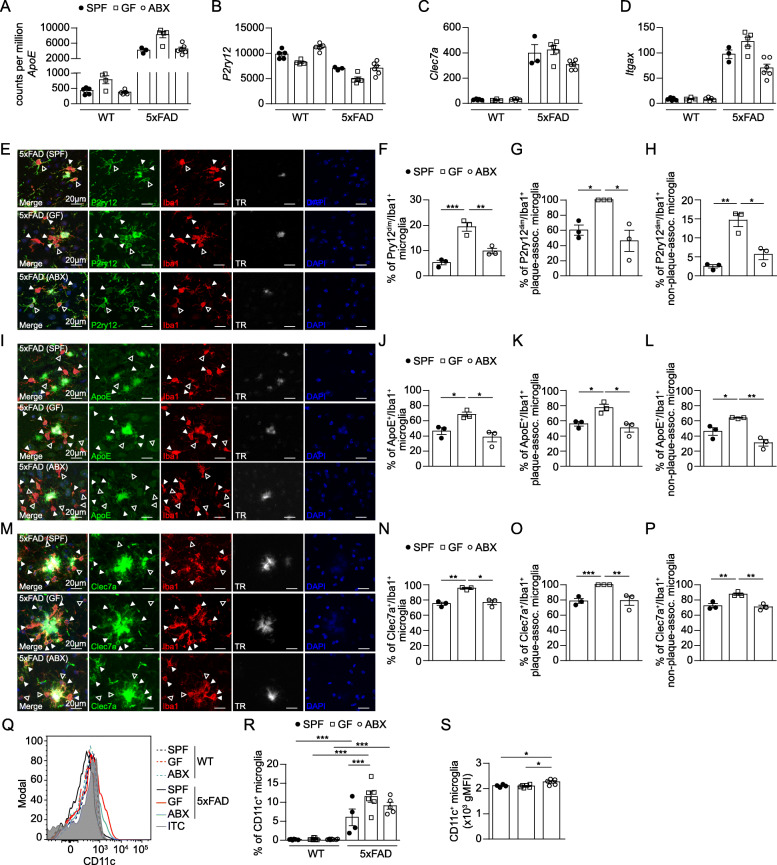
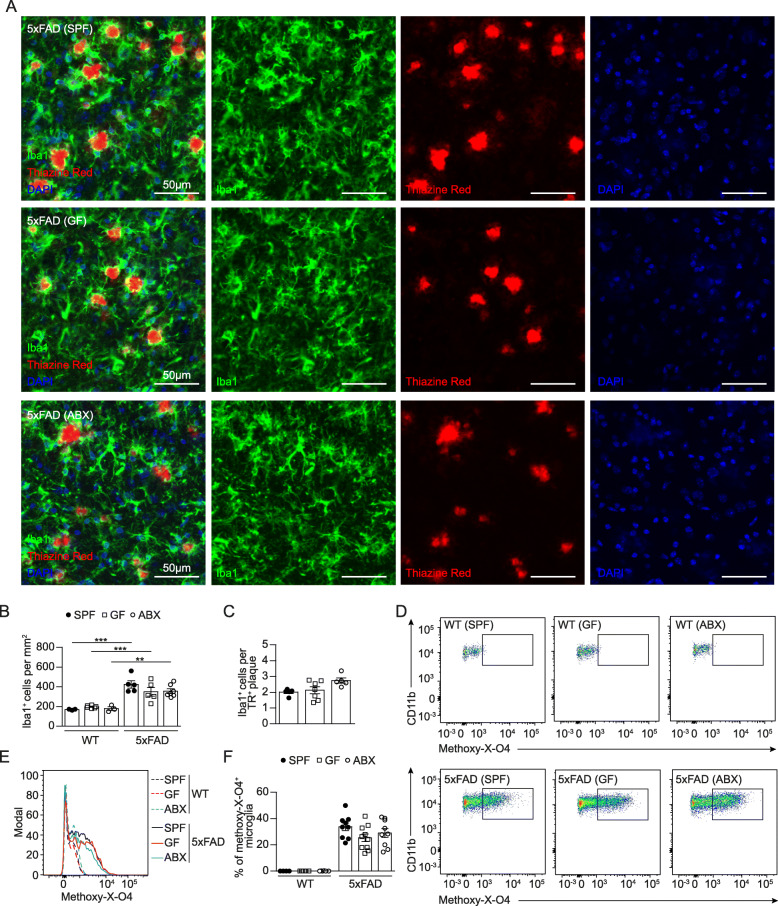
It was recently revealed that gut microbiota promote amyloid-beta (Aβ) burden in mouse models of Alzheimer’s disease (AD). However, the underlying mechanisms when using either germ-free (GF) housing conditions or treatments with antibiotics (ABX) remained unknown. In this study, we show that GF and ABX-treated 5x familial AD (5xFAD) mice developed attenuated hippocampal Aβ pathology and associated neuronal loss, and thereby delayed disease-related memory deficits. While Aβ production remained unaffected in both GF and ABX-treated 5xFAD mice, we noticed in GF 5xFAD mice enhanced microglial Aβ uptake at early stages of the disease compared to ABX-treated 5xFAD mice. Furthermore, RNA-sequencing of hippocampal microglia from SPF, GF and ABX-treated 5xFAD mice revealed distinct microbiota-dependent gene expression profiles associated with phagocytosis and altered microglial activation states. Taken together, we observed that constitutive or induced microbiota modulation in 5xFAD mice differentially controls microglial Aβ clearance mechanisms preventing neurodegeneration and cognitive deficits.
Overview
The claims and statistics of this paper haven’t been checked yet.
Run the check — free, no account needed. It reads the open-access text and checks the sources it cites.
Integrity signals
Registry
Cites
Statistics
Figures
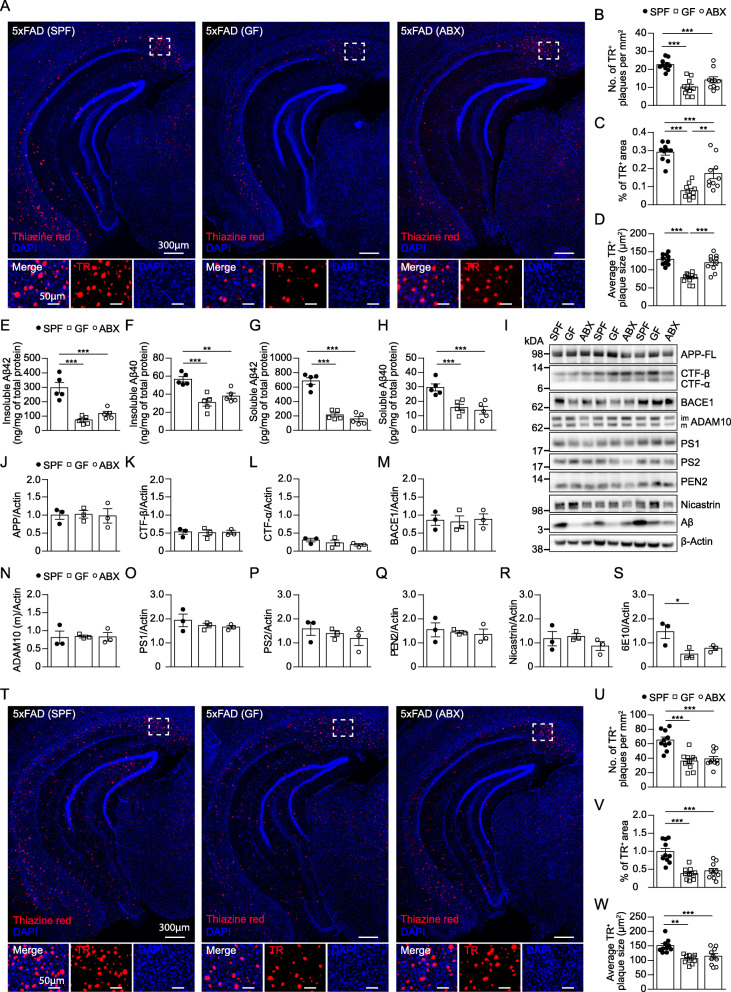
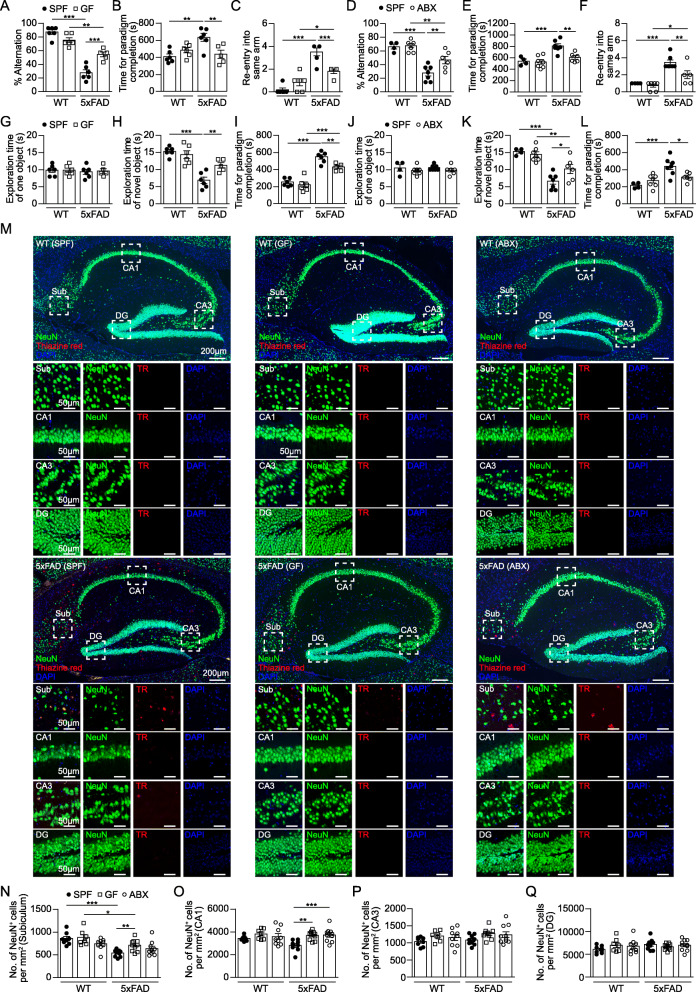
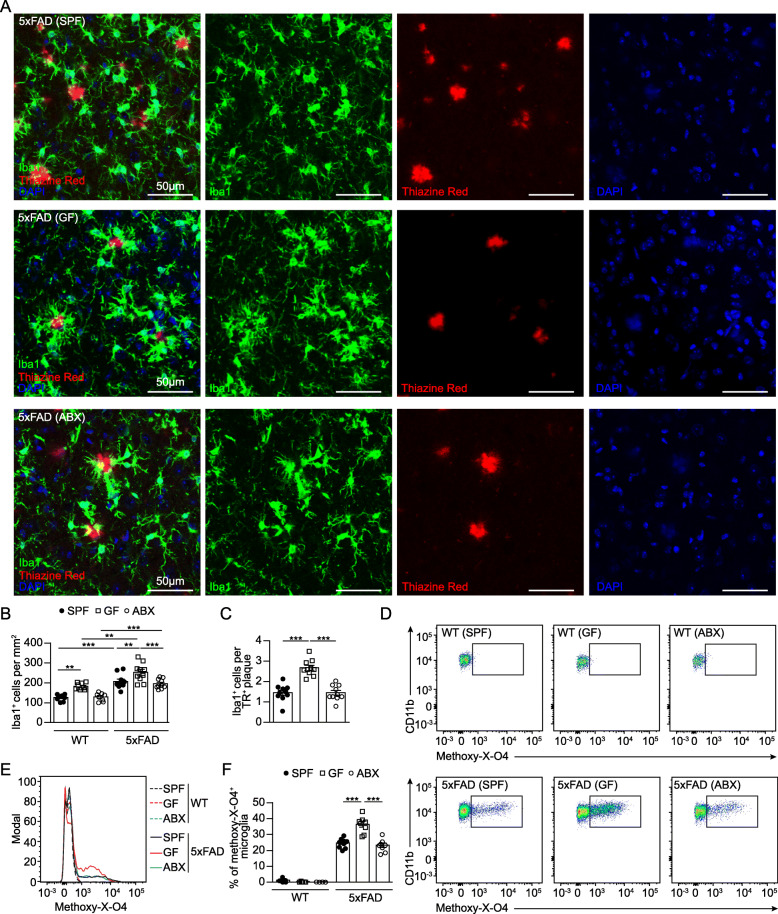
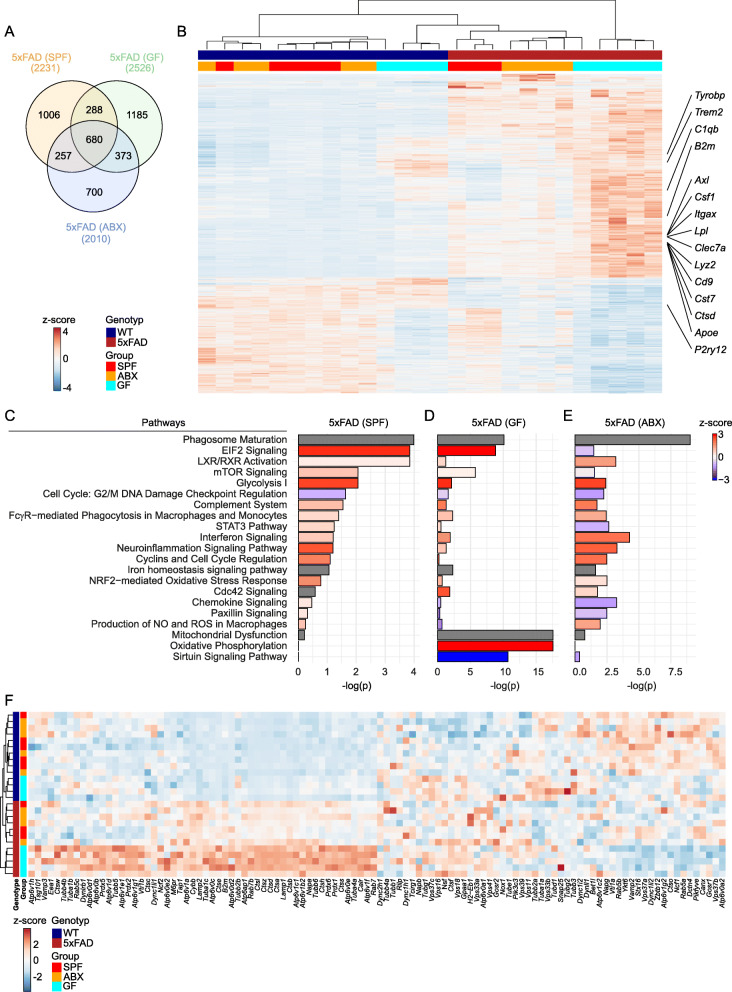
Verification
Claims the paper makes
The claims and statistics of this paper haven’t been checked yet.
Run the check — free, no account needed. It reads the open-access text and checks the sources it cites.
Claims other papers make about this one
Each is checked against this paper’s own text: does it say what the citing paper says it does?
In the citing paper
“Similarly, the gut microbiota is required for microglial activation in 5xFAD mice.203–205”
From Microbiota–gut–brain axis and its therapeutic applications in neurodegenerative diseases (2024) · cites this paper as [205]
In the citing paper
“Moreover, GF mice and mice treated with antibiotics exhibited attenuated phenotypes in AD and MS models56,57”
From Cellular senescence in white matter microglia is induced during ageing in mice and exacerbates the neuroinflammatory phenotype (2023) · cites this paper as [56]
Self-check
Percentages, sums and reported differences re-computed from the paper’s own numbers.
The self-check needs the paper’s full text.
Citations
Cites
STAR: ultrafast universal RNA-seq aligner
Dobin, A., Davis, C. A., Schlesinger, F., Drenkow, J., Zaleski, C., Jha, S., Batut, P., Chaisson, M., & Gingeras, T. R. (2013) · Bioinformatics · doi:10.1093/bioinformatics/bts635 · Cited by 51,709
QIIME allows analysis of high-throughput community sequencing data
Caporaso, J. G., Kuczynski, J., Stombaugh, J., Bittinger, K., Bushman, F. D., Costello, E. K., Fierer, N., Peña, A. G., Goodrich, J. K., Gordon, J. I., et al. (2010) · Nature Methods · doi:10.1038/nmeth.f.303 · Cited by 34,887
featureCounts: an efficient general purpose program for assigning sequence reads to genomic features
Liao, Y., Smyth, G. K., & Shi, W. (2014) · Bioinformatics · doi:10.1093/bioinformatics/btt656 · Cited by 27,219
phyloseq: An R Package for Reproducible Interactive Analysis and Graphics of Microbiome Census Data
McMurdie, P. J., & Holmes, S. (2013) · PLoS ONE · doi:10.1371/journal.pone.0061217 · Cited by 21,942
voom: precision weights unlock linear model analysis tools for RNA-seq read counts
Law, C. W., Chen, Y., Shi, W., & Smyth, G. K. (2014) · Genome Biology · doi:10.1186/gb-2014-15-2-r29 · Cited by 6,155
A Unique Microglia Type Associated with Restricting Development of Alzheimer’s Disease
Keren-Shaul, H., Spinrad, A., Weiner, A., Matcovitch-Natan, O., Dvir-Szternfeld, R., Ulland, T. K., David, E., Baruch, K., Lara-Astaiso, D., Toth, B., et al. (2017) · Cell · doi:10.1016/j.cell.2017.05.018 · Cited by 5,493
Fate Mapping Analysis Reveals That Adult Microglia Derive from Primitive Macrophages
Ginhoux, F., Greter, M., Leboeuf, M., Nandi, S., See, P., Gokhan, S., Mehler, M. F., Conway, S. J., Ng, L. G., Stanley, E. R., et al. (2010) · Science · doi:10.1126/science.1194637 · Cited by 5,175
Meta-Analysis of 74,046 Individuals Identifies 11 New Susceptibility Loci for Alzheimer’s Disease
(EADI), E. A. D. I., Lambert, J.-C., (GERAD), G. A. E. R. I. A. D., Alzheimer's Disease Genetic Consortium (ADGC), (CHARGE), C. F. H. A. A. R. I. G. E., Ibrahim-Verbaas, C. A., Harold, D., Naj, A. C., Sims, R., Bellenguez, C., et al. (2013) · Nature Genetics · doi:10.1038/ng.2802 · Cited by 4,336
Bravo, J. A., Forsythe, P., Chew, M. V., Escaravage, E., Savignac, H. M., Dinan, T. G., Bienenstock, J., & Cryan, J. F. (2011) · Proceedings of the National Academy of Sciences · doi:10.1073/pnas.1102999108 · Cited by 3,888
Gut microbiota regulate motor deficits and neuroinflammation in a model of Parkinson's disease
Sampson, T. R., Debelius, J. W., Thron, T., Janssen, S., Shastri, G. G., Ilhan, Z. E., Challis, C., Schretter, C. E., Rocha, S., Gradinaru, V., et al. (2016) · Cell · doi:10.1016/j.cell.2016.11.018 · Cited by 3,622
Host microbiota constantly control maturation and function of microglia in the CNS
Erny, D., Hrabě de Angelis, A. L., Jaitin, D., Wieghofer, P., Staszewski, O., David, E., Keren-Shaul, H., Mahlakoiv, T., Jakobshagen, K., Buch, T., et al. (2015) · Nature Neuroscience · doi:10.1038/nn.4030 · Cited by 3,569
Self-citationOakley, H., Cole, S. L., Logan, S., Maus, E., Shao, P., Craft, J., Guillozet-Bongaarts, A., Ohno, M., Disterhoft, J., Van Eldik, L., et al. (2006) · The Journal of Neuroscience · doi:10.1523/jneurosci.1202-06.2006 · Cited by 3,530 · cited 3×
“In 5xFAD mice, Aβ plaques start to appear at around 2months of age [38].”
BackgroundInfluentialGENCODE reference annotation for the human and mouse genomes
Frankish, A., Diekhans, M., Ferreira, A.-M., Johnson, R., Jungreis, I., Loveland, J. E., Mudge, J. M., Sisu, C., Wright, J. C., Armstrong, J. C., et al. (2018) · Nucleic Acids Research · doi:10.1093/nar/gky955 · Cited by 3,006
Krasemann, S., Madore, C., Cialic, R., Baufeld, C., Calcagno, N., El Fatimy, R., Beckers, L., O’Loughlin, E., Xu, Y., Fanek, Z., et al. (2017) · Immunity · doi:10.1016/j.immuni.2017.08.008 · Cited by 2,979
Gut microbiota functions: metabolism of nutrients and other food components
Rowland, I., Gibson, G., Heinken, A., Scott, K., Swann, J., Thiele, I., & Tuohy, K. (2018) · European Journal of Nutrition · doi:10.1007/s00394-017-1445-8 · Cited by 2,878
Sudo, N., Chida, Y., Aiba, Y., Sonoda, J., Oyama, N., Yu, X., Kubo, C., & Koga, Y. (2004) · The Journal of Physiology · doi:10.1113/jphysiol.2004.063388 · Cited by 2,735
Dysfunction of the intestinal microbiome in inflammatory bowel disease and treatment
Morgan, X. C., Tickle, T. L., Sokol, H., Gevers, D., Devaney, K. L., Ward, D. V., Reyes, J. A., Shah, S. A., LeLeiko, N., Snapper, S. B., et al. (2012) · Genome Biology · doi:10.1186/gb-2012-13-9-r79 · Cited by 2,713
InteractiVenn: a web-based tool for the analysis of sets through Venn diagrams
Heberle, H., Meirelles, G. V., da Silva, F. R., Telles, G. P., & Minghim, R. (2015) · BMC Bioinformatics · doi:10.1186/s12859-015-0611-3 · Cited by 2,700
A Lineage of Myeloid Cells Independent of Myb and Hematopoietic Stem Cells
Schulz, C., Perdiguero, E. G., Chorro, L., Szabo-Rogers, H., Cagnard, N., Kierdorf, K., Prinz, M., Wu, B., Jacobsen, S. E. W., Pollard, J. W., et al. (2012) · Science · doi:10.1126/science.1219179 · Cited by 2,578
Self-citationNichols, E., Szoeke, C. E. I., Vollset, S. E., Abbasi, N., Abd-Allah, F., Abdela, J., Aichour, M. T. E., Akinyemi, R. O., Alahdab, F., Asgedom, S. W., et al. (2019) · The Lancet Neurology · doi:10.1016/s1474-4422(18)30403-4 · Cited by 2,412
The novel object recognition memory: neurobiology, test procedure, and its modifications
Antunes, M., & Biala, G. (2012) · Cognitive Processing · doi:10.1007/s10339-011-0430-z · Cited by 2,390
Commensal Host-Bacterial Relationships in the Gut
Hooper, L. V., & Gordon, J. I. (2001) · Science · doi:10.1126/science.1058709 · Cited by 2,362
Gut microbiome alterations in Alzheimer’s disease
Vogt, N. M., Kerby, R. L., Dill-McFarland, K. A., Harding, S. J., Merluzzi, A. P., Johnson, S. C., Carlsson, C. M., Asthana, S., Zetterberg, H., Blennow, K., et al. (2017) · Scientific Reports · doi:10.1038/s41598-017-13601-y · Cited by 2,137
Decreased Clearance of CNS β-Amyloid in Alzheimer’s Disease
Mawuenyega, K. G., Sigurdson, W., Ovod, V., Munsell, L., Kasten, T., Morris, J. C., Yarasheski, K. E., & Bateman, R. J. (2010) · Science · doi:10.1126/science.1197623 · Cited by 2,078
Gut microbiota are related to Parkinson's disease and clinical phenotype
Scheperjans, F., Aho, V., Pereira, P. A. B., Koskinen, K., Paulin, L., Pekkonen, E., Haapaniemi, E., Kaakkola, S., Eerola‐Rautio, J., Pohja, M., et al. (2015) · Movement Disorders · doi:10.1002/mds.26069 · Cited by 1,968
TREM2 Lipid Sensing Sustains the Microglial Response in an Alzheimer’s Disease Model
Wang, Y., Cella, M., Mallinson, K., Ulrich, J. D., Young, K. L., Robinette, M. L., Gilfillan, S., Krishnan, G. M., Sudhakar, S., Zinselmeyer, B. H., et al. (2015) · Cell · doi:10.1016/j.cell.2015.01.049 · Cited by 1,736
Microglia Biology: One Century of Evolving Concepts
Prinz, M., Jung, S., & Priller, J. (2019) · Cell · doi:10.1016/j.cell.2019.08.053 · Cited by 1,525
Self-citationMicroglia emerge from erythromyeloid precursors via Pu.1- and Irf8-dependent pathways
Kierdorf, K., Erny, D., Goldmann, T., Sander, V., Schulz, C., Perdiguero, E. G., Wieghofer, P., Heinrich, A., Riemke, P., Hölscher, C., et al. (2013) · Nature Neuroscience · doi:10.1038/nn.3318 · Cited by 1,457
Self-citationUnger, M. M., Spiegel, J., Dillmann, K.-U., Grundmann, D., Philippeit, H., Bürmann, J., Faßbender, K., Schwiertz, A., & Schäfer, K.-H. (2016) · Parkinsonism & Related Disorders · doi:10.1016/j.parkreldis.2016.08.019 · Cited by 1,159
Yeh, F. L., Wang, Y., Tom, I., Gonzalez, L. C., & Sheng, M. (2016) · Neuron · doi:10.1016/j.neuron.2016.06.015 · Cited by 943
Microglia in Alzheimer's disease
Sarlus, H., & Heneka, M. T. (2017) · Journal of Clinical Investigation · doi:10.1172/jci90606 · Cited by 911
Reduction of Abeta amyloid pathology in APPPS1 transgenic mice in the absence of gut microbiota
Harach, T., Marungruang, N., Duthilleul, N., Cheatham, V., Mc Coy, K. D., Frisoni, G., Neher, J. J., Fåk, F., Jucker, M., Lasser, T., et al. (2017) · Scientific Reports · doi:10.1038/srep41802 · Cited by 901
TREM2-mediated early microglial response limits diffusion and toxicity of amyloid plaques
Wang, Y., Ulland, T. K., Ulrich, J. D., Song, W., Tzaferis, J. A., Hole, J. T., Yuan, P., Mahan, T. E., Shi, Y., Gilfillan, S., et al. (2016) · Journal of Experimental Medicine · doi:10.1084/jem.20151948 · Cited by 840
The Genetics of Alzheimer's Disease
Bertram, L., & Tanzi, R. E. (2012) · Progress in molecular biology and translational science · doi:10.1016/b978-0-12-385883-2.00008-4 · Cited by 794
Microbiome Influences Prenatal and Adult Microglia in a Sex-Specific Manner
Thion, M. S., Low, D., Silvin, A., Chen, J., Grisel, P., Schulte-Schrepping, J., Blecher, R., Ulas, T., Squarzoni, P., Hoeffel, G., et al. (2018) · Cell · doi:10.1016/j.cell.2017.11.042 · Cited by 779
The genetics of Alzheimer disease
Tanzi, R. E. (2012) · Cold Spring Harbor Perspectives in Medicine · doi:10.1101/cshperspect.a006296 · Cited by 727
The Evolution of Preclinical Alzheimer’s Disease: Implications for Prevention Trials
Sperling, R., Mormino, E., & Johnson, K. (2014) · Neuron · doi:10.1016/j.neuron.2014.10.038 · Cited by 725
Potential roles of gut microbiome and metabolites in modulating ALS in mice
Blacher, E., Bashiardes, S., Shapiro, H., Rothschild, D., Mor, U., Dori-Bachash, M., Kleimeyer, C., Moresi, C., Harnik, Y., Zur, M., et al. (2019) · Nature · doi:10.1038/s41586-019-1443-5 · Cited by 700
Minter, M. R., Zhang, C., Leone, V., Ringus, D. L., Zhang, X., Oyler-Castrillo, P., Musch, M. W., Liao, F., Ward, J. F., Holtzman, D. M., et al. (2016) · Scientific Reports · doi:10.1038/srep30028 · Cited by 655
Why weight? Modelling sample and observational level variability improves power in RNA-seq analyses
Liu, R., Holik, A. Z., Su, S., Jansz, N., Chen, K., Leong, H. S., Blewitt, M. E., Asselin-Labat, M.-L., Smyth, G. K., & Ritchie, M. E. (2015) · Nucleic Acids Research · doi:10.1093/nar/gkv412 · Cited by 583
The gut microbiome in human neurological disease: A review
Tremlett, H., Bauer, K. C., Appel‐Cresswell, S., Finlay, B. B., & Waubant, E. (2017) · Annals of Neurology · doi:10.1002/ana.24901 · Cited by 535
Möhle, L., Mattei, D., Heimesaat, M. M., Bereswill, S., Fischer, A., Alutis, M., French, T., Hambardzumyan, D., Matzinger, P., Dunay, I. R., et al. (2016) · Cell Reports · doi:10.1016/j.celrep.2016.04.074 · Cited by 470
Microbial network disturbances in relapsing refractory Crohn’s disease
Swiss IBD Cohort Investigators, Yılmaz, B., Juillerat, P., Øyås, O., Ramon, C., Bravo, F. D., Franc, Y., Fournier, N., Michetti, P., Mueller, C., et al. (2019) · Nature Medicine · doi:10.1038/s41591-018-0308-z · Cited by 444
Self-citationPreventing Alzheimer’s Disease
Selkoe, D. J. (2012) · Science · doi:10.1126/science.1228541 · Cited by 391
Attenuation of neuroinflammation and Alzheimer's disease pathology by liver x receptors
Zelcer, N., Khanlou, N., Clare, R., Jiang, Q., Reed-Geaghan, E. G., Landreth, G. E., Vinters, H. V., & Tontonoz, P. (2007) · Proceedings of the National Academy of Sciences · doi:10.1073/pnas.0701096104 · Cited by 358
Short-Chain Fatty Acids Improve Poststroke Recovery via Immunological Mechanisms
Sadler, R., Cramer, J. V., Heindl, S., Kostidis, S., Betz, D., Zuurbier, K. R., Northoff, B. H., Heijink, M., Goldberg, M. P., Plautz, E. J., et al. (2019) · Journal of Neuroscience · doi:10.1523/jneurosci.1359-19.2019 · Cited by 347
Altered Gut Microbiome Composition and Tryptic Activity of the 5xFAD Alzheimer’s Mouse Model
Brandscheid, C., Schuck, F., Reinhardt, S., Schäfer, K.-H., Pietrzik, C. U., Grimm, M., Hartmann, T., Schwiertz, A., & Endres, K. (2017) · Journal of Alzheimer s Disease · doi:10.3233/jad-160926 · Cited by 318
Kierdorf, K., & Prinz, M. (2017) · Journal of Clinical Investigation · doi:10.1172/jci90602 · Cited by 305
Self-citationHyman, B., Marzloff, K., & Arriagada, P. (1993) · Journal of Neuropathology and Experimental Neurology · doi:10.1097/00005072-199311000-00006 · Cited by 294
The interplay between the gut microbiota and the immune system
Geuking, M. B., Köller, Y., Rupp, S., & McCoy, K. D. (2014) · Gut Microbes · doi:10.4161/gmic.29330 · Cited by 239
Immune hyperreactivity of Aβ plaque-associated microglia in Alzheimer's disease
Yin, Z., Raj, D., Saiepour, N., Van Dam, D., Brouwer, N., Holtman, I. R., Eggen, B. J. L., Möller, T., Tamm, J. A., Abdourahman, A., et al. (2017) · Neurobiology of Aging · doi:10.1016/j.neurobiolaging.2017.03.021 · Cited by 238
The dynamics of monocytes and microglia in Alzheimer’s disease
Thériault, P., ElAli, A., & Rivest, S. (2015) · Alzheimer s Research & Therapy · doi:10.1186/s13195-015-0125-2 · Cited by 237
Datta, M., Staszewski, O., Raschi, E., Frosch, M., Hagemeyer, N., Tay, T. L., Blank, T., Kreutzfeldt, M., Merkler, D., Ziegler-Waldkirch, S., et al. (2018) · Immunity · doi:10.1016/j.immuni.2018.02.016 · Cited by 206
Self-citationTerwel, D., Steffensen, K. R., Verghese, P. B., Kummer, M. P., Gustafsson, J.-Å., Holtzman, D. M., & Heneka, M. T. (2011) · The Journal of Neuroscience · doi:10.1523/jneurosci.6546-10.2011 · Cited by 190
The fecal microbiome of ALS patients
Brenner, D., Hiergeist, A., Adis, C. I., Mayer, B., Gessner, A., Ludolph, A. C., & Weishaupt, J. H. (2017) · Neurobiology of Aging · doi:10.1016/j.neurobiolaging.2017.09.023 · Cited by 156
Kong, L., & Ge, B.-X. (2008) · Cell Research · doi:10.1038/cr.2008.65 · Cited by 150
ApoE immunoreactivity and microglial cells in Alzheimer’s disease brain
Uchihara, T., Duyckaerts, C., He, Y., Kobayashi, K., Seilhean, D., Amouyel, P., & Hauw, J.-J. (1995) · Neuroscience Letters · doi:10.1016/0304-3940(95)11763-m · Cited by 131
Ziegler‐Waldkirch, S., d’Errico, P., Sauer, J., Erny, D., Savanthrapadian, S., Loreth, D., Katzmarski, N., Blank, T., Bartos, M., Prinz, M., et al. (2017) · The EMBO Journal · doi:10.15252/embj.201797021 · Cited by 123
Self-citationCytokine-producing microglia have an altered beta-amyloid load in aged APP/PS1 Tg mice
Babcock, A. A., Ilkjær, L., Clausen, B. H., Villadsen, B., Dissing-Olesen, L., Bendixen, A. T. M., Lyck, L., Lambertsen, K. L., & Finsen, B. (2015) · Brain, Behavior, and Immunity · doi:10.1016/j.bbi.2015.03.006 · Cited by 107
Spowart-Manning, L., & van der Staay, F. J. (2003) · Behavioural Brain Research · doi:10.1016/j.bbr.2003.08.004 · Cited by 89
How microbiota shape microglial phenotypes and epigenetics
Erny, D., & Prinz, M. (2020) · Glia · doi:10.1002/glia.23822 · Cited by 80
Self-citationGraft-versus-host disease of the CNS is mediated by TNF upregulation in microglia
Mathew, N. R., Vinnakota, J. M., Apostolova, P., Erny, D., Hamarsheh, S., Andrieux, G., Kim, J., Hanke, K., Goldmann, T., Chappell‐Maor, L., et al. (2019) · Journal of Clinical Investigation · doi:10.1172/jci130272 · Cited by 74
Self-citationGut microbes augment neurodegeneration
Erny, D., & Prinz, M. (2017) · Nature · doi:10.1038/nature21910 · Cited by 45
Self-citationZiegler‐Waldkirch, S., Marksteiner, K., Stoll, J., d’Errico, P., Friesen, M., Eiler, D., Neudel, L., Sturn, V., Opper, I., Datta, M., et al. (2018) · Acta Neuropathologica Communications · doi:10.1186/s40478-018-0549-6 · Cited by 30
Self-citationVariations of brain histamine levels in germ-free and nephrectomized rats.
Lr, H., & Rj, H. (1986) · Neurochemical Research · doi:10.1007/bf00967967 · Cited by 19
Research works printed but not linked: 1
- Raivo K (2019) Pheatmap: pretty Heatmaps. R package version 1.0.12., City
Cited by
Sorted by citations
The gut microbiota–brain axis in behaviour and brain disorders
Morais, L. H., Schreiber, H. L., & Mazmanian, S. K. (2021) · Nature Reviews Microbiology · doi:10.1038/s41579-020-00460-0 · Cited by 2,149
Microbiota–gut–brain axis and its therapeutic applications in neurodegenerative diseases
Loh, J. S., Mak, W. Q., Tan, L. K. S., Ng, C. X., Chan, H. H., Yeow, S. H., Foo, J. B., Ong, Y. S., How, C. W., & Khaw, K. Y. (2024) · Signal Transduction and Targeted Therapy · doi:10.1038/s41392-024-01743-1 · Cited by 1,193
Microglia and Central Nervous System–Associated Macrophages—From Origin to Disease Modulation
Prinz, M., Masuda, T., Wheeler, M. A., & Quintana, F. J. (2021) · Annual Review of Immunology · doi:10.1146/annurev-immunol-093019-110159 · Cited by 584
Self-citationNeuroinflammation in Alzheimer disease
Heneka, M. T., van der Flier, W. M., Jessen, F., Hoozemanns, J., Thal, D. R., Boche, D., Brosseron, F., Teunissen, C., Zetterberg, H., Jacobs, A. H., et al. (2025) · Nature Reviews Immunology · doi:10.1038/s41577-024-01104-7 · Cited by 638
Self-citationErny, D., Dokalis, N., Mezö, C., Castoldi, A., Mossad, O., Staszewski, O., Frosch, M., Villa, M., Fuchs, V., Mayer, A., et al. (2021) · Cell Metabolism · doi:10.1016/j.cmet.2021.10.010 · Cited by 478
Self-citation
Metadata
- Authors
- Mezö, C., Dokalis, N., Mossad, O., Staszewski, O., Neuber, J., Yilmaz, B., Schnepf, D., de Agüero, M. G., Ganal-Vonarburg, S. C., Macpherson, A. J., Meyer-Luehmann, M., Staeheli, P., Blank, T., Prinz, M., & Erny, D.
- Affiliations
- University of Freiburg (DE)
- University of Bern (CH)
- Corresponding author
- Erny, Daniel
- ORCID
- Venue
- Acta Neuropathologica Communications
- Published
- 2020-07-29
- Volume
- 8
- Issue
- 1
- Pages
- 119-119
- ISSN
- 2051-5960 (ISSN-L)
- PMC
- PMC7389451
- OpenAlex
- W3046110242
- Cited by
- 120
- References
- 65
- Citations by year
- 2026: 8 · 2025: 20 · 2024: 24 · 2023: 22 · 2022: 21 · 2021: 23 · 2020: 2
- FWCI
- 10.23
- Type
- journal article
- Language
- en
- Open access
- gold
- doi.org
- Locations
- Acta Neuropathologica Communications (publishedVersion, cc-by)
- PubMed Central (publishedVersion, cc-by)
- PubMed (publishedVersion)
- BORIS (University Library Bern) (submittedVersion, cc-by)
- DOAJ (DOAJ: Directory of Open Access Journals) (submittedVersion, cc-by-sa)
- Funders
- Deutsche Forschungsgemeinschaft (SFB/TRR167, SFB 992, SFB1160, Reinhart Koselleck Grant)
- Berta-Ottenstein-Programme
- Dr. Kübler-Chicken-Stiftung (1027095701)
- Topics
- Life Sciences › Neuroscience › Cellular and Molecular Neuroscience › Alzheimer's disease research and treatments
- Life Sciences › Neuroscience › Neurology › Neuroinflammation and Neurodegeneration Mechanisms
- Life Sciences › Biochemistry, Genetics and Molecular Biology › Molecular Biology › Gut microbiota and health
- Keywords
- gut microbiota, Alzheimer's disease, microglia, amyloid-beta clearance, antibiotic therapy, 5xFAD mice, hippocampus, memory impairment, neurodegeneration, phagocytosis, microglial activation, gene expression profiling
- MeSH terms
- Gastrointestinal Microbiome, Alzheimer Disease, Animals, Anti-Bacterial Agents, Disease Models, Animal, Germ-Free Life, Hippocampus, Humans, Male, Amyloid beta-Protein Precursor, Microglia, Mice
About these checks
Registry, retraction, Cites and statistics results are computed, not judged, with one exception: a printed reference that no index lists is read once by a model before it counts as a citation error. Claims are extracted by a model and kept only when their quote appears verbatim in the text; each cited source is then checked, with a model’s help, for whether it says what the claim relies on. Those verdicts can be wrong — read the claim’s quote and the cited source before relying on one.
Statistics and arithmetic are recomputed, not judged.
Confidence bands are shown only for fields calibrated on our annotated test set. None is calibrated yet, so no band is shown.
What counts as a claim ›How we measure confidence ›How we check this ›
Are you an author, or do you see a problem with this page? Request a review
