

The DOI matches its Crossref record; 40 of the 41 references it cites were found in a registry or an index.
Blocking microglial activation of reactive astrocytes is neuroprotective in models of Alzheimer’s disease
Open accessAbstract
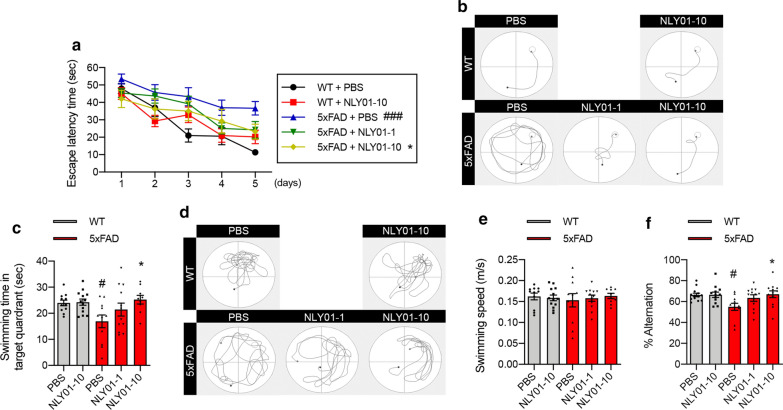
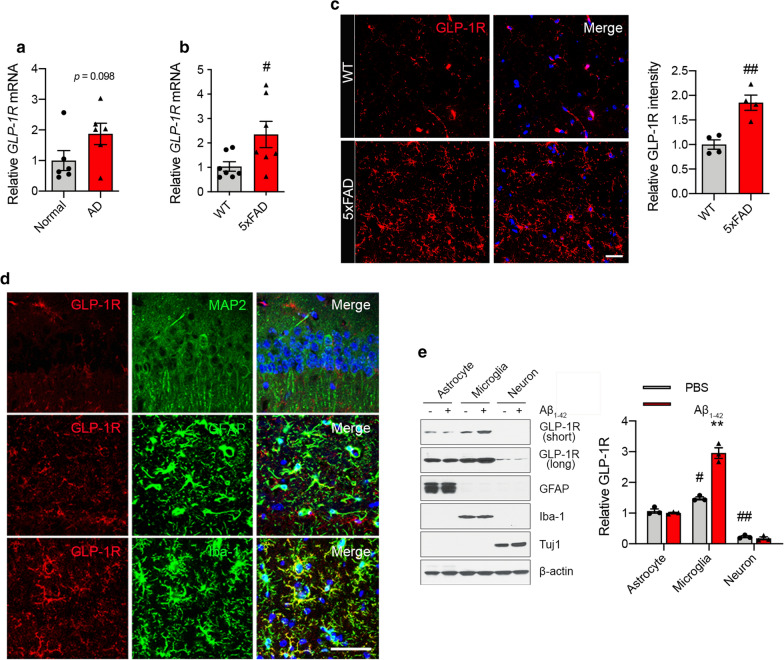
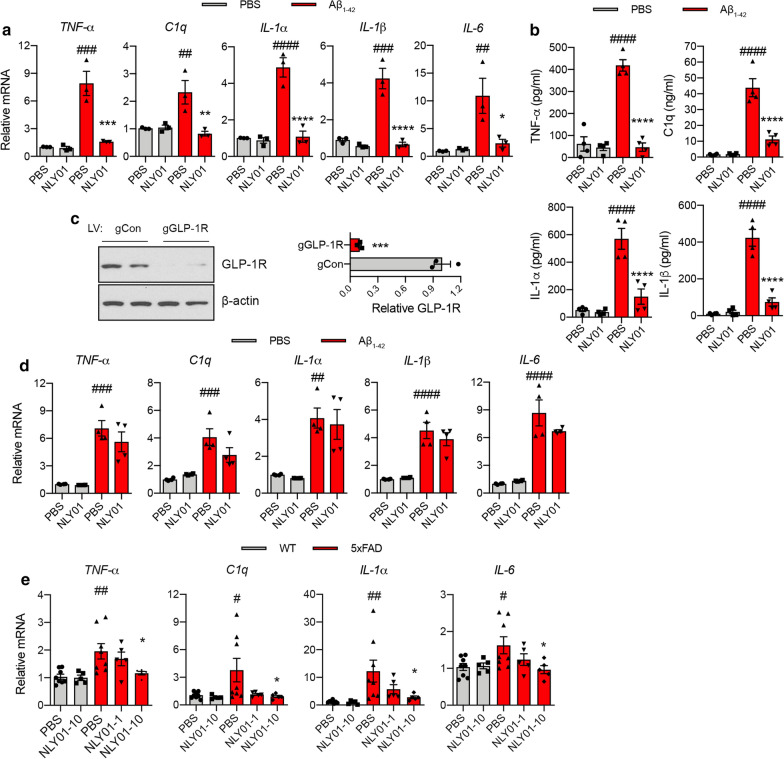
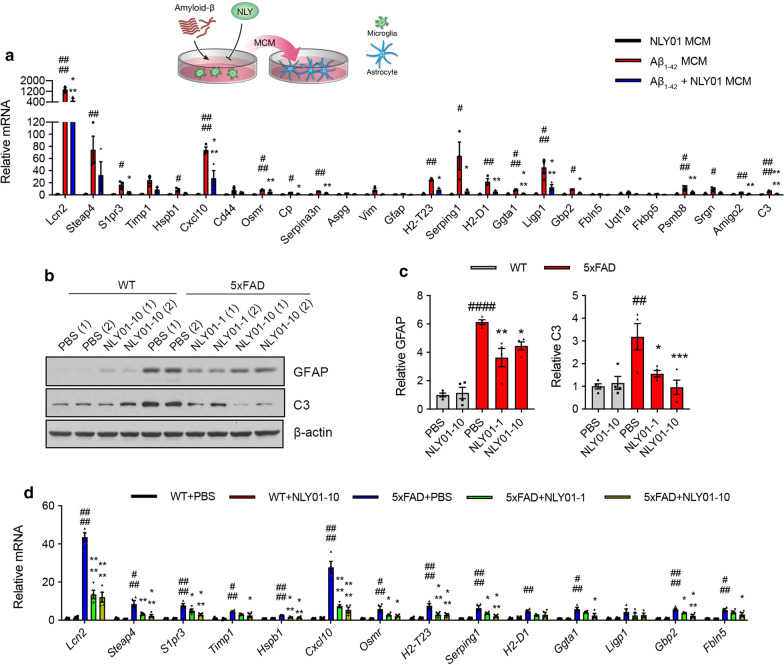
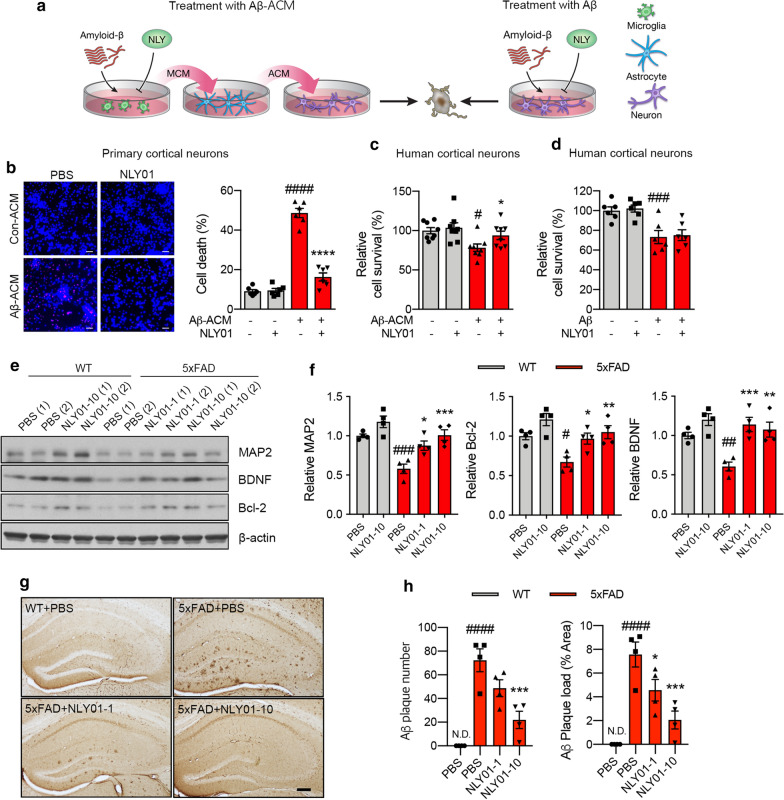
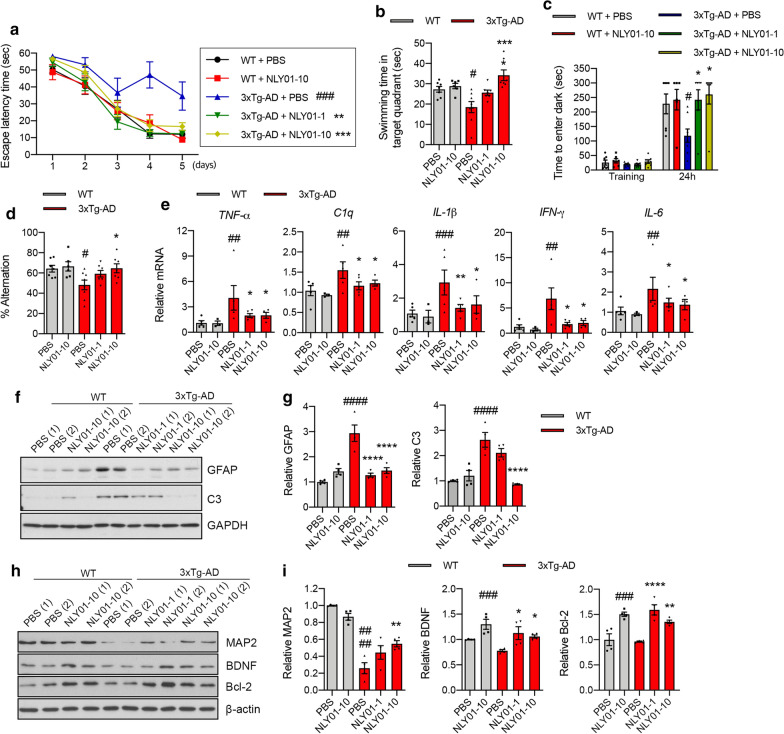
Alzheimer’s disease (AD) is the most common cause of age-related dementia. Increasing evidence suggests that neuroinflammation mediated by microglia and astrocytes contributes to disease progression and severity in AD and other neurodegenerative disorders. During AD progression, resident microglia undergo proinflammatory activation, resulting in an increased capacity to convert resting astrocytes to reactive astrocytes. Therefore, microglia are a major therapeutic target for AD and blocking microglia-astrocyte activation could limit neurodegeneration in AD. Here we report that NLY01, an engineered exedin-4, glucagon-like peptide-1 receptor (GLP-1R) agonist, selectively blocks β-amyloid (Aβ)-induced activation of microglia through GLP-1R activation and inhibits the formation of reactive astrocytes as well as preserves neurons in AD models. In two transgenic AD mouse models (5xFAD and 3xTg-AD), repeated subcutaneous administration of NLY01 blocked microglia-mediated reactive astrocyte conversion and preserved neuronal viability, resulting in improved spatial learning and memory. Our study indicates that the GLP-1 pathway plays a critical role in microglia-reactive astrocyte associated neuroinflammation in AD and the effects of NLY01 are primarily mediated through a direct action on Aβ-induced GLP-1R+ microglia, contributing to the inhibition of astrocyte reactivity. These results show that targeting upregulated GLP-1R in microglia is a viable therapy for AD and other neurodegenerative disorders.
Overview
The claims and statistics of this paper haven’t been checked yet.
Run the check — free, no account needed. It reads the open-access text and checks the sources it cites.
Integrity signals
Registry
Cites
Statistics
Figures
Verification
Claims the paper makes
The claims and statistics of this paper haven’t been checked yet.
Run the check — free, no account needed. It reads the open-access text and checks the sources it cites.
Claims other papers make about this one
Each is checked against this paper’s own text: does it say what the citing paper says it does?
The source backs part of the claim, not all of it — or backs it for a different population, condition or comparison.
In the citing paper
“They are involved in multiple biological pathways that could be beneficial in AD including improvement of BBB integrity and vascular health, promotion of homeostasis in microglia and astrocytes, positive effects on adaptative immune cells (including natural killer cells and activated regulatory T cells), improvement of synaptic viability, and neuroprotection [17–26].”
From evoke and evoke+: design of two large-scale, double-blind, placebo-controlled, phase 3 studies evaluating efficacy, safety, and tolerability of semaglutide in early-stage symptomatic Alzheimer’s disease (2025) · cites this paper as [21]
Experimental — accuracy not yet measuredIn the citing paper
“GLP-1R agonist, NLY01, inhibits Aβ-induced microglial activation via microglial GLP-1R, resulting in reduced reactive astrocyte conversion in both 5xFAD and 3xTg-AD mice.”
From Microbiota–gut–brain axis and its therapeutic applications in neurodegenerative diseases (2024) · cites this paper as [607]
In the citing paper
“Preclinical results in murine models treated with GLP-1RAs suggest that the potential effects of semaglutide in AD may be exerted via impact on several AD-related pathophysiologic processes including neuroinflammatory pathways, vascular and BBB integrity, reduced synaptic loss, and neuroprotection [19, 21, 23–26, 46–48];”
Self-check
Percentages, sums and reported differences re-computed from the paper’s own numbers.
The self-check needs the paper’s full text.
Citations
Cites
Neurotoxic reactive astrocytes are induced by activated microglia
Liddelow, S. A., Guttenplan, K. A., Clarke, L. E., Bennett, F. C., Bohlen, C. J., Schirmer, L., Bennett, M. L., Münch, A. E., Chung, W.-S., Peterson, T. C., et al. (2017) · Nature · doi:10.1038/nature21029 · Cited by 7,971
Self-citationNeuroinflammation in Alzheimer's disease
Heneka, M. T., Carson, M. J., Khoury, J. E., Landreth, G. E., Brosseron, F., Feinstein, D. L., Jacobs, A. H., Wyss-Coray, T., Vitorica, J., Ransohoff, R. M., et al. (2015) · The Lancet Neurology · doi:10.1016/s1474-4422(15)70016-5 · Cited by 6,226
2016 Alzheimer's disease facts and figures
Alzheimer's Association (2016) · Alzheimer's & Dementia · doi:10.1016/j.jalz.2016.03.001 · Cited by 5,069
Triple-Transgenic Model of Alzheimer’s Disease with Plaques and Tangles
Oddo, S., Caccamo, A., Shepherd, J. D., Murphy, M. P., Golde, T. E., Kayed, R., Metherate, R., Mattson, M. P., Akbari, Y., & LaFerla, F. M. (2003) · Neuron · doi:10.1016/s0896-6273(03)00434-3 · Cited by 4,126
Oakley, H., Cole, S. L., Logan, S., Maus, E., Shao, P., Craft, J., Guillozet-Bongaarts, A., Ohno, M., Disterhoft, J., Van Eldik, L., et al. (2006) · The Journal of Neuroscience · doi:10.1523/jneurosci.1202-06.2006 · Cited by 3,530 · cited 1×
“These mice contain five familial AD mutations (APPswe, APPI716V, APPV717I, Psen1M146L, and Psen1L286V) and accumulate high levels of amyloid deposition within 2 months of age with gliosis, resulting in impaired memory function [29].”
BackgroundThe Physiology of Glucagon-like Peptide 1
Holst, J. J. (2007) · Physiological Reviews · doi:10.1152/physrev.00034.2006 · Cited by 3,371
Reactive astrocyte nomenclature, definitions, and future directions
Escartin, C., Galea, E., Lakatos, A., O’Callaghan, J. P., Petzold, G. C., Serrano-Pozo, A., Steinhäuser, C., Volterra, A., Carmignoto, G., Agarwal, A., et al. (2021) · Nature Neuroscience · doi:10.1038/s41593-020-00783-4 · Cited by 2,513 · cited 1×
“Aβ1–42 MCM induced mRNA expression of Lcn2, Osmr, Serpina3n, Ggta1, and C3—genes known to be associated with reactive astrocytes [10, 12, 24] (Fig.”
BackgroundDifferential Roles of M1 and M2 Microglia in Neurodegenerative Diseases
Tang, Y., & Le, W. (2016) · Molecular Neurobiology · doi:10.1007/s12035-014-9070-5 · Cited by 2,190
Immune attack: the role of inflammation in Alzheimer disease
Heppner, F. L., Ransohoff, R. M., & Becher, B. (2015) · Nature Reviews Neuroscience · doi:10.1038/nrn3880 · Cited by 2,134
Astrocyte scar formation aids central nervous system axon regeneration
Anderson, M. A., Burda, J. E., Ren, Y., Ao, Y., O’Shea, T. M., Kawaguchi, R., Coppola, G., Khakh, B. S., Deming, T. J., & Sofroniew, M. V. (2016) · Nature · doi:10.1038/nature17623 · Cited by 1,851
Cited by
Sorted by citations
Microbiota–gut–brain axis and its therapeutic applications in neurodegenerative diseases
Loh, J. S., Mak, W. Q., Tan, L. K. S., Ng, C. X., Chan, H. H., Yeow, S. H., Foo, J. B., Ong, Y. S., How, C. W., & Khaw, K. Y. (2024) · Signal Transduction and Targeted Therapy · doi:10.1038/s41392-024-01743-1 · Cited by 1,193
Astrocytic and microglial cells as the modulators of neuroinflammation in Alzheimer’s disease
Singh, D. (2022) · Journal of Neuroinflammation · doi:10.1186/s12974-022-02565-0 · Cited by 569
Kopp, K. O., Glotfelty, E. J., Li, Y., & Greig, N. H. (2022) · Pharmacological Research · doi:10.1016/j.phrs.2022.106550 · Cited by 298
Reich, N., & Hölscher, C. (2022) · Frontiers in Neuroscience · doi:10.3389/fnins.2022.970925 · Cited by 248
Cummings, J. L., Atri, A., Feldman, H. H., Hansson, O., Sano, M., Knop, F. K., Johannsen, P., León, T., & Scheltens, P. (2025) · Alzheimer's Research & Therapy · doi:10.1186/s13195-024-01666-7 · Cited by 168
Anti-Inflammatory Effects of GLP-1 Receptor Activation in the Brain in Neurodegenerative Diseases
Diz-Chaves, Y., Mastoor, Z., Spuch, C., González-Matías, L. C., & Mallo, F. (2022) · International Journal of Molecular Sciences · doi:10.3390/ijms23179583 · Cited by 148
The mechanism and efficacy of GLP-1 receptor agonists in the treatment of Alzheimer’s disease
Du, H., Meng, X., Yao, Y., & Xu, J. (2022) · Frontiers in Endocrinology · doi:10.3389/fendo.2022.1033479 · Cited by 125
Ren, Y. L., Savadlou, A., Park, S., Siska, P., Epp, J. R., & Sargin, D. (2023) · Frontiers in Neuroendocrinology · doi:10.1016/j.yfrne.2023.101061 · Cited by 137
Nakano-Kobayashi, A., Canela, A., Yoshihara, T., & Hagiwara, M. (2023) · Proceedings of the National Academy of Sciences · doi:10.1073/pnas.2303809120 · Cited by 121
Toader, C., Tătaru, C. P., Munteanu, O., Șerban, M., Covache-Busuioc, R.-A., Ciurea, A. V., & Enyedi, M. (2024) · International Journal of Molecular Sciences · doi:10.3390/ijms252312613 · Cited by 112
Cummings, J. L., Atri, A., Sano, M., Zetterberg, H., Scheltens, P., Knop, F. K., Johannsen, P., Wichmann, C. A., Abschneider, R. M., Leon, T., et al. (2026) · The Lancet · doi:10.1016/s0140-6736(26)00459-9 · Cited by 110
Proteostasis and neurodegeneration: a closer look at autophagy in Alzheimer's disease
Barmaki, H., Nourazarian, A., & Khaki‐Khatibi, F. (2023) · Frontiers in Aging Neuroscience · doi:10.3389/fnagi.2023.1281338 · Cited by 97
Role of glucagon-like peptide-1 receptor agonists in Alzheimer’s disease and Parkinson’s disease
Hong, C.-T., Chen, J.-H., & Hu, C.-J. (2024) · Journal of Biomedical Science · doi:10.1186/s12929-024-01090-x · Cited by 78
Immune Activation in Alzheimer Disease
Mary, A., Mancuso, R., & Heneka, M. T. (2024) · Annual Review of Immunology · doi:10.1146/annurev-immunol-101921-035222 · Cited by 82
Natural product-derived compounds in clinical trials and drug approvals
Butler, M. S., Capon, R. J., Blaskovich, M. A. T., & Henderson, I. R. (2025) · Natural Product Reports · doi:10.1039/d5np00031a · Cited by 86
Glucagon-like peptide 1 receptor agonist use is associated with reduced risk for glaucoma
Sterling, J., Hua, P., Dunaief, J. L., Cui, Q. N., & VanderBeek, B. L. (2023) · British Journal of Ophthalmology · doi:10.1136/bjophthalmol-2021-319232 · Cited by 75
Type 2 Diabetes and Parkinson's Disease: A Focused Review of Current Concepts
Cullinane, P. W., Pablo‐Fernández, E. D., König, A., Outeiro, T. F., Jaunmuktane, Z., & Warner, T. T. (2022) · Movement Disorders · doi:10.1002/mds.29298 · Cited by 78
The Role of Microglia in the Development of Neurodegenerative Diseases
Lee, J., Chun, W., Lee, H. J., Kim, S., Min, J., Kim, D.-Y., Kim, M.-O., Ryu, H. W., & Lee, S. U. (2021) · Biomedicines · doi:10.3390/biomedicines9101449 · Cited by 64
Self-citationErickson, M. A., Shulyatnikova, T. V., Banks, W. A., & Hayden, M. R. (2023) · International Journal of Molecular Sciences · doi:10.3390/ijms24021640 · Cited by 66
Xie, L., Wu, Q., Li, K., Khan, M. A. S., Zhang, A., Sinha, B., Li, S., Chang, S. L., Brody, D. L., Grinstaff, M. W., et al. (2024) · Aging and Disease · doi:10.14336/ad.2024.0134 · Cited by 64
The Amyloid-Beta Clearance: From Molecular Targets to Glial and Neural Cells
Cai, W., Wu, T., & Chen, N. (2023) · Biomolecules · doi:10.3390/biom13020313 · Cited by 69
Chandra, S., Di Meco, A., Dodiya, H. B., Popovic, J., Cuddy, L. K., Weigle, I. Q., Zhang, X., Sadleir, K., Sisodia, S. S., & Vassar, R. (2023) · Molecular Neurodegeneration · doi:10.1186/s13024-023-00635-2 · Cited by 58
Gudkov, S. V., Burmistrov, D. E., Kondakova, E. V., Sarimov, R. M., Yarkov, R. S., Franceschi, C., & Vedunova, M. V. (2022) · Ageing Research Reviews · doi:10.1016/j.arr.2022.101775 · Cited by 57
Jung, M., Lee, S., Park, S., Hong, J., Kim, C., Cho, I., Sohn, H. S., Kim, K. H., Park, I. W., Yoon, S., et al. (2022) · Advanced Materials · doi:10.1002/adma.202207719 · Cited by 59
Self-citationXingi, E., Koutsoudaki, P. N., Thanou, I., Phan, M.-S., Margariti, M., Scheller, A., Tinévez, J.-Y., Kirchhoff, F., & Thomaidou, D. (2023) · Cells · doi:10.3390/cells12101418 · Cited by 53
The role of glial autophagy in Alzheimer’s disease
Litwiniuk, A., Juszczak, G. R., Stankiewicz, A. M., & Urbańska, K. (2023) · Molecular Psychiatry · doi:10.1038/s41380-023-02242-5 · Cited by 54
Forny Germano, L., Koehler, J. A., Baggio, L. L., Cui, F., Wong, C. K., Rittig, N., Cao, X., Matthews, D., & Drucker, D. J. (2024) · Molecular Metabolism · doi:10.1016/j.molmet.2024.102019 · Cited by 50
Ullah, R., & Lee, E. J. (2023) · Experimental Neurobiology · doi:10.5607/en23014 · Cited by 51
Microglia-Mediated Neurovascular Unit Dysfunction in Alzheimer’s Disease
Huang, W., Xia, Q., Zheng, F., Zhao, X. L., Ge, F., Xiao, J., Liu, Z., Shen, Y., Ye, K., Wang, D., et al. (2023) · Journal of Alzheimer s Disease · doi:10.3233/jad-221064 · Cited by 47
Pelle, M. C., Zaffina, I., Giofrè, F., Pujia, R., & Arturi, F. (2023) · International Journal of Molecular Sciences · doi:10.3390/ijms241411301 · Cited by 50
Gharagozloo, M., Smith, M. D., Sotirchos, E. S., Jin, J., Meyers, K. R., Taylor, M., Garton, T. P., Bannon, R. N., Lord, H., Dawson, T. M., et al. (2021) · Neurotherapeutics · doi:10.1007/s13311-021-01088-5 · Cited by 45
Self-citationAstrocyte and oligodendrocyte pathology in Alzheimer's disease
Ziar, R., Tesar, P. J., & Clayton, B. L. L. (2025) · Neurotherapeutics · doi:10.1016/j.neurot.2025.e00540 · Cited by 47
The gut microbiota‐astrocyte axis: Implications for type 2 diabetic cognitive dysfunction
Li, Z.-H., Jiang, Y., Long, C., Peng, Q., & Yue, R. (2023) · CNS Neuroscience & Therapeutics · doi:10.1111/cns.14077 · Cited by 41
Bouvier, D. S., Fixemer, S., Heurtaux, T., Jeannelle, F., Frauenknecht, K. B. M., & Mittelbronn, M. G. A. (2022) · Frontiers in Physiology · doi:10.3389/fphys.2022.814889 · Cited by 43
Lawrence, E. C. N., Guo, M., Schwartz, T. D., Wu, J. J., Lu, J., Nikonov, S. S., Sterling, J. K., & Cui, Q. N. (2023) · Frontiers in Cellular Neuroscience · doi:10.3389/fncel.2023.1156829 · Cited by 43
Neurodegenerative Diseases: Unraveling the Heterogeneity of Astrocytes
Santiago-Balmaseda, A., Aguirre-Orozco, A., Valenzuela-Arzeta, I. E., Villegas-Rojas, M. M., Pérez‐Segura, I., Jiménez-Barrios, N., Hurtado-Robles, E., Rodríguez-Hernández, L. D., Rivera-German, E. R., Guerra‐Crespo, M., et al. (2024) · Cells · doi:10.3390/cells13110921 · Cited by 43
From metabolism to mind: The expanding role of the GLP-1 receptor in neurotherapeutics
Roy, A., Dawson, V. L., & Dawson, T. M. (2025) · Neurotherapeutics · doi:10.1016/j.neurot.2025.e00712 · Cited by 43
Self-citationUrkon, M., Ferencz, E., Szász, J. A., Szabó, M. I. M., Orbán-Kis, K., Szatmári, S., & Nagy, E. E. (2025) · Pharmaceuticals · doi:10.3390/ph18050614 · Cited by 43
Astrocytic Neuroimmunological Roles Interacting with Microglial Cells in Neurodegenerative Diseases
Gotoh, M., Miyamoto, Y., & Ikeshima‐Kataoka, H. (2023) · International Journal of Molecular Sciences · doi:10.3390/ijms24021599 · Cited by 40
Targeted Microglial Attenuation through Dendrimer–Drug Conjugates Improves Glaucoma Neuroprotection
Pitha, I., Kambhampati, S. P., Sharma, A., Sharma, R. B., McCrea, L. T., Mozzer, A., & Kannan, R. M. (2023) · Biomacromolecules · doi:10.1021/acs.biomac.2c01381 · Cited by 39
(Re)building the nervous system: A review of neuron–glia interactions from development to disease
Demmings, M. D., Chagas, L. D. S., Traetta, M. E., Rodrigues, R. S., Acutain, M. F., Barykin, E. P., Datusalia, A. K., German‐Castelan, L., Mattera, V. S., Mazengenya, P., et al. (2024) · Journal of Neurochemistry · doi:10.1111/jnc.16258 · Cited by 44
Tirzepatide shows neuroprotective effects via regulating brain glucose metabolism in APP/PS1 mice
Yang, S., Zhao, X., Zhang, Y., Tang, Q., Li, Y., Du, Y., & yu, P. (2024) · Peptides · doi:10.1016/j.peptides.2024.171271 · Cited by 37
Ma, C., Wu, Y., Song, L., Yin, L., Yin, J.-J., Wang, Q., Yu, J., & Xiao, B. (2022) · Neural Regeneration Research · doi:10.4103/1673-5374.355747 · Cited by 37
Glucagon-like peptide 1 receptor activation: anti-inflammatory effects in the brain
Diz-Chaves, Y., Mastoor, Z., Spuch, C., Lamas, J. A., González-Matías, L. C., & Mallo, F. (2023) · Neural Regeneration Research · doi:10.4103/1673-5374.389626 · Cited by 44
Neurodegeneration and inflammation crosstalk: Therapeutic targets and perspectives
Mohamed, W. M. Y., Kumar, J., Alghamdi, B. S. A., Wadan, A.-H. S., & Yamashita, T. (2022) · IBRO Neuroscience Reports · doi:10.1016/j.ibneur.2022.12.003 · Cited by 40
Zhang, W.-B., Huang, Y. M., Guo, X., Zhang, M.-Q., Yuan, X.-S., & Zu, H. (2023) · Acta Neuropathologica Communications · doi:10.1186/s40478-023-01593-y · Cited by 35
Jadiya, P., Cohen, H. M., Kolmetzky, D. W., Kadam, A. A., Tomar, D., & Elrod, J. W. (2023) · iScience · doi:10.1016/j.isci.2023.106296 · Cited by 35
Nassar, M., Nassar, O., Abosheaishaa, H. M., & Misra, A. (2024) · Journal of Endocrinological Investigation · doi:10.1007/s40618-024-02466-4 · Cited by 34
Semaglutide Ameliorates Diabetic Neuropathic Pain by Inhibiting Neuroinflammation in the Spinal Cord
Lee, S.-O., Kuthati, Y., Huang, W.-H., & Wong, C. (2024) · Cells · doi:10.3390/cells13221857 · Cited by 43
Self-citationLee, J., Kim, S. W., & Kim, K.-T. (2022) · Cells · doi:10.3390/cells11121902 · Cited by 34
Koychev, I. G., Reid, G., Nguyen, M., Mentz, R. J., Joyce, D. W., Shah, S. H., & Holman, R. R. (2024) · Alzheimer s Research & Therapy · doi:10.1186/s13195-024-01573-x · Cited by 37
Allison, R. L., Welby, E., Khayrullina, G., Burnett, B. G., & Ebert, A. D. (2022) · Glia · doi:10.1002/glia.24153 · Cited by 30
Role of astrocytes in sleep deprivation: accomplices, resisters, or bystanders?
Que, M., Li, Y., Wang, X., Zhan, G., Luo, X., & Zhou, Z. (2023) · Frontiers in Cellular Neuroscience · doi:10.3389/fncel.2023.1188306 · Cited by 35
Glial polarization in neurological diseases: Molecular mechanisms and therapeutic opportunities
Liu, Y., Wu, L., Peng, W., & Mao, X. (2024) · Ageing Research Reviews · doi:10.1016/j.arr.2024.102638 · Cited by 32
Ni, L., Zhuge, F., Yang, S., Ma, L., Zheng, A., Zhao, Y., Hu, L., Fu, Z., & Ni, Y. (2021) · Journal of Agricultural and Food Chemistry · doi:10.1021/acs.jafc.1c03541 · Cited by 31
GLP-1 Analogs, SGLT-2, and DPP-4 Inhibitors: A Triad of Hope for Alzheimer’s Disease Therapy
Złotek, M., Kurowska, A., Herbet, M., & Piątkowska‐Chmiel, I. (2023) · Biomedicines · doi:10.3390/biomedicines11113035 · Cited by 30
Zhang, A. Y., Elias, E., & Manners, M. T. (2024) · Neurobiology of Disease · doi:10.1016/j.nbd.2024.106610 · Cited by 30
Rajendran, R., Raghavan, R. P., Al-Sehemi, A. G., Uddin, M. S., Aleya, L., & Mathew, B. (2022) · Environmental Science and Pollution Research · doi:10.1007/s11356-021-17931-3 · Cited by 29
Wei, H., Zhu, Z., Xu, Y., Li, L., Chen, Q., Liu, Y., Li, Y., & Zhu, X. (2024) · Journal of Translational Medicine · doi:10.1186/s12967-024-05256-x · Cited by 28
Meca, A.-D., Boboc, I. K. Ş., Mititelu-Tarțău, L., & Bogdán, M. (2024) · Current Issues in Molecular Biology · doi:10.3390/cimb46060354 · Cited by 29
Mast cell deficiency improves cognition and enhances disease-associated microglia in 5XFAD mice
Lin, C., Hérisson, F., Le, H., Jaafar, N., Chetal, K., Oram, M. K., Flynn, K. L., Gavrilles, E. P., Sadreyev, R. I., Schiffino, F. L., et al. (2023) · Cell Reports · doi:10.1016/j.celrep.2023.113141 · Cited by 29
The promise of GLP-1 receptor agonists for neurodegenerative diseases
Athauda, D. S., Greig, N. H., Meissner, W. G., Foltynie, T., & Gandhi, S. (2026) · Journal of Clinical Investigation · doi:10.1172/jci194745 · Cited by 31
He, Y., Wang, Y., Li, X., Qi, Y., Qu, Z., & Hu, Y. (2024) · NeuroMolecular Medicine · doi:10.1007/s12017-024-08784-3 · Cited by 26
Alzheimer’s-Like Pathology at the Crossroads of HIV-Associated Neurological Disorders
Chemparthy, D. T., Kannan, M., Gordon, L., Buch, S. J., & Sil, S. (2021) · Vaccines · doi:10.3390/vaccines9080930 · Cited by 27
Sun, H., Hao, Y., Liu, H., & Gao, F. (2025) · Frontiers in Immunology · doi:10.3389/fimmu.2025.1525623 · Cited by 32
VanderZwaag, J., Halvorson, T., Dolhan, K., Šimončičová, E., Ben‐Azu, B., & Tremblay, M. (2022) · Neurochemical Research · doi:10.1007/s11064-022-03772-0 · Cited by 28
Pathologic and clinical correlates of region-specific brain GFAP in Alzheimer’s disease
Phillips, J. M., Winfree, R. L., Seto, M., Schneider, J. A., Bennett, D. A., Dumitrescu, L. C., & Hohman, T. J. (2024) · Acta Neuropathologica · doi:10.1007/s00401-024-02828-5 · Cited by 25
Teixeira, L. C. R., Luizon, M. R., & Gomes, K. B. (2025) · Receptors · doi:10.3390/receptors4010002 · Cited by 28
Myeloid cells in retinal and brain degeneration
Guo, M., Schwartz, T. D., Dunaief, J. L., & Cui, Q. N. (2021) · FEBS Journal · doi:10.1111/febs.16177 · Cited by 25
The rise of astrocytes: are they guardians or troublemakers of the brain disorder?
Kim, H. Y., Kim, S., Akaydin, A. N., Kim, S. S., Hyeon, S. J., Lee, J.-H., & Ryu, H. (2026) · Experimental & Molecular Medicine · doi:10.1038/s12276-025-01627-6 · Cited by 28
Self-citationRecent advances in preventing neurodegenerative diseases
Chou, S.-C., Aggarwal, A., Dawson, V. L., Dawson, T. M., & Kam, T. (2021) · Faculty Reviews · doi:10.12703/r/10-81 · Cited by 26
Self-citationWhy to Study Peptides from Venomous and Poisonous Animals?
de Oliveira, A. L. N., Soares, A. M., & Silva, S. L. D. (2023) · International Journal of Peptide Research and Therapeutics · doi:10.1007/s10989-023-10543-0 · Cited by 22
Shan, X., Tao, W., Li, J., Tao, W., Li, D., Zhou, L., Yang, X., Dong, C., Huang, S., Chu, X., et al. (2024) · Journal of Ethnopharmacology · doi:10.1016/j.jep.2024.118145 · Cited by 23
Liu, N., Liang, X., Yang, C., Hu, S., Luo, Q., & Luo, H. (2022) · Theranostics · doi:10.7150/thno.76574 · Cited by 21
Gharagozloo, M., Galleguillos, D., Jank, L., Sotirchos, E. S., Smith, M. D., Garton, T., Kumar, S., Hussein, O., Potluri, S., Taylor, M., et al. (2023) · Neurotherapeutics · doi:10.1007/s13311-023-01390-4 · Cited by 23
Self-citationCozza, A., Chinigò, C., Filicetti, E., Greco, G. I., Lappano, R., Marinaro, C., Muglia, L., Soraci, L., Corsonello, A., Lattanzio, F., et al. (2025) · Ageing Research Reviews · doi:10.1016/j.arr.2025.102834 · Cited by 20
The Role of Astrocytes and Blood–Brain Barrier Disruption in Alzheimer’s Disease
Cruz, J. V. R., Batista, C., Diniz, L. P., & Mendes, F. A. (2023) · Neuroglia · doi:10.3390/neuroglia4030015 · Cited by 20
Huf, F., Gutierres, J. M., da Silva, G. N., Zago, A. M., Koenig, L. F. C., & Fernandes, M. D. C. (2023) · Molecular and Cellular Biochemistry · doi:10.1007/s11010-023-04872-3 · Cited by 19
GLP-1/Sigma/RAGE receptors: An evolving picture of Alzheimer's disease pathology and treatment
Neha, N., Wali, Z., Pinky, P., Hattiwale, S. H., Jamal, A., & Parvez, S. (2023) · Ageing Research Reviews · doi:10.1016/j.arr.2023.102134 · Cited by 19
The Role of Astrocytes and Alpha-Synuclein in Parkinson’s Disease: A Review
Brash-Arias, D., García, L. I., Pérez-Estudillo, C. A., Rojas-Durán, F., Aranda-Abreu, G. E., Herrera‐Covarrubias, D., & Chi-Castañeda, D. (2024) · NeuroSci · doi:10.3390/neurosci5010005 · Cited by 20
Dhamodharan, J., Sekhar, G., & Muthuraman, A. (2022) · Molecules · doi:10.3390/molecules27165182 · Cited by 18
Tian, S. L., Ye, T., & Cheng, X. (2023) · Experimental Neurology · doi:10.1016/j.expneurol.2023.114505 · Cited by 21
Molecular mechanisms implicated in protein changes in the Alzheimer’s disease human hippocampus
Nguyen, H. D., Kim, W.-K., & Vu, G. H. (2024) · Mechanisms of Ageing and Development · doi:10.1016/j.mad.2024.111930 · Cited by 17
Yang, X., Wang, Y., Qiao, Y., Lin, J., Lau, J. K. Y., Fu, W., Fu, A. K. Y., & Ip, N. Y. (2025) · Proceedings of the National Academy of Sciences · doi:10.1073/pnas.2420324122 · Cited by 19
Brain Imaging of the GLP-1 Receptor in Obesity Using 68Ga-NODAGA-Exendin-4 PET
Deden, L. N., Booij, J., Grandjean, J., Homberg, J. R., Hazebroek, E. J., Gotthardt, M., & Boss, M. (2021) · Brain Sciences · doi:10.3390/brainsci11121647 · Cited by 18
Morgado, J., Diniz, L. P., Araújo, A. P. B., Antônio, L. M. D. S., Mota-Araujo, H. P., Pinheiro, P. D. S. M., Sagrillo, F. S., Vargas, G., Ferreira, S. T., Figueiredo, C. P., et al. (2024) · British Journal of Pharmacology · doi:10.1111/bph.16439 · Cited by 18
Satarker, S., Gurram, P. C., Nassar, A., Manandhar, S., Vibhavari, R. J. A., Yarlagadda, D. L., Mudgal, J., Lewis, S. A., Arora, D. S., & Nampoothiri, M. (2023) · Molecular Neurobiology · doi:10.1007/s12035-023-03844-4 · Cited by 16
Prospects of antidiabetic drugs in the treatment of neurodegenerative disease
Hu, L., Wang, W., Chen, X., Bai, G., Ma, L., Yang, X., Shu, Q., & Li, X. (2024) · Brain‐X · doi:10.1002/brx2.52 · Cited by 17
Badina, A. M., Ceyzériat, K., Amossé, Q., Tresh, A., Abjean, L., Guénat, L., Vauthey, E., Tsartsalis, S., Millet, P., & Tournier, B. B. (2025) · Neurobiology of Disease · doi:10.1016/j.nbd.2025.106950 · Cited by 17
Astrocytes and Microglia in Alzheimer's Disease: Friends, Foes, or Both?
Sharma, A., Parekh, B. K., Patil, V., Renuka Jyothi, S., Nayak, P. P., Janney, J. B., Singh, G., & Al-Hasnaawei, S. (2025) · Developmental Neurobiology · doi:10.1002/dneu.23015 · Cited by 17
The Influence of the Gut Microbiota on Alzheimer's Disease: A Narrative Review
Yin, J.-T., Xu, X., Jin, C.-Y., Yuan, X., & Wang, X. (2023) · Journal of Integrative Neuroscience · doi:10.31083/j.jin2202038 · Cited by 15
Youn, D. H., Han, S. W., Kim, J.-T., Choi, H., Lee, A., Kim, N., Jung, H., Hong, E. P., Park, C. H., Lee, Y., et al. (2023) · Acta Neurochirurgica · doi:10.1007/s00701-023-05674-8 · Cited by 15
Leitao, A. D. G., Ahammad, R. U., Spencer, B. J., Wu, C., Masliah, E., & Rissman, R. A. (2023) · Neurobiology of Disease · doi:10.1016/j.nbd.2023.106285 · Cited by 16
Glial cell crosstalk in Parkinson's disease: Mechanisms, implications, and therapeutic strategies
Wang, N., Xiao, X., Chen, Z., Xu, K., Cao, X., Kou, D., & Zeng, J. (2025) · Fundamental Research · doi:10.1016/j.fmre.2024.12.023 · Cited by 18
Refining the interactions between microglia and astrocytes in Alzheimer’s disease pathology
Chen, J., Xu, S., Wang, L., Liu, X., Liu, G., Tan, Q., Li, W., Zhang, S., & Du, Y. (2025) · Neuroscience · doi:10.1016/j.neuroscience.2025.03.033 · Cited by 17
Liao, S., Luo, Y., Chunchai, T., Singhanat, K., Arunsak, B., Benjanuwattra, J., Apaijai, N., Chattipakorn, N., & Chattipakorn, S. C. (2022) · Inflammation Research · doi:10.1007/s00011-022-01590-2 · Cited by 14
Sabbagh, M. N., Cummings, J. L., Ballard, C. G., van der Flier, W. M., Heneka, M. T., Holst, J. J., Knudsen, L. B., Salloway, S., Tansey, M. G., & Drucker, D. J. (2025) · Nature Aging · doi:10.1038/s43587-025-01029-3 · Cited by 15
Altered circadian behavior and light sensing in mouse models of Alzheimer’s disease
Weigel, T. K., Guo, C. L., Güler, A. D., & Ferris, H. A. (2023) · Frontiers in Aging Neuroscience · doi:10.3389/fnagi.2023.1218193 · Cited by 15
A genetic tool for the longitudinal study of a subset of post-inflammatory reactive astrocytes
Agnew‐Svoboda, W., Ubina, T., Figueroa, Z. A., Wong, Y.-C. E., Vizcarra, E. A., Roebini, B., Wilson, E. H., Fiacco, T. A., & Riccomagno, M. M. (2022) · Cell Reports Methods · doi:10.1016/j.crmeth.2022.100276 · Cited by 17
Corraliza-Gómez, M., Vargas-Soria, M., & Garcı́a-Alloza, M. (2025) · Molecular Neurodegeneration · doi:10.1186/s13024-025-00894-1 · Cited by 14
Metadata
- Authors
- Park, J.-S., Kam, T.-I., Lee, S., Park, H., Oh, Y., Kwon, S.-H., Song, J.-J., Kim, D., Kim, H., Jhaldiyal, A., Na, D. H., Lee, K. C., Park, E. J., Pomper, M. G., Pletnikova, O., Troncoso, J. C., Ko, H. S., Dawson, V. L., Dawson, T. M., & Lee, S.
- Affiliations
- Johns Hopkins University (US)
- Chung-Ang University (KR)
- Corresponding author
- Lee, Saebom
- Lee, Seulki
- ORCID
- Venue
- Acta Neuropathologica Communications
- Published
- 2021-04-26
- Volume
- 9
- Issue
- 1
- Pages
- 78-78
- ISSN
- 2051-5960 (ISSN-L)
- PMC
- PMC8074239
- OpenAlex
- W3157204291
- Cited by
- 192
- References
- 41
- Citations by year
- 2026: 30 · 2025: 43 · 2024: 44 · 2023: 41 · 2022: 23 · 2021: 11
- FWCI
- 11.87
- Type
- journal article
- Language
- en
- Open access
- gold
- doi.org
- Locations
- Acta Neuropathologica Communications (publishedVersion, cc-by)
- PubMed Central (publishedVersion, cc-by)
- PubMed (publishedVersion)
- DOAJ (DOAJ: Directory of Open Access Journals) (submittedVersion, cc-by-sa)
- Funders
- Edward N. and Della L. Thome Memorial Foundation
- Maryland Stem Cell Research Fund (2018-MSCRFD-4338)
- National Institute of Neurological Disorders and Stroke (NS38377, NS107404)
- JPB Foundation
- National Research Foundation of Korea
- Topics
- Life Sciences › Neuroscience › Neurology › Neuroinflammation and Neurodegeneration Mechanisms
- Life Sciences › Neuroscience › Cellular and Molecular Neuroscience › Alzheimer's disease research and treatments
- Life Sciences › Neuroscience › Neurology › Neurological Disease Mechanisms and Treatments
- Keywords
- Alzheimer's disease, microglial activation, reactive astrocytes, neuroinflammation, GLP-1 receptor agonists, exenatide, amyloid-beta, astrocyte-microglia interaction, neuroprotection, 5xFAD mice, 3xTg-AD mice, spatial learning and memory, neurodegeneration
- MeSH terms
- Neuroprotection, Glucagon-Like Peptide-1 Receptor, Exenatide, Glucagon-Like Peptide-1 Receptor Agonists, Alzheimer Disease, Animals, Astrocytes, Cells, Cultured, Humans, Male, Mice, Transgenic, Peptide Fragments, Amyloid beta-Peptides, Microglia, Neuroprotective Agents, Maze Learning, Mice
About these checks
Registry, retraction, Cites and statistics results are computed, not judged, with one exception: a printed reference that no index lists is read once by a model before it counts as a citation error. Claims are extracted by a model and kept only when their quote appears verbatim in the text; each cited source is then checked, with a model’s help, for whether it says what the claim relies on. Those verdicts can be wrong — read the claim’s quote and the cited source before relying on one.
Statistics and arithmetic are recomputed, not judged.
Confidence bands are shown only for fields calibrated on our annotated test set. None is calibrated yet, so no band is shown.
What counts as a claim ›How we measure confidence ›How we check this ›
Are you an author, or do you see a problem with this page? Request a review
