

The DOI matches its Crossref record; 16 of the 16 references it cites were found in a registry or an index.
Autism Spectrum Disorder and Particulate Matter Air Pollution before, during, and after Pregnancy: A Nested Case–Control Analysis within the Nurses’ Health Study II Cohort
Abstract
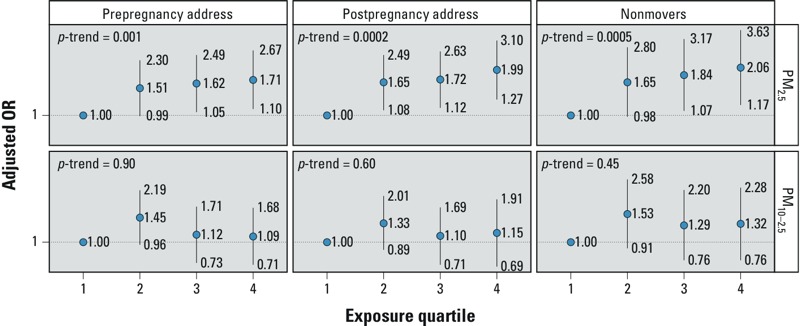
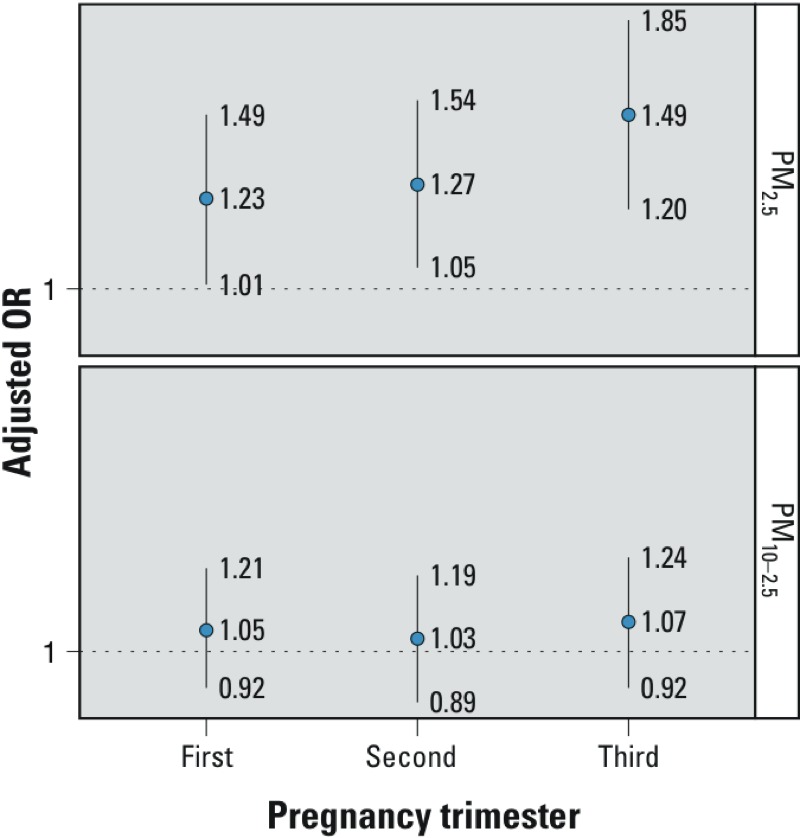
Background: Autism spectrum disorder (ASD) is a developmental disorder with increasing prevalence worldwide, yet has unclear etiology. Objective: We explored the association between maternal exposure to particulate matter (PM) air pollution and odds of ASD in her child. Methods: We conducted a nested case–control study of participants in the Nurses’ Health Study II (NHS II), a prospective cohort of 116,430 U.S. female nurses recruited in 1989, followed by biennial mailed questionnaires. Subjects were NHS II participants’ children born 1990–2002 with ASD (n = 245), and children without ASD (n = 1,522) randomly selected using frequency matching for birth years. Diagnosis of ASD was based on maternal report, which was validated against the Autism Diagnostic Interview-Revised in a subset. Monthly averages of PM with diameters ≤ 2.5 μm (PM2.5) and 2.5–10 μm (PM10–2.5) were predicted from a spatiotemporal model for the continental United States and linked to residential addresses. Results: PM2.5 exposure during pregnancy was associated with increased odds of ASD, with an adjusted odds ratio (OR) for ASD per interquartile range (IQR) higher PM2.5 (4.42 μg/m3) of 1.57 (95% CI: 1.22, 2.03) among women with the same address before and after pregnancy (160 cases, 986 controls). Associations with PM2.5 exposure 9 months before or after the pregnancy were weaker in independent models and null when all three time periods were included, whereas the association with the 9 months of pregnancy remained (OR = 1.63; 95% CI: 1.08, 2.47). The association between ASD and PM2.5 was stronger for exposure during the third trimester (OR = 1.42 per IQR increase in PM2.5; 95% CI: 1.09, 1.86) than during the first two trimesters (ORs = 1.06 and 1.00) when mutually adjusted. There was little association between PM10–2.5 and ASD. Conclusions: Higher maternal exposure to PM2.5 during pregnancy, particularly the third trimester, was associated with greater odds of a child having ASD. Citation: Raz R, Roberts AL, Lyall K, Hart JE, Just AC, Laden F, Weisskopf MG. 2015. Autism spectrum disorder and particulate matter air pollution before, during, and after pregnancy: a nested case–control analysis within the Nurses’ Health Study II cohort. Environ Health Perspect 123:264–270; http://dx.doi.org/10.1289/ehp.1408133
Overview
The claims and statistics of this paper haven’t been checked yet.
Run the check — free, no account needed. It reads the open-access text and checks the sources it cites.
Integrity signals
Registry
Cites
Statistics
Figures
Verification
Claims the paper makes
The claims and statistics of this paper haven’t been checked yet.
Run the check — free, no account needed. It reads the open-access text and checks the sources it cites.
Claims other papers make about this one
Each is checked against this paper’s own text: does it say what the citing paper says it does?
In the citing paper
“Recent clinical cohort studies suggest that prenatal and neonatal exposure to fine and ultrafine particulate air pollution is associated with an increased risk of developmental brain disorders, such as autism spectrum disorder and schizophrenia, in offspring [167–169].”
From Particle toxicology and health - where are we? (2019) · cites this paper as [168]
Self-check
Percentages, sums and reported differences re-computed from the paper’s own numbers.
The self-check needs the paper’s full text.
Citations
Cites
Lord, C., Rutter, M., & Le Couteur, A. (1994) · Journal of Autism and Developmental Disorders · doi:10.1007/bf02172145 · Cited by 9,065
Rice, D., & Barone, S. (2000) · Environmental Health Perspectives · doi:10.1289/ehp.00108s3511 · Cited by 2,944
Genetic Heritability and Shared Environmental Factors Among Twin Pairs With Autism
Hallmayer, J. (2011) · Archives of General Psychiatry · doi:10.1001/archgenpsychiatry.2011.76 · Cited by 1,970
Transcriptomic Analysis of Autistic Brain Reveals Convergent Molecular Pathology
Voineagu, I., Wang, X., Johnston, P., Lowe, J. K., Tian, Y., Horvath, S., Mill, J., Cantor, R. M., Blencowe, B. J., & Geschwind, D. H. (2011) · Nature · doi:10.1038/nature10110 · Cited by 1,874 · cited 2×
“…controls ( n = 17) taken from the Autism Tissue Project, the Harvard Brain Bank, and the MRC London Brain Bank for Neurodegenerative Disease, revealed involve - ment of genes related to synaptic and neuronal signaling dysfunction, and also microglial and immune dysregulation (Voineagu et al. 2011).”
MethodResultNegative Controls: A Tool for Detecting Confounding and Bias in Observational Studies
Lipsitch, M., Tchetgen Tchetgen, E., & Cohen, T. (2010) · Epidemiology · doi:10.1097/ede.0b013e3181d61eeb · Cited by 1,583
Maternal Infection Requiring Hospitalization During Pregnancy and Autism Spectrum Disorders
Atladóttir, H. Ó., Thorsen, P., Østergaard, L., Schendel, D. E., Lemcke, S., Abdallah, M., & Parner, E. T. (2010) · Journal of Autism and Developmental Disorders · doi:10.1007/s10803-010-1006-y · Cited by 916
Traffic-Related Air Pollution, Particulate Matter, and Autism
Volk, H. E., Lurmann, F., Penfold, B., Hertz-Picciotto, I., & McConnell, R. (2013) · JAMA Psychiatry · doi:10.1001/jamapsychiatry.2013.266 · Cited by 638 · cited 4×
“Further analysis of the CHARGE study group in a subset of 279 cases and 245 controls using data from the U.S. EPA Air Quality System suggested positive associations of ASD with traffic-related air pollution during pregnancy, and specifically with PM 2.5 (Volk et al. 2013).”
BackgroundMethodInfluentialWindham, G. C., Zhang, L., Gunier, R., Croen, L. A., & Grether, J. K. (2006) · Environmental Health Perspectives · doi:10.1289/ehp.9120 · Cited by 424
Ambient Air Pollution and Autism in Los Angeles County, California
Becerra, T. A., Wilhelm, M., Olsen, J., Cockburn, M., & Ritz, B. (2013) · Environmental Health Perspectives · doi:10.1289/ehp.1205827 · Cited by 355
Residential Proximity to Freeways and Autism in the CHARGE Study
Volk, H. E., Hertz-Picciotto, I., Delwiche, L., Lurmann, F., & McConnell, R. (2011) · Environmental Health Perspectives · doi:10.1289/ehp.1002835 · Cited by 347
Roberts, A. L., Lyall, K., Hart, J. E., Laden, F., Just, A. C., Bobb, J. F., Koenen, K. C., Ascherio, A., & Weisskopf, M. G. (2013) · Environmental Health Perspectives · doi:10.1289/ehp.1206187 · Cited by 306
Self-citationHertz‐Picciotto, I., Park, H., Dostal, M., Kocan, A., Trnovec, T., & Sram, R. (2008) · Basic & Clinical Pharmacology & Toxicology · doi:10.1111/j.1742-7843.2007.00190.x · Cited by 253
Autistic disorder and viral infections
Libbey, J., Sweeten, T., McMahon, W., & Fujinami, R. (2005) · Journal of NeuroVirology · doi:10.1080/13550280590900553 · Cited by 252
Peripheral and central inflammation in autism spectrum disorders
Depino, A. M. (2013) · Molecular and Cellular Neuroscience · doi:10.1016/j.mcn.2012.10.003 · Cited by 189
Grønborg, T. K., Schendel, D. E., & Parner, E. T. (2013) · JAMA Pediatrics · doi:10.1001/jamapediatrics.2013.2259 · Cited by 180
Kalkbrenner, A. E., Braun, J. M., Durkin, M. S., Maenner, M. J., Cunniff, C., Lee, L.-C., Pettygrove, S., Nicholas, J. S., & Daniels, J. L. (2012) · Environmental Health Perspectives · doi:10.1289/ehp.1104556 · Cited by 82
Research works printed but not linked: 31
- Careaga, 2013, Increased anti-phospholipid antibodies in autism spectrum disorders., Mediators Inflamm, 935608, 10.1155/2013/935608 · DOI
- Constantino, 2003, Validation of a brief quantitative measure of autistic traits: comparison of the social responsiveness scale with the autism diagnostic interview-revised., J Autism Dev Disord, 33, 427, 10.1023/A:1025014929212 · DOI · Paper page
- Constantino, 2000, Reciprocal social behavior in children with and without pervasive developmental disorders., J Dev Behav Pediatr, 21, 2, 10.1097/00004703-200002000-00002 · DOI · Paper page
- Croen, 2006, A comparison of health care utilization and costs of children with and without autism spectrum disorders in a large group-model health plan., Pediatrics, 118, e1203, 10.1542/peds.2006-0127 · DOI
- Crump, 1998, Influence of prenatal mercury exposure upon scholastic and psychological test performance: benchmark analysis of a New Zealand cohort., Risk Anal, 18, 701, 10.1023/B:RIAN.0000005917.52151.e6 · DOI · Paper page
- Flanders, 2011, A method for detection of residual confounding in time-series and other observational studies., Epidemiology, 22, 59, 10.1097/EDE.0b013e3181fdcabe · DOI
- Gadad, 2013, Neuropathology and animal models of autism: genetic and environmental factors., Autism Res Treat, 731935, 10.1155/2013/731935 · DOI
- Grandjean, 2006, Developmental neurotoxicity of industrial chemicals., Lancet, 368, 2167, 10.1016/S0140-6736(06)69665-7 · DOI · Paper page
- Gray, 2013, Race, socioeconomic status, and air pollution exposure in North Carolina., Env Res, 126, 152, 10.1016/j.envres.2013.06.005 · DOI
- Hertz-Picciotto, 2005, Air pollution and lymphocyte phenotype proportions in cord blood., Environ Health Perspect, 113, 1391, 10.1289/ehp.7610 · DOI
- Leslie, 2007, Health care expenditures associated with autism spectrum disorders., Arch Pediatr Adolesc Med, 161, 350, 10.1001/archpedi.161.4.350 · DOI
- Li, 2003, Ultrafine particulate pollutants induce oxidative stress and mitochondrial damage., Environ Health Perspect, 111, 455, 10.1289/ehp.6000 · DOI · Paper page
- Lyall, 2012, Fertility therapies, infertility and autism spectrum disorders in the Nurses’ Health Study II., Paediatr Perinat Epidemiol, 26, 361, 10.1111/j.1365-3016.2012.01294.x · DOI
- Mandell, 2006, Medicaid expenditures for children with autistic spectrum disorders: 1994 to 1999., J Autism Dev Disord, 36, 475, 10.1007/s10803-006-0088-z · DOI
- McFadden, 2013, Evidence for dysregulation of axonal growth and guidance in the etiology of ASD., Front Hum Neurosci, 7, 671, 10.3389/fnhum.2013.00671 · DOI
- MohanKumar, 2008, Particulate matter, oxidative stress and neurotoxicity., Neurotoxicology, 29, 479, 10.1016/j.neuro.2007.12.004 · DOI
- Napoli, 2013, Evidence of reactive oxygen species-mediated damage to mitochondrial DNA in children with typical autism., Mol Autism, 4, 2, 10.1186/2040-2392-4-2 · DOI
- Patterson, 2011, Maternal infection and immune involvement in autism., Trends Mol Med, 17, 389, 10.1016/j.molmed.2011.03.001 · DOI · Paper page
- Perera, 2009, Prenatal airborne polycyclic aromatic hydrocarbon exposure and child IQ at age 5 years., Pediatrics, 124, e195, 10.1542/peds.2008-3506 · DOI · Paper page
- Quaak, 2013, The dynamics of autism spectrum disorders: how neurotoxic compounds and neurotransmitters interact., Int J Environ Res Public Health, 10, 3384, 10.3390/ijerph10083384 · DOI
- Raz, 2013, A survey of out-of-pocket expenditures for children with autism spectrum disorder in Israel., J Autism Dev Disord, 43, 2295, 10.1007/s10803-013-1782-2 · DOI
- Rodier, 1995, Developing brain as a target of toxicity., Environ Health Perspect, 103, 73, 10.1289/ehp.95103s673 · DOI
- Shimabukuro, 2008, Medical expenditures for children with an autism spectrum disorder in a privately insured population., J Autism Dev Disord, 38, 546, 10.1007/s10803-007-0424-y · DOI
- Solomon, 1997, A prospective study of pregravid determinants of gestational diabetes mellitus., JAMA, 278, 1078, 10.1001/jama.1997.03550130052036 · DOI
- Stillerman, 2008, Environmental exposures and adverse pregnancy outcomes: a review of the science., Reprod Sci, 15, 631, 10.1177/1933719108322436 · DOI
- Stoner, 2014, Patches of disorganization in the neocortex of children with autism., N Engl J Med, 370, 1209, 10.1056/NEJMoa1307491 · DOI · Paper page
- Su, 2009, Predicting traffic-related air pollution in Los Angeles using a distance decay regression selection strategy., Environ Res, 109, 657, 10.1016/j.envres.2009.06.001 · DOI
- Suglia, 2008, Association of black carbon with cognition among children in a prospective birth cohort study., Am J Epidemiol, 167, 280, 10.1093/aje/kwm308 · DOI
- Yanosky, 2014, Spatio-temporal modeling of particulate air pollution in the conterminous United States using geographic and meteorological predictors., Environ Health, 13, 63, 10.1186/1476-069X-13-63 · DOI
- Yanosky, 2008, Spatio-temporal modeling of chronic PM10 exposure for the Nurses’ Health Study., Atmos Env (1994), 42, 4047, 10.1016/j.atmosenv.2008.01.044 · DOI
- Yanosky, 2009, Predicting chronic fine and coarse particulate exposures using spatiotemporal models for the Northeastern and Midwestern United States., Environ Health Perspect, 117, 522, 10.1289/ehp.11692 · DOI
Cited by
Sorted by citations
Is there a link between air pollution and mental disorders?
Buoli, M., Grassi, S., Caldiroli, A., Carnevali, G. S., Mucci, F., Iodice, S., Cantone, L., Pergoli, L., & Bollati, V. (2018) · Environment International · doi:10.1016/j.envint.2018.05.044 · Cited by 370
The microbiota-gut-brain axis and its potential therapeutic role in autism spectrum disorder
Li, Q., & Zhou, J.-M. (2016) · Neuroscience · doi:10.1016/j.neuroscience.2016.03.013 · Cited by 253
A Systematic Review and Meta-Analysis of Multiple Airborne Pollutants and Autism Spectrum Disorder
Lam, J., Sutton, P., Kalkbrenner, A., Windham, G., Halladay, A., Koustas, E., Lawler, C., Davidson, L., Daniels, N., Newschaffer, C., et al. (2016) · PLOS ONE · doi:10.1371/journal.pone.0161851 · Cited by 247
“2014 [61] Casecontrol Children of Nurses’ Health Study II participants born between 1990–2002 in the US 245 children with ASD and 1,522 controls Modeled concentration from monitoring data for two pollutants (PM10 and PM10-2.”
Allen, J. L., Oberdorster, G., Morris-Schaffer, K., Wong, C., Klocke, C., Sobolewski, M., Conrad, K., Mayer-Proschel, M., & Cory-Slechta, D. A. (2017) · NeuroToxicology · doi:10.1016/j.neuro.2015.12.014 · Cited by 241
Prenatal factors associated with autism spectrum disorder (ASD)
Ornoy, A., Weinstein-Fudim, L., & Ergaz, Z. (2015) · Reproductive Toxicology · doi:10.1016/j.reprotox.2015.05.007 · Cited by 238
Metadata
- Authors
- Raz, R., Roberts, A. L., Lyall, K., Hart, J. E., Just, A. C., Laden, F., & Weisskopf, M. G.
- Venue
- Environmental Health Perspectives
- Publisher
- American Chemical Society (ACS)
- Published
- 2014-12-18
- Volume
- 123
- Issue
- 3
- Pages
- 264-270
- ISSN
- 0091-6765
- 1552-9924
- PMC
- PMC4348742
- Cited by
- 334
- References
- 16
- Language
- en
About these checks
Registry, retraction, Cites and statistics results are computed, not judged, with one exception: a printed reference that no index lists is read once by a model before it counts as a citation error. Claims are extracted by a model and kept only when their quote appears verbatim in the text; each cited source is then checked, with a model’s help, for whether it says what the claim relies on. Those verdicts can be wrong — read the claim’s quote and the cited source before relying on one.
Statistics and arithmetic are recomputed, not judged.
Confidence bands are shown only for fields calibrated on our annotated test set. None is calibrated yet, so no band is shown.
What counts as a claim ›How we measure confidence ›How we check this ›
Are you an author, or do you see a problem with this page? Request a review
