

The DOI matches its Crossref record; 59 of the 59 references it cites were found in a registry or an index.
The Mechanochemistry of Endocytosis
Open accessAbstract
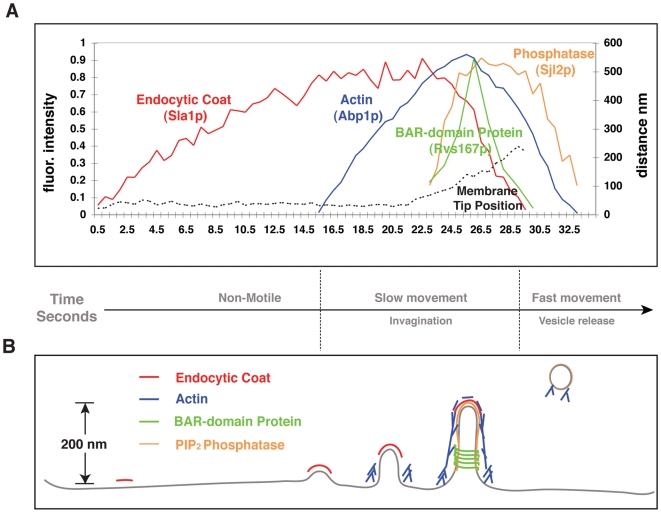
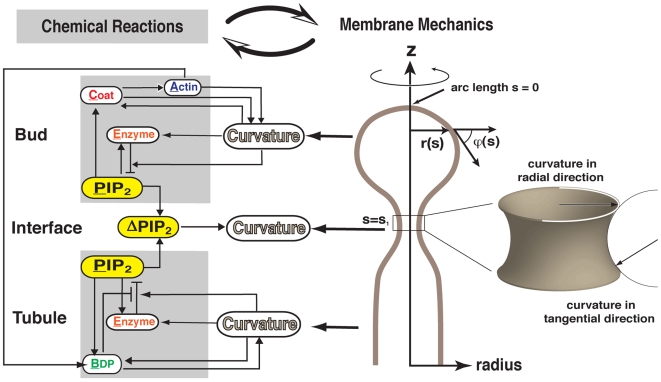
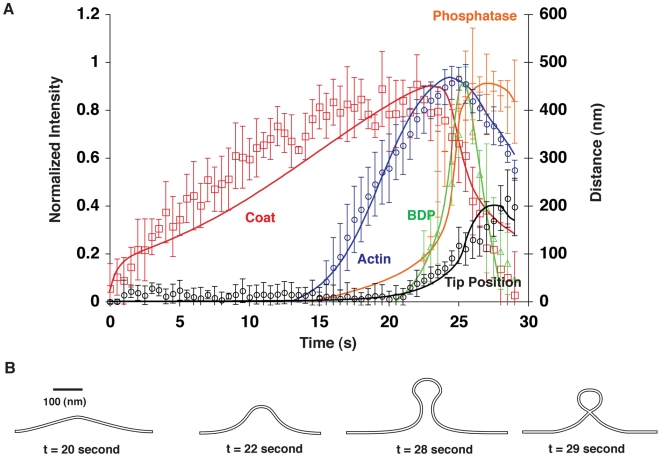
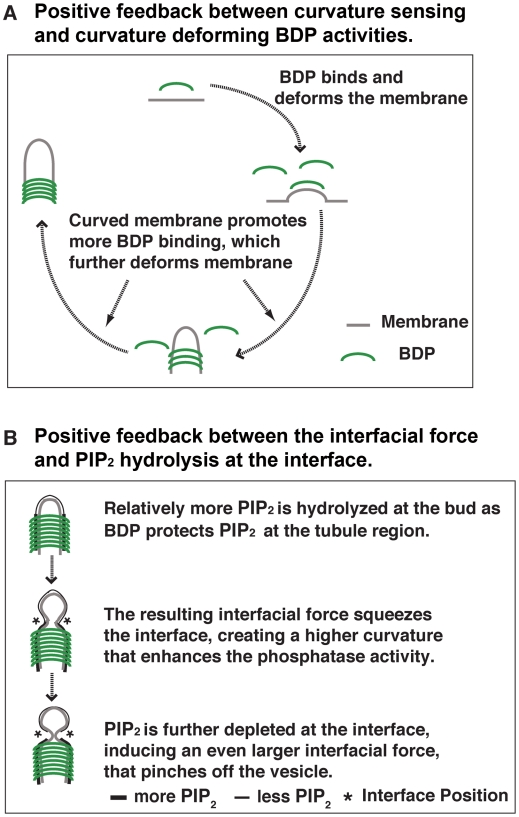
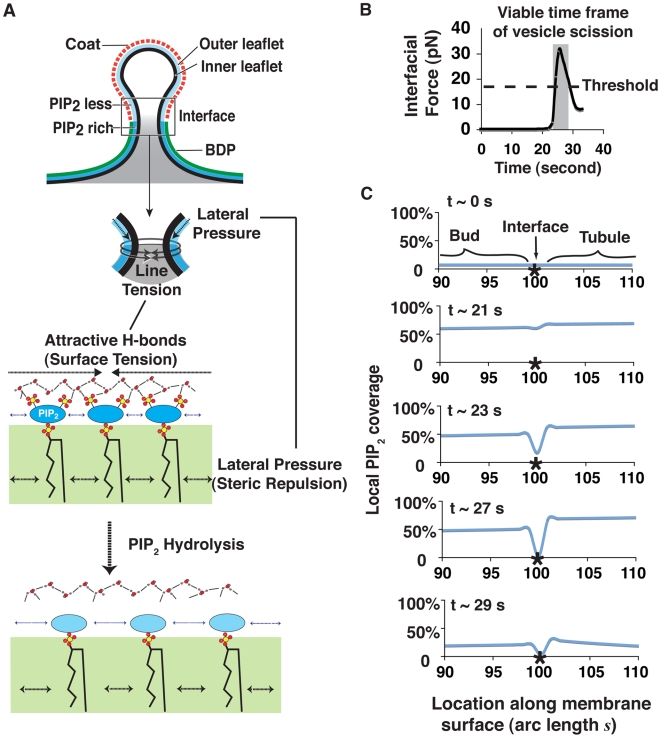
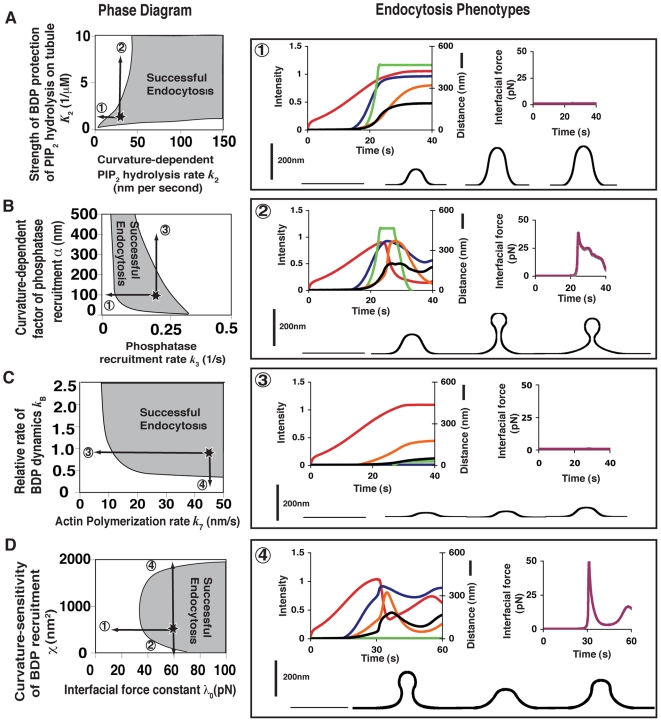
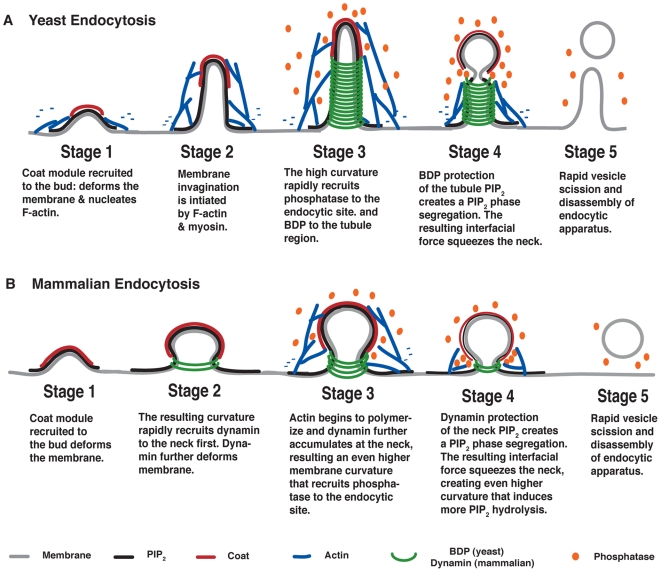
Endocytic vesicle formation is a complex process that couples sequential protein recruitment and lipid modifications with dramatic shape transformations of the plasma membrane. Although individual molecular players have been studied intensively, how they all fit into a coherent picture of endocytosis remains unclear. That is, how the proper temporal and spatial coordination of endocytic events is achieved and what drives vesicle scission are not known. Drawing upon detailed knowledge from experiments in yeast, we develop the first integrated mechanochemical model that quantitatively recapitulates the temporal and spatial progression of endocytic events leading to vesicle scission. The central idea is that membrane curvature is coupled to the accompanying biochemical reactions. This coupling ensures that the process is robust and culminates in an interfacial force that pinches off the vesicle. Calculated phase diagrams reproduce endocytic mutant phenotypes observed in experiments and predict unique testable endocytic phenotypes in yeast and mammalian cells. The combination of experiments and theory in this work suggest a unified mechanism for endocytic vesicle formation across eukaryotes.
Overview
The claims and statistics of this paper haven’t been checked yet.
Run the check — free, no account needed. It reads the open-access text and checks the sources it cites.
Integrity signals
Registry
Cites
Statistics
Figures
Verification
Claims the paper makes
The claims and statistics of this paper haven’t been checked yet.
Run the check — free, no account needed. It reads the open-access text and checks the sources it cites.
Claims other papers make about this one
Each is checked against this paper’s own text: does it say what the citing paper says it does?
The source backs part of the claim, not all of it — or backs it for a different population, condition or comparison.
In the citing paper
“Thereafter, endocytic proteins such as Synaptojanin 1, Endophilin A, Syndapin 1, and Dynamin 1 can further curve the membrane and generate vesicles47–50.”
From Membrane compression by synaptic vesicle exocytosis triggers ultrafast endocytosis (2023) · cites this paper as [47]
Experimental — accuracy not yet measured
Self-check
Percentages, sums and reported differences re-computed from the paper’s own numbers.
The self-check needs the paper’s full text.
Citations
Cites
Intermolecular and Surface Forces
(2011) · Elsevier eBooks · doi:10.1016/b978-0-12-391927-4.10024-6 · Cited by 17,242
Intermolecular and Surface Forces
(2011) · Elsevier eBooks · doi:10.1016/c2011-0-05119-0 · Cited by 9,159
Regulated portals of entry into the cell
Conner, S. D., & Schmid, S. L. (2003) · Nature · doi:10.1038/nature01451 · Cited by 3,958
Phosphoinositides in cell regulation and membrane dynamics
Di Paolo, G., & De Camilli, P. (2006) · Nature · doi:10.1038/nature05185 · Cited by 2,790
Membrane curvature and mechanisms of dynamic cell membrane remodelling
McMahon, H. T., & Gallop, J. L. (2005) · Nature · doi:10.1038/nature04396 · Cited by 2,205
BAR Domains as Sensors of Membrane Curvature: The Amphiphysin BAR Structure
Peter, B. J., Kent, H. M., Mills, I. G., Vallis, Y., Butler, P. J. G., Evans, P. R., & McMahon, H. T. (2004) · Science · doi:10.1126/science.1092586 · Cited by 1,636
The dynamin superfamily: universal membrane tubulation and fission molecules?
Praefcke, G. J. K., & McMahon, H. T. (2004) · Nature Reviews Molecular Cell Biology · doi:10.1038/nrm1313 · Cited by 1,370
Structure and dynamics of membranes
Lipowsky, R., & Sackmann, E. (1995) · Cited by 956
PIP2and Proteins: Interactions, Organization, and Information Flow
McLaughlin, S., Wang, J., Gambhir, A., & Murray, D. (2002) · Annual Review of Biophysics and Biomolecular Structure · doi:10.1146/annurev.biophys.31.082901.134259 · Cited by 837
A Modular Design for the Clathrin- and Actin-Mediated Endocytosis Machinery
Kaksonen, M., Toret, C. P., & Drubin, D. G. (2005) · Cell · doi:10.1016/j.cell.2005.09.024 · Cited by 726
Self-citation
Cited by
Sorted by citations
Dynamin, a membrane-remodelling GTPase
Ferguson, S. M., & Camilli, P. V. D. (2012) · Nature Reviews Molecular Cell Biology · doi:10.1038/nrm3266 · Cited by 1,027
A High Precision Survey of the Molecular Dynamics of Mammalian Clathrin-Mediated Endocytosis
Taylor, M. J., Perrais, D., & Merrifield, C. J. (2011) · PLoS Biology · doi:10.1371/journal.pbio.1000604 · Cited by 754
Regulation of the Actin Cytoskeleton-Plasma Membrane Interplay by Phosphoinositides
Saarikangas, J., Zhao, H., & Lappalainen, P. (2010) · Physiological Reviews · doi:10.1152/physrev.00036.2009 · Cited by 515
Saheki, Y., & De Camilli, P. (2012) · Cold Spring Harbor Perspectives in Biology · doi:10.1101/cshperspect.a005645 · Cited by 457
Mechanisms of Membrane Curvature Sensing
Antonny, B. (2011) · Annual Review of Biochemistry · doi:10.1146/annurev-biochem-052809-155121 · Cited by 442
Roles for actin assembly in endocytosis
Mooren, O. L., Galletta, B. J., & Cooper, J. A. (2012) · Annual Review of Biochemistry · doi:10.1146/annurev-biochem-060910-094416 · Cited by 394
Boucrot, E., Pick, A., Çamdere, G. Ö., Liska, N., Evergren, E., McMahon, H. T., & Kozlov, M. M. (2012) · Cell · doi:10.1016/j.cell.2012.01.047 · Cited by 353
Milošević, I., Giovedì, S., Lou, X., Raimondi, A., Collesi, C., Shen, H., Paradise, S., O'Toole, E. T., Ferguson, S. M., Cremona, O., et al. (2011) · Neuron · doi:10.1016/j.neuron.2011.08.029 · Cited by 357
Endocytosis and signaling: Cell logistics shape the eukaryotic cell plan
Sigismund, S., Confalonieri, S., Ciliberto, A., Polo, S., Scita, G., & Di Fiore, P. P. (2012) · Physiological Reviews · doi:10.1152/physrev.00005.2011 · Cited by 338
Plasma Membrane Reshaping during Endocytosis Is Revealed by Time-Resolved Electron Tomography
Kukulski, W., Schorb, M., Kaksonen, M., & Briggs, J. A. G. (2012) · Cell · doi:10.1016/j.cell.2012.05.046 · Cited by 328
Role of Phospholipids in Endocytosis, Phagocytosis, and Macropinocytosis
Bohdanowicz, M., & Grinstein, S. (2013) · Physiological Reviews · doi:10.1152/physrev.00002.2012 · Cited by 326
Nanoscale manipulation of membrane curvature for probing endocytosis in live cells
Zhao, W., Hanson, L., Lou, H.-Y., Akamatsu, M., Chowdary, P. D., Santoro, F., Marks, J. R., Grassart, A., Drubin, D. G., Cui, Y., et al. (2017) · Nature Nanotechnology · doi:10.1038/nnano.2017.98 · Cited by 302
Self-citationDynamin: functional design of a membrane fission catalyst.
Schmid, S., & Frolov, V. (2011) · Annual Review of Cell and Developmental Biology · doi:10.1146/annurev-cellbio-100109-104016 · Cited by 292
Actin Dynamics Drive Membrane Reorganization and Scission in Clathrin-Independent Endocytosis
Römer, W., Pontani, L.-L., Sorre, B., Rentero, C., Berland, L., Chambon, V., Lamaze, C., Bassereau, P. M., Sykes, C., Gaus, K., et al. (2010) · Cell · doi:10.1016/j.cell.2010.01.010 · Cited by 248
Notch Ligand Endocytosis Generates Mechanical Pulling Force Dependent on Dynamin, Epsins, and Actin
Meloty-Kapella, L., Shergill, B. S., Kuon, J., Botvinick, E. L., & Weinmaster, G. (2012) · Developmental Cell · doi:10.1016/j.devcel.2012.04.005 · Cited by 239
Clathrin-mediated endocytosis in budding yeast
Weinberg, J., & Drubin, D. G. (2012) · Trends in Cell Biology · doi:10.1016/j.tcb.2011.09.001 · Cited by 236
Self-citationNew mechanisms and functions of actin nucleation
Firat‐Karalar, E. N., & Welch, M. D. (2010) · Current Opinion in Cell Biology · doi:10.1016/j.ceb.2010.10.007 · Cited by 233
Protein-driven membrane stresses in fusion and fission
Kozlov, M. M., McMahon, H. T., & Chernomordik, L. (2010) · Trends in Biochemical Sciences · doi:10.1016/j.tibs.2010.06.003 · Cited by 231
Membrane Lipids in Presynaptic Function and Disease
Lauwers, E., Goodchild, R. E., & Verstreken, P. (2016) · Neuron · doi:10.1016/j.neuron.2016.02.033 · Cited by 236
BAR Domain Scaffolds in Dynamin-Mediated Membrane Fission
Daumke, O., Roux, A., & Haucke, V. (2014) · Cell · doi:10.1016/j.cell.2014.02.017 · Cited by 239
Friction Mediates Scission of Tubular Membranes Scaffolded by BAR Proteins
Simunovic, M., Manneville, J., Renard, H., Evergren, E., Raghunathan, K., Bhatia, D. D., Kenworthy, A. K., Voth, G. A., Prost, J., McMahon, H. T., et al. (2017) · Cell · doi:10.1016/j.cell.2017.05.047 · Cited by 210
I-BAR domain proteins: linking actin and plasma membrane dynamics
Zhao, H., Pykäläinen, A., & Lappalainen, P. (2010) · Current Opinion in Cell Biology · doi:10.1016/j.ceb.2010.10.005 · Cited by 208
Dissipative structures in biological systems: bistability, oscillations, spatial patterns and waves
Goldbeter, A. (2018) · Philosophical Transactions of the Royal Society A Mathematical Physical and Engineering Sciences · doi:10.1098/rsta.2017.0376 · Cited by 210
Building endocytic pits without clathrin
Johannes, L., Parton, R. G., Bassereau, P. M., & Mayor, S. (2015) · Nature Reviews Molecular Cell Biology · doi:10.1038/nrm3968 · Cited by 214
Bridging membrane and cytoskeleton dynamics in the secretory and endocytic pathways
Anitei, M., & Hoflack, B. (2011) · Nature Cell Biology · doi:10.1038/ncb2409 · Cited by 218
Molecules, mechanisms, and cellular roles of clathrin-independent endocytosis
Howes, M. T., Mayor, S., & Parton, R. G. (2010) · Current Opinion in Cell Biology · doi:10.1016/j.ceb.2010.04.001 · Cited by 200
Antonescu, C. N., Aguet, F., Danuser, G. M., & Schmid, S. L. (2011) · Molecular Biology of the Cell · doi:10.1091/mbc.e11-04-0362 · Cited by 180
Lipid-Mediated EndocytosisPreprint
Ewers, H., & Helenius, A. (2011) · Cold Spring Harbor Perspectives in Biology · doi:10.1101/cshperspect.a004721 · Cited by 177
Chang-Ileto, B., Frère, S. G. A., Chan, R., Voronov, S. V., Roux, A., & Paolo, G. D. (2011) · Developmental Cell · doi:10.1016/j.devcel.2010.12.008 · Cited by 180
Heat shock response in photosynthetic organisms: Membrane and lipid connections
Horváth, I., Glatz, A., Nakamoto, H., Mishkind, M., Munnik, T., Saidi, Y., Goloubinoff, P., Harwood, J. L., & Vígh, L. (2012) · Progress in Lipid Research · doi:10.1016/j.plipres.2012.02.002 · Cited by 174
Design principles for robust vesiculation in clathrin-mediated endocytosis
Hassinger, J., OSTER, G. F., Drubin, D. G., & Rangamani, P. (2017) · Proceedings of the National Academy of Sciences · doi:10.1073/pnas.1617705114 · Cited by 155
Self-citationCell motility: the integrating role of the plasma membrane
Keren, K. (2011) · European Biophysics Journal · doi:10.1007/s00249-011-0741-0 · Cited by 166
Phosphoinositides in endocytosis
Posor, Y., Eichhorn‐Grünig, M., & Haucke, V. (2014) · Biochimica et Biophysica Acta (BBA) - Molecular and Cell Biology of Lipids · doi:10.1016/j.bbalip.2014.09.014 · Cited by 176
Tsujita, K., Takenawa, T., & Itoh, T. (2015) · Nature Cell Biology · doi:10.1038/ncb3162 · Cited by 149
Akamatsu, M., Vasan, R., Serwas, D., Ferrin, M. A., Rangamani, P., & Drubin, D. G. (2020) · eLife · doi:10.7554/elife.49840 · Cited by 148
Self-citationMembrane-Sculpting BAR Domains Generate Stable Lipid Microdomains
Zhao, H., Michelot, A., Koskela, E. V., Tkach, V., Stamou, D. G., Drubin, D. G., & Lappalainen, P. (2013) · Cell Reports · doi:10.1016/j.celrep.2013.08.024 · Cited by 149
Self-citationSundborger, A., Soderblom, C., Vorontsova, O. V., Evergren, E., Hinshaw, J. E., & Shupliakov, O. (2010) · Journal of Cell Science · doi:10.1242/jcs.072686 · Cited by 143
Safety Evaluation of Nanotechnology Products
Domb, A. J., Sharifzadeh, G., Nahum, V., & Hosseinkhani, H. (2021) · Pharmaceutics · doi:10.3390/pharmaceutics13101615 · Cited by 148
Synaptojanin and Endophilin Mediate Neck Formation during Ultrafast Endocytosis
Watanabe, S., Mamer, L. E., Raychaudhuri, S., Luvsanjav, D., Eisen, J., Trimbuch, T., Söhl-Kielczynski, B., Fenske, P., Milosevic, I., Rosenmund, C., et al. (2018) · Neuron · doi:10.1016/j.neuron.2018.06.005 · Cited by 131
Guo, Y., Terazzi, E., Seemann, R., Fleury, J., & Baulin, V. A. (2016) · Science Advances · doi:10.1126/sciadv.1600261 · Cited by 125
Notch ligand endocytosis: Mechanistic basis of signaling activity
Musse, A. A., Meloty-Kapella, L., & Weinmaster, G. (2012) · Seminars in Cell and Developmental Biology · doi:10.1016/j.semcdb.2012.01.011 · Cited by 122
Nández, R., Balkin, D. M., Messa, M., Liang, L., Paradise, S., Czapla, H., Hein, M. Y., Duncan, J. S., Mann, M., & Camilli, P. V. D. (2014) · eLife · doi:10.7554/elife.02975 · Cited by 128
Endocytic Accessory Factors and Regulation of Clathrin-Mediated EndocytosisPreprint
Merrifield, C. J., & Kaksonen, M. (2014) · Cold Spring Harbor Perspectives in Biology · doi:10.1101/cshperspect.a016733 · Cited by 124
The Evolution of Organellar Coat Complexes and Organization of the Eukaryotic Cell
Rout, M. P., & Field, M. C. (2017) · Annual Review of Biochemistry · doi:10.1146/annurev-biochem-061516-044643 · Cited by 114
Lessons from yeast for clathrin-mediated endocytosis
Boettner, D. R., Chi, R. J., & Lemmon, S. K. (2011) · Nature Cell Biology · doi:10.1038/ncb2403 · Cited by 112
Membrane Fission: The Biogenesis of Transport Carriers
Campelo, F., & Malhotra, V. (2012) · Annual Review of Biochemistry · doi:10.1146/annurev-biochem-051710-094912 · Cited by 114
Berro, J., Sirotkin, V., & Pollard, T. D. (2010) · Molecular Biology of the Cell · doi:10.1091/mbc.e10-06-0494 · Cited by 113
Spillane, K. M., Arroyo, J. O., de Wit, G., Eggeling, C., Ewers, H., Wallace, M. I., & Kukura, P. (2014) · Nano Letters · doi:10.1021/nl502536u · Cited by 110
A role for the dynamin-like protein Vps1 during endocytosis in yeast
Rooij, I. I. S., Allwood, E. G., Aghamohammadzadeh, S., Hettema, E. H., Goldberg, M. W., & Ayscough, K. R. (2010) · Journal of Cell Science · doi:10.1242/jcs.070508 · Cited by 107
Vyleta, N. P., & Smith, S. M. (2011) · Journal of Neuroscience · doi:10.1523/jneurosci.6398-10.2011 · Cited by 107
Endocytic proteins drive vesicle growth via instability in high membrane tension environment
Walani, N., Torres, J., & Agrawal, A. (2015) · Proceedings of the National Academy of Sciences · doi:10.1073/pnas.1418491112 · Cited by 102
Myosin 1E coordinates actin assembly and cargo trafficking during clathrin-mediated endocytosis
Cheng, J. C., Grassart, A., & Drubin, D. G. (2012) · Molecular Biology of the Cell · doi:10.1091/mbc.e11-04-0383 · Cited by 108
Self-citationBhatia, V. K., Hatzakis, N. S., & Stamou, D. G. (2009) · Seminars in Cell and Developmental Biology · doi:10.1016/j.semcdb.2009.12.004 · Cited by 105
Exo70 Generates Membrane Curvature for Morphogenesis and Cell Migration
Zhao, Y., Liu, J., Yang, C., Capraro, B. R., Baumgart, T., Bradley, R. P., Ramakrishnan, N., Xu, X., Radhakrishnan, R., Svitkina, T., et al. (2013) · Developmental Cell · doi:10.1016/j.devcel.2013.07.007 · Cited by 99
Self-citationMembrane shape-mediated wave propagation of cortical protein dynamics
Wu, Z., Su, M., Tong, C., Wu, M., & Liu, J. (2018) · Nature Communications · doi:10.1038/s41467-017-02469-1 · Cited by 98
Self-citationMembrane Mechanics of Endocytosis in Cells with Turgor
Dmitrieff, S., & Nédélec, F. (2015) · PLoS Computational Biology · doi:10.1371/journal.pcbi.1004538 · Cited by 99
Analysis of yeast endocytic site formation and maturation through a regulatory transition point
Carroll, S. Y., Stimpson, H. E. M., Weinberg, J., Toret, C. P., Sun, Y., & Drubin, D. G. (2011) · Molecular Biology of the Cell · doi:10.1091/mbc.e11-02-0108 · Cited by 95
Self-citationSynergistic BAR–NPF interactions in actin-driven membrane remodeling
Suetsugu, S., & Gautreau, A. M. (2012) · Trends in Cell Biology · doi:10.1016/j.tcb.2012.01.001 · Cited by 94
de Curtis, I., & Meldolesi, J. (2012) · Journal of Cell Science · doi:10.1242/jcs.108266 · Cited by 90
Modeling Membrane Curvature Generation due to Membrane–Protein Interactions
Alimohamadi, H., & Rangamani, P. (2018) · Biomolecules · doi:10.3390/biom8040120 · Cited by 87
Multiple roles for actin in secretory and endocytic pathways
Chakrabarti, R., Lee, M., & Higgs, H. N. (2021) · Current Biology · doi:10.1016/j.cub.2021.03.038 · Cited by 87
Arasada, R., & Pollard, T. D. (2011) · Current Biology · doi:10.1016/j.cub.2011.07.046 · Cited by 82
Molecular mechanisms of force production in clathrin‐mediated endocytosis
Lacy, M. M., Ma, R., Ravindra, N. G., & Berro, J. (2018) · FEBS Letters · doi:10.1002/1873-3468.13192 · Cited by 81
Protrusive waves guide 3D cell migration along nanofibers
Guetta-Terrier, C., Monzo, P., Zhu, J., Long, H., Venkatraman, L., Zhou, Y., Wang, P., Chew, S. Y., Mogilner, A. J., Ladoux, B., et al. (2015) · The Journal of Cell Biology · doi:10.1083/jcb.201501106 · Cited by 83
Yadav, S., Garner, K., Georgiev, P., Li, M., Gomez-Espinosa, E., Panda, A., Mathre, S., Okkenhaug, H., Cockcroft, S., & Raghu, P. (2015) · Journal of Cell Science · doi:10.1242/jcs.173476 · Cited by 81
Interfacing Cells with Vertical Nanoscale Devices: Applications and Characterization
McGuire, A. F., Santoro, F., & Cui, B. (2018) · Annual Review of Analytical Chemistry · doi:10.1146/annurev-anchem-061417-125705 · Cited by 80
Effects of foliar application of graphene oxide on cadmium uptake by lettuce
Gao, M., Xu, Y., Chang, X., Dong, Y., & Song, Z. (2020) · Journal of Hazardous Materials · doi:10.1016/j.jhazmat.2020.122859 · Cited by 85
Determinants of endocytic membrane geometry, stability, and scission
Kishimoto, T., Sun, Y., Buser, C., Liu, J., Michelot, A., & Drubin, D. G. (2011) · Proceedings of the National Academy of Sciences · doi:10.1073/pnas.1113413108 · Cited by 79
Self-citationDissecting BAR Domain Function in the Yeast Amphiphysins Rvs161 and Rvs167 during Endocytosis
Youn, J.-Y., Friesen, H., Kishimoto, T., Henne, W. M., Kurat, C. F., Ye, W., Ceccarelli, D. F. J., Sicheri, F., Kohlwein, S. D., McMahon, H. T., et al. (2010) · Molecular Biology of the Cell · doi:10.1091/mbc.e10-03-0181 · Cited by 75
Bending "On the Rocks"--A Cocktail of Biophysical Modules to Build Endocytic PathwaysPreprint
Johannes, L., Wunder, C., & Bassereau, P. M. (2014) · Cold Spring Harbor Perspectives in Biology · doi:10.1101/cshperspect.a016741 · Cited by 84
Membrane bending by actin polymerization
Carlsson, A. E. (2017) · Current Opinion in Cell Biology · doi:10.1016/j.ceb.2017.11.007 · Cited by 78
Emerging roles of the MAGE protein family in stress response pathways
Gee, R. R. F., Chen, H., Lee, A. K., Daly, C. A., Wilander, B. A., Tacer, K. F., & Potts, P. R. (2020) · Journal of Biological Chemistry · doi:10.1074/jbc.rev120.008029 · Cited by 76
Induced Domain Formation in Endocytic Invagination, Lipid Sorting, and Scission
Johannes, L., & Mayor, S. (2010) · Cell · doi:10.1016/j.cell.2010.08.007 · Cited by 77
Mechanochemical crosstalk during endocytic vesicle formation
Liu, J., Sun, Y., Oster, G. F., & Drubin, D. G. (2010) · Current Opinion in Cell Biology · doi:10.1016/j.ceb.2009.11.009 · Cited by 70
Self-citationAn Organized Co-assembly of Clathrin Adaptors Is Essential for Endocytosis
Skružný, M., Desfosses, A., Prinz, S., Dodonova, S., Gieras, A., Uetrecht, C., Jakobi, A. J., Abella, M., Hagen, W. J. H., Schulz, J., et al. (2015) · Developmental Cell · doi:10.1016/j.devcel.2015.02.023 · Cited by 68
Robust polarity establishment occurs via an endocytosis-based cortical corralling mechanism
Jose, M., Tollis, S., Nair, D. K., Sibarita, J., & McCusker, D. (2013) · The Journal of Cell Biology · doi:10.1083/jcb.201206081 · Cited by 68
Chen, H., Victor, A. K., Klein, J. D., Tacer, K. F., Tai, D. J. C., de Esch, C. E. F., Nuttle, A., Temirov, J. P., Burnett, L. C., ROSENBAUM, M. S., et al. (2020) · JCI Insight · doi:10.1172/jci.insight.138576 · Cited by 66
Reconstitution and Protein Composition Analysis of Endocytic Actin Patches
Michelot, A., Costanzo, M., Sarkeshik, A., Boone, C. M., Yates, J. R., & Drubin, D. G. (2010) · Current Biology · doi:10.1016/j.cub.2010.10.016 · Cited by 70
Self-citationRamachandran, R. (2010) · Seminars in Cell and Developmental Biology · doi:10.1016/j.semcdb.2010.09.001 · Cited by 71
Force Generation by Endocytic Actin Patches in Budding Yeast
Carlsson, A. E., & Bayly, P. V. (2014) · Biophysical Journal · doi:10.1016/j.bpj.2014.02.035 · Cited by 64
Systems biology and physical biology of clathrin-mediated endocytosis
Ramanan, V., Agrawal, N. J., Liu, J., Engles, S., Toy, R., & Radhakrishnan, R. (2011) · Integrative Biology · doi:10.1039/c1ib00036e · Cited by 60
Self-citationBasu, R., & Chang, F. (2011) · Current Biology · doi:10.1016/j.cub.2011.04.047 · Cited by 61
Anderson, R. H., Sochacki, K. A., Vuppula, H., Scott, B. L., Bailey, E. M., Schultz, M. M., Kerkvliet, J. G., Taraska, J. W., Hoppe, A. D., & Francis, K. R. (2021) · Cell Reports · doi:10.1016/j.celrep.2021.110008 · Cited by 56
Frolov, V. A., Escalada, A., Akimov, S. A., & Shnyrova, A. V. (2014) · Chemistry and Physics of Lipids · doi:10.1016/j.chemphyslip.2014.07.006 · Cited by 56
Biogenesis of endosome-derived transport carriers
Chi, R. J., Harrison, M. S., & Burd, C. G. (2015) · Cellular and Molecular Life Sciences · doi:10.1007/s00018-015-1935-x · Cited by 50
Annexin A2 Regulates β1 Integrin Internalization and Intestinal Epithelial Cell Migration
Rankin, C. R., Hilgarth, R. S., Leoni, G., Kwon, M., Den Beste, K. A., Parkos, C. A., & Nusrat, A. (2013) · Journal of Biological Chemistry · doi:10.1074/jbc.m112.440909 · Cited by 55
Mechanisms of Budding of Nanoscale Particles through Lipid Bilayers
Ruiz-Herrero, T., Velasco, E., & Hagan, M. F. (2012) · The Journal of Physical Chemistry B · doi:10.1021/jp301601g · Cited by 54
A Dynamin-Actin Interaction Is Required for Vesicle Scission during Endocytosis in Yeast
Palmer, S. E., Rooij, I. I. S., Marklew, C. J., Allwood, E. G., Mishra, R., Johnson, S., Goldberg, M. W., & Ayscough, K. R. (2015) · Current Biology · doi:10.1016/j.cub.2015.01.061 · Cited by 49
Minimal Mesoscale Model for Protein-Mediated Vesiculation in Clathrin-Dependent Endocytosis
Agrawal, N. J., Nukpezah, J., & Radhakrishnan, R. (2010) · PLoS Computational Biology · doi:10.1371/journal.pcbi.1000926 · Cited by 52
Increasing Diversity of Biological Membrane Fission Mechanisms
Renard, H., Johannes, L., & Morsomme, P. (2018) · Trends in Cell Biology · doi:10.1016/j.tcb.2017.12.001 · Cited by 53
Membrane compression by synaptic vesicle exocytosis triggers ultrafast endocytosis
Ogunmowo, T. H., Jing, H., Raychaudhuri, S., Kusick, G. F., Imoto, Y., Li, S., Itoh, K., Ma, Y., Jafri, H., Dalva, M. B., et al. (2023) · Nature Communications · doi:10.1038/s41467-023-38595-2 · Cited by 51
“Thereafter, endocytic proteins such as Synaptojanin 1, Endophilin A, Syndapin 1, and Dynamin 1 can further curve the membrane and generate vesicles 47 – 50 .”
Self-citationMembrane bending: the power of protein imbalance
Derganc, J., Antonny, B., & Čopič, A. (2013) · Trends in Biochemical Sciences · doi:10.1016/j.tibs.2013.08.006 · Cited by 50
Regulating dynamin dynamics during endocytosis
Sundborger, A., & Hinshaw, J. E. (2014) · F1000Prime Reports · doi:10.12703/p6-85 · Cited by 53
Irreversible thermodynamics of curved lipid membranes
Sahu, A., Sauer, R. A., & Mandadapu, K. K. (2017) · Physical review. E · doi:10.1103/physreve.96.042409 · Cited by 51
Converging views of endocytosis in yeast and mammals
Conibear, E. (2010) · Current Opinion in Cell Biology · doi:10.1016/j.ceb.2010.05.009 · Cited by 49
Reconstituting ring-rafts in bud-mimicking topography of model membranes
Ryu, Y., Lee, I., Suh, J.-H., Park, S. C., Oh, S., Jordan, L. R., Wittenberg, N. J., Oh, S., Jeon, N. L., Lee, B., et al. (2014) · Nature Communications · doi:10.1038/ncomms5507 · Cited by 48
Kinetics of cellular uptake of viruses and nanoparticles via clathrin-mediated endocytosis
Banerjee, A., Berezhkovskii, A. M., & Nossal, R. (2016) · Physical Biology · doi:10.1088/1478-3975/13/1/016005 · Cited by 46
Membrane curvature as a signal to ensure robustness of diverse cellular processes
Cail, R. C., & Drubin, D. G. (2022) · Trends in Cell Biology · doi:10.1016/j.tcb.2022.09.004 · Cited by 45
Self-citationBiophysics of membrane curvature remodeling at molecular and mesoscopic lengthscales
Natesan, R., Bradley, R. P., Tourdot, R. W., & Radhakrishnan, R. (2018) · Journal of Physics Condensed Matter · doi:10.1088/1361-648x/aac702 · Cited by 41
Induced nanoscale membrane curvature bypasses the essential endocytic function of clathrin
Cail, R. C., Shirazinejad, C. R., & Drubin, D. G. (2022) · The Journal of Cell Biology · doi:10.1083/jcb.202109013 · Cited by 43
Self-citation
Metadata
- Authors
- Liu, J., Sun, Y., Drubin, D. G., & Oster, G. F.
- Affiliations
- University of California, Berkeley (US)
- Corresponding author
- Drubin, David G.
- Oster, George F.
- Venue
- PLoS Biology
- Publisher
- Public Library of Science (PLoS)
- Published
- 2009-09-29
- Volume
- 7
- Issue
- 9
- Pages
- e1000204
- ISSN
- 1544-9173 (ISSN-L)
- 1545-7885
- PMC
- PMC2742711
- OpenAlex
- W2019040974
- Cited by
- 222
- References
- 59
- Citations by year
- 2026: 1 · 2025: 7 · 2024: 8 · 2023: 6 · 2022: 9 · 2021: 11 · 2020: 6 · 2019: 9 · 2018: 15 · 2017: 15 · 2016: 10 · 2015: 16 · 2014: 21 · 2013: 17 · 2012: 24
- FWCI
- 10.53
- Type
- journal article
- Language
- en
- Open access
- gold
- doi.org
- Locations
- PLoS Biology (publishedVersion, cc-by)
- PubMed Central (publishedVersion, cc-by)
- PubMed (publishedVersion)
- DOAJ (DOAJ: Directory of Open Access Journals) (submittedVersion)
- Figshare (submittedVersion, cc-by)
- Funders
- National Science Foundation (0414039)
- National Institute of General Medical Sciences (1 R01 GM 50399, R01GM042759, R01GM050399, 1 R01 GM 42759)
- Topics
- Life Sciences › Biochemistry, Genetics and Molecular Biology › Cell Biology › Cellular transport and secretion
- Life Sciences › Biochemistry, Genetics and Molecular Biology › Molecular Biology › Lipid Membrane Structure and Behavior
- Life Sciences › Biochemistry, Genetics and Molecular Biology › Molecular Biology › Fungal and yeast genetics research
- Keywords
- endocytosis, mechanochemistry, vesicle scission, membrane curvature, protein recruitment, lipid modification, interfacial forces, mechanochemical model, phase diagram, vesicle formation
- MeSH terms
- Actins, Animals, Biomechanical Phenomena, Cell Membrane, Endocytosis, Saccharomycetales, Hydrolysis, Lipids, Mammals, Models, Biological, Phosphoric Monoester Hydrolases, Time Factors, Protein Structure, Tertiary, Phosphatidylinositol 4,5-Diphosphate, Transport Vesicles, Feedback, Physiological, Saccharomyces cerevisiae Proteins
About these checks
Registry, retraction, Cites and statistics results are computed, not judged, with one exception: a printed reference that no index lists is read once by a model before it counts as a citation error. Claims are extracted by a model and kept only when their quote appears verbatim in the text; each cited source is then checked, with a model’s help, for whether it says what the claim relies on. Those verdicts can be wrong — read the claim’s quote and the cited source before relying on one.
Statistics and arithmetic are recomputed, not judged.
Confidence bands are shown only for fields calibrated on our annotated test set. None is calibrated yet, so no band is shown.
What counts as a claim ›How we measure confidence ›How we check this ›
Are you an author, or do you see a problem with this page? Request a review
