

The DOI matches its Crossref record; 11 of the 11 references it cites were found in a registry or an index.
RNA stores tau reversibly in complex coacervates
Published version of a preprint
Overview
The claims and statistics of this paper haven’t been checked yet.
Run the check — free, no account needed. It reads the open-access text and checks the sources it cites.
Integrity signals
Registry
Cites
Statistics
Figures
Verification
Claims the paper makes
The claims and statistics of this paper haven’t been checked yet.
Run the check — free, no account needed. It reads the open-access text and checks the sources it cites.
Claims other papers make about this one
Each is checked against this paper’s own text: does it say what the citing paper says it does?
In the citing paper
“The only published cross-linking and immunoprecipitation sequencing (CLIP-seq) experiment for identification of tau-associated RNAs demonstrated a strong enrichment for tRNAs 22 , but the physiological significance of this interaction remains unclear.”
From Tau is an m 6 A-associated RNA binding protein that causes RNA dysregulation in disease (2026) · cites this paper as [22]
In the citing paper
“Tau phase separation can also be induced by a coacervation mechanism, whereby oppositely charged between tau and RNA spontaneously organize into higher order biomolecular condensates.13,14”
From A Proline-Rich-Domain-Binding Single Domain Antibody Selectively Inhibits RNA-Induced Phase Separation of Tau (2026) · cites this paper as [14]
In the citing paper
“In the case of Tau, polyanionic RNA (or heparin; Lin et al, 2020) co‐condensate with the positively charged Tau microtubule‐assembly domain into liquid‐like droplets (Zhang et al, 2017; Lin et al, 2019).”
From Molecular crowding and RNA synergize to promote phase separation, microtubule interaction, and seeding of Tau condensates (2022) · cites this paper as Zhang et al, 2017
In the citing paper
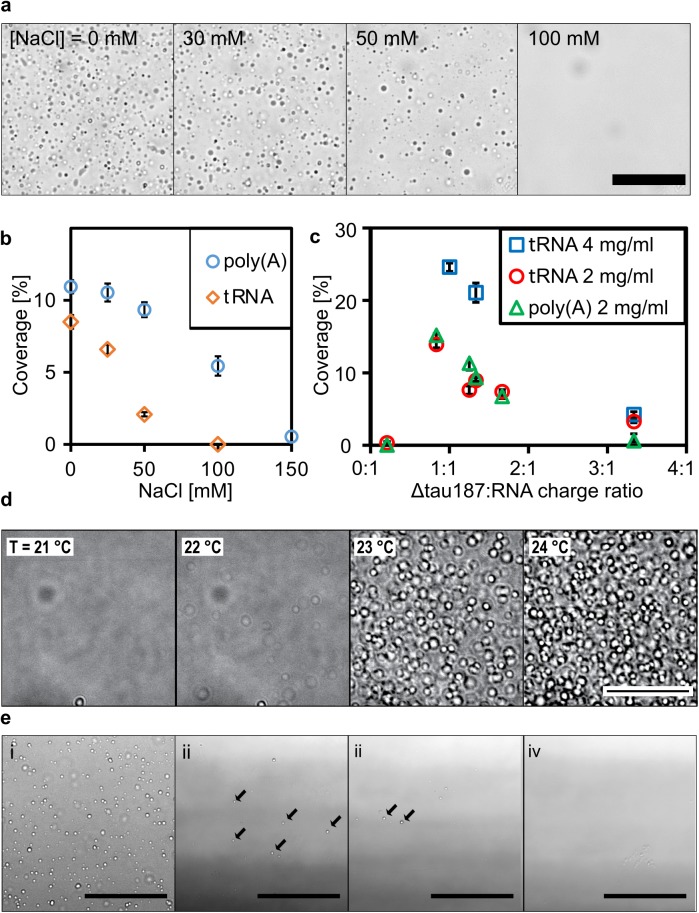
“The optimal phase separation condition was observed at a tau-to-RNA concentration ratio corresponding to a charge ratio of approximately one-to-one (Figure S9c).14”
From A Proline-Rich-Domain-Binding Single Domain Antibody Selectively Inhibits RNA-Induced Phase Separation of Tau (2026) · cites this paper as [14]
Self-check
Percentages, sums and reported differences re-computed from the paper’s own numbers.
The self-check needs the paper’s full text.
Citations
Cites
NIH Image to ImageJ: 25 years of image analysis
Schneider, C. A., Rasband, W. S., & Eliceiri, K. W. (2012) · Nature Methods · doi:10.1038/nmeth.2089 · Cited by 64,638
Cutadapt removes adapter sequences from high-throughput sequencing reads
Martin, M. (2011) · EMBnet.journal · doi:10.14806/ej.17.1.200 · Cited by 33,889
Takahashi, K., & Yamanaka, S. (2006) · Cell · doi:10.1016/j.cell.2006.07.024 · Cited by 26,673
Ultrafast and memory-efficient alignment of short DNA sequences to the human genome.
Langmead, B., Trapnell, C., Pop, M., & Salzberg, S. L. (2009) · Genome Biology · doi:10.1186/gb-2009-10-3-r25 · Cited by 21,849
Kato, M., Han, T. W., Xie, S., Shi, K., Du, X., Wu, L. C., Mirzaei, H., Goldsmith, E. J., Longgood, J., Pei, J., et al. (2012) · Cell · doi:10.1016/j.cell.2012.04.017 · Cited by 2,012
Transmission and spreading of tauopathy in transgenic mouse brain
Clavaguera, F., Bolmont, T., Crowther, R. A., Abramowski, D., Frank, S., Probst, A., Fraser, G., Stalder, A. K., Beibel, M., Staufenbiel, M., et al. (2009) · Nature Cell Biology · doi:10.1038/ncb1901 · Cited by 1,803
iCLIP reveals the function of hnRNP particles in splicing at individual nucleotide resolution
König, J., Zarnack, K., Rot, G., Curk, T., Kayikci, M., Zupan, B., Turner, D. J., Luscombe, N. M., & Ule, J. (2010) · Nature Structural & Molecular Biology · doi:10.1038/nsmb.1838 · Cited by 1,126
Goedert, M., Jakes, R., Spillantini, M. G., Hasegawa, M., Smith, M. J., & Crowther, R. A. (1996) · Nature · doi:10.1038/383550a0 · Cited by 1,036
FMRP targets distinct mRNA sequence elements to regulate protein expression
Ascano, M., Mukherjee, N., Bandaru, P., Miller, J. B., Nusbaum, J. D., Corcoran, D. L., Langlois, C., Munschauer, M., Dewell, S., Hafner, M., et al. (2012) · Nature · doi:10.1038/nature11737 · Cited by 701
RNA targets of wild-type and mutant FET family proteins
Hoell, J. I., Larsson, E., Runge, S., Nusbaum, J. D., Duggimpudi, S., Farazi, T. A., Hafner, M., Borkhardt, A., Sander, C., & Tuschl, T. (2011) · Nature Structural & Molecular Biology · doi:10.1038/nsmb.2163 · Cited by 350
Research works printed but not linked: 59
- T Kampers, 1996, RNA stimulates aggregation of microtubule-associated protein tau into Alzheimer-like paired helical filaments, FEBS Letters, 399, 344, 10.1016/S0014-5793(96)01386-5 · DOI · Paper page
- X Wang, 2006, The Proline-Rich Domain and the Microtubule Binding Domain of Protein Tau acting as RNA Binding Domains, Protein & Peptide Letters, 13, 679, 10.2174/092986606777790566 · DOI
- David W Sanders, 2014, Distinct Tau Prion Strains Propagate in Cells and Mice and Define Different Tauopathies, Neuron, 82, 1271, 10.1016/j.neuron.2014.04.047 · DOI · Paper page
- A Patel, 2015, A Liquid-to-Solid Phase Transition of the ALS Protein FUS Accelerated by Disease Mutation, Cell, 162, 1066, 10.1016/j.cell.2015.07.047 · DOI · Paper page
- Kathleen A Burke, 2015, Residue-by-Residue View of In Vitro FUS Granules that Bind the C-Terminal Domain of RNA Polymerase II, Molecular Cell, 60, 231, 10.1016/j.molcel.2015.09.006 · DOI · Paper page
- Y Shin, 2017, Spatiotemporal Control of Intracellular Phase Transitions Using Light-Activated optoDroplets, Cell, 168, 159, 10.1016/j.cell.2016.11.054 · DOI
- K-H Lee, 2016, C9orf72 Dipeptide Repeats Impair the Assembly, Dynamics, and Function of Membrane-Less Organelles, Cell, 167, 774, 10.1016/j.cell.2016.10.002 · DOI
- Y Lin, 2016, Toxic PR Poly-Dipeptides Encoded by the C9orf72 Repeat Expansion Target LC Domain Polymers, Cell, 167, 789, 10.1016/j.cell.2016.10.003 · DOI
- A Molliex, 2015, Phase Separation by Low Complexity Domains Promotes Stress Granule Assembly and Drives Pathological Fibrillization, Cell, 163, 123, 10.1016/j.cell.2015.09.015 · DOI · Paper page
- HJ Kim, 2013, Mutations in prion-like domains in hnRNPA2B1 and hnRNPA1 cause multisystem proteinopathy and ALS, Nature, 495, 467, 10.1038/nature11922 · DOI
- Y Lin, 2015, Formation and Maturation of Phase-Separated Liquid Droplets by RNA-Binding Proteins, Molecular Cell, 60, 208, 10.1016/j.molcel.2015.08.018 · DOI
- Chi W Pak, 2016, Sequence Determinants of Intracellular Phase Separation by Complex Coacervation of a Disordered Protein, Molecular Cell, 63, 72, 10.1016/j.molcel.2016.05.042 · DOI
- Y Jho, 2016, Molecular and structural basis of low interfacial energy of complex coacervates in water, Advances in Colloid and Interface Science
- CD Keating, 2012, Aqueous Phase Separation as a Possible Route to Compartmentalization of Biological Molecules, Accounts of Chemical Research, 45, 2114, 10.1021/ar200294y · DOI
- D Priftis, 2013, Complex coacervation of poly(ethylene-imine)/polypeptide aqueous solutions: Thermodynamic and rheological characterization, Journal of Colloid and Interface Science, 398, 39, 10.1016/j.jcis.2013.01.055 · DOI
- Timothy J Nott, Phase Transition of a Disordered Nuage Protein Generates Environmentally Responsive Membraneless Organelles, Molecular Cell, 57, 936, 10.1016/j.molcel.2015.01.013 · DOI · Paper page
- K-Y Huang, 2016, Bicontinuous Fluid Structure with Low Cohesive Energy: Molecular Basis for Exceptionally Low Interfacial Tension of Complex Coacervate Fluids, ACS Nano, 10, 5051, 10.1021/acsnano.5b07787 · DOI
- DS Hwang, 2010, Viscosity and interfacial properties in a mussel-inspired adhesive coacervate, Soft Matter, 6, 3232, 10.1039/c002632h · DOI
- JT Overbeek, 1957, Phase separation in polyelectrolyte solutions; theory of complex coacervation, J Cell Physiol Suppl, 49, 7, 10.1002/jcp.1030490404 · DOI
- J Shorter, 2016, Membraneless organelles: Phasing in and out, Nat Chem, 8, 528, 10.1038/nchem.2534 · DOI
- SF Banani, 2017, Biomolecular condensates: organizers of cellular biochemistry, Nat Rev Mol Cell Biol
- NA Eschmann, 2017, Signature of an aggregation-prone conformation of tau, Scientific Reports, 7, 44739, 10.1038/srep44739 · DOI
- L Dehmelt, 2005, The MAP2/Tau family of microtubule-associated proteins, Genome Biol, 6, 204, 10.1186/gb-2004-6-1-204 · DOI · Paper page
- JR Tollervey, 2011, Characterizing the RNA targets and position-dependent splicing regulation by TDP-43, Nat Neurosci, 14, 452, 10.1038/nn.2778 · DOI · Paper page
- I Huppertz, 2014, iCLIP: Protein–RNA interactions at nucleotide resolution, Methods, 65, 274, 10.1016/j.ymeth.2013.10.011 · DOI
- M Friedersdorf, 2014, Advancing the functional utility of PAR-CLIP by quantifying background binding to mRNAs and lncRNAs, Genome Biology, 15, R2, 10.1186/gb-2014-15-1-r2 · DOI
- M Hafner, 2010, Transcriptome-wide identification of RNA-binding protein and microRNA target sites by PAR-CLIP, Cell, 141, 129, 10.1016/j.cell.2010.03.009 · DOI · Paper page
- PJ Kenny, 2014, MOV10 and FMRP regulate AGO2 association with microRNA recognition elements, Cell reports, 9, 1729, 10.1016/j.celrep.2014.10.054 · DOI
- SP Ryder, 2008, Quantitative analysis of protein-RNA interactions by gel mobility shift, Methods in molecular biology (Clifton, NJ), 488, 99, 10.1007/978-1-60327-475-3_7 · DOI
- BE Zucconi, 2010, Alternatively Expressed Domains of AU-rich Element RNA-binding Protein 1 (AUF1) Regulate RNA-binding Affinity, RNA-induced Protein Oligomerization, and the Local Conformation of Bound RNA Ligands, Journal of Biological Chemistry, 285, 39127, 10.1074/jbc.M110.180182 · DOI
- HL Okunola, 2009, Cooperative-Binding and Splicing-Repressive Properties of hnRNP A1, Molecular and Cellular Biology, 29, 5620, 10.1128/MCB.01678-08 · DOI
- TC Gamblin, 2003, Modeling Tau Polymerization in Vitro: A Review and Synthesis†, Biochemistry, 42, 15009, 10.1021/bi035722s · DOI
- MR Reynolds, 2005, Site-Specific Nitration Differentially Influences τ Assembly in Vitro, Biochemistry, 44, 13997, 10.1021/bi051028w · DOI
- JH Ortony, 2013, Asymmetric Collapse in Biomimetic Complex Coacervates Revealed by Local Polymer and Water Dynamics, Biomacromolecules, 14, 1395, 10.1021/bm4000579 · DOI
- M Pérez, 1996, Polymerization of τ into Filaments in the Presence of Heparin: The Minimal Sequence Required for τ - τ Interaction, Journal of Neurochemistry, 67, 1183, 10.1046/j.1471-4159.1996.67031183.x · DOI
- M von Bergen, 2005, Tau aggregation is driven by a transition from random coil to beta sheet structure, Biochimica et Biophysica Acta (BBA)—Molecular Basis of Disease, 1739, 158, 10.1016/j.bbadis.2004.09.010 · DOI
- PRt Wolde, 1997, Enhancement of Protein Crystal Nucleation by Critical Density Fluctuations, Science, 277, 1975, 10.1126/science.277.5334.1975 · DOI
- L Aberkane, 2010, Thermodynamic Characterization of Acacia Gum−β-Lactoglobulin Complex Coacervation, Langmuir, 26, 12523, 10.1021/la100705d · DOI
- AY Xu, 2015, Structural mechanism of complex assemblies: characterisation of beta-lactoglobulin and pectin interactions, Soft Matter, 11, 6790, 10.1039/C5SM01378J · DOI
- D Carlström, 1957, THE CRYSTAL STRUCTURE OF α-CHITIN (POLY-N-ACETYL-D-GLUCOSAMINE), The Journal of Biophysical and Biochemical Cytology, 3, 669, 10.1083/jcb.3.5.669 · DOI
- RB Knowles, 1996, Translocation of RNA granules in living neurons, Journal of Neuroscience, 16, 7812, 10.1523/JNEUROSCI.16-24-07812.1996 · DOI
- MS Rook, 2000, CaMKIIalpha 3' untranslated region-directed mRNA translocation in living neurons: visualization by GFP linkage, J Neurosci, 20, 6385, 10.1523/JNEUROSCI.20-17-06385.2000 · DOI
- AM Krichevsky, 2001, Neuronal RNA granules: a link between RNA localization and stimulation-dependent translation, Neuron, 32, 10.1016/S0896-6273(01)00508-6 · DOI
- JR Wheeler, 2016, Distinct stages in stress granule assembly and disassembly, eLife, 5, e18413, 10.7554/eLife.18413 · DOI
- J Smith, 2016, Spatial patterning of P granules by RNA-induced phase separation of the intrinsically-disordered protein MEG-3, eLife, 5, e21337, 10.7554/eLife.21337 · DOI
- D Milovanovic, Synaptic Vesicle Clusters at Synapses: A Distinct Liquid Phase?, Neuron, 93, 995, 10.1016/j.neuron.2017.02.013 · DOI
- D Zwicker, 2017, Growth and division of active droplets provides a model for protocells, Nat Phys, 13, 408, 10.1038/nphys3984 · DOI
- N Kedersha, 2016, G3BP–Caprin1–USP10 complexes mediate stress granule condensation and associate with 40S subunits, The Journal of Cell Biology, 212, 845, 10.1083/jcb.201508028 · DOI
- R Parker, 2007, P bodies and the control of mRNA translation and degradation, Mol Cell, 25, 10.1016/j.molcel.2007.02.011 · DOI · Paper page
- G Coppola, 2012, Evidence for a role of the rare p.A152T variant in MAPT in increasing the risk for FTD-spectrum and Alzheimer's diseases, Human Molecular Genetics, 21, 3500, 10.1093/hmg/dds161 · DOI · Paper page
- H Fong, 2013, Genetic Correction of Tauopathy Phenotypes in Neurons Derived from Human Induced Pluripotent Stem Cells, Stem Cell Reports, 1, 226, 10.1016/j.stemcr.2013.08.001 · DOI · Paper page
- SK Mak, 2012, Small molecules greatly improve conversion of human-induced pluripotent stem cells to the neuronal lineage, Stem Cells Int, 2012
- K Yanamandra, 2013, Anti-tau antibodies that block tau aggregate seeding in vitro markedly decrease pathology and improve cognition in vivo, Neuron, 80, 402, 10.1016/j.neuron.2013.07.046 · DOI · Paper page
- B Langmead, 2012, Fast gapped-read alignment with Bowtie 2, Nat Meth, 9, 357, 10.1038/nmeth.1923 · DOI · Paper page
- L Wang, 2012, RSeQC: quality control of RNA-seq experiments, Bioinformatics, 28, 2184, 10.1093/bioinformatics/bts356 · DOI
- S Althammer, 2011, Pyicos: a versatile toolkit for the analysis of high-throughput sequencing data, Bioinformatics, 27, 3333, 10.1093/bioinformatics/btr570 · DOI
- G Jeschke, 2006, DeerAnalysis2006—a comprehensive software package for analyzing pulsed ELDOR data, Applied Magnetic Resonance, 30, 473, 10.1007/BF03166213 · DOI
- M DeTure, 2002, tau Assembly in Inducible Transfectants Expressing Wild-Type or FTDP-17 tau, The American Journal of Pathology, 161, 1711, 10.1016/S0002-9440(10)64448-3 · DOI
- DC Carrettiero, 2009, The Co-chaperone BAG2 Sweeps PHF Insoluble Tau from the Microtubule, Journal of Neuroscience, 29, 2151, 10.1523/JNEUROSCI.4660-08.2009 · DOI
Cited by
Tau protein liquid–liquid phase separation can initiate tau aggregation
Wegmann, S., Eftekharzadeh, B., Tepper, K., Zoltowska, K. M., Bennett, R. E., Dujardin, S., Laskowski, P. R., MacKenzie, D., Kamath, T., Commins, C., et al. (2018) · The EMBO Journal · doi:10.15252/embj.201798049 · Cited by 1,102
Tau PTM Profiles Identify Patient Heterogeneity and Stages of Alzheimer’s Disease
Wesseling, H., Mair, W., Kumar, M., Schlaffner, C. N., Tang, S., Beerepoot, P., Fatou, B., Guise, A. J., Cheng, L., Takeda, S., et al. (2020) · Cell · doi:10.1016/j.cell.2020.10.029 · Cited by 688
“, 2018) and RNA or its associated granules (Kampers et al., 1996; Zhang et al., 2017; Dinkel et al., 2015).”
BackgroundSelf-citationPhase separation and neurodegenerative diseases: a disturbance in the force
Zbinden, A., Pérez-Berlanga, M., De Rossi, P., & Polymenidou, M. (2020) · Developmental Cell · doi:10.1016/j.devcel.2020.09.014 · Cited by 500
Local Nucleation of Microtubule Bundles through Tubulin Concentration into a Condensed Tau Phase
Hernández-Vega, A., Braun, M., Scharrel, L., Jahnel, M., Wegmann, S., Hyman, B. T., Alberti, S., Diez, S., & Hyman, A. A. (2017) · Cell Reports · doi:10.1016/j.celrep.2017.08.042 · Cited by 395
“The formation of tau drops has been reported to occur in the absence of molecular crowders using RNA as nucleator under conditions of low salt and low pH; a tau-tRNA association in vivo was also observed in this study (Zhang et al., 2017).”
BackgroundResultInfluentialWhat is the evidence that tau pathology spreads through prion-like propagation?
Mudher, A., Colin, M., Dujardin, S., Medina, M., Dewachter, I., Alavi Naini, S. M., Mandelkow, E.-M., Mandelkow, E., Buée, L., Goedert, M., et al. (2017) · Acta Neuropathologica Communications · doi:10.1186/s40478-017-0488-7 · Cited by 384
Liquid-liquid phase separation induces pathogenic tau conformations in vitro
Kanaan, N. M., Hamel, C., Grabinski, T., & Combs, B. (2020) · Nature Communications · doi:10.1038/s41467-020-16580-3 · Cited by 397
Reducing the RNA binding protein TIA1 protects against tau-mediated neurodegeneration in vivo
Apicco, D. J., Ash, P. E. A., Maziuk, B., LeBlang, C., Medalla, M., Al Abdullatif, A., Ferragud, A., Botelho, E., Ballance, H. I., Dhawan, U., et al. (2018) · Nature Neuroscience · doi:10.1038/s41593-017-0022-z · Cited by 281
“The putative importance of tau oligomers in the interactions with TIA1 and RNA is supported by a recent study demonstrating that tau phase separates in the presence of RNA 41 .”
Microtubules gate tau condensation to spatially regulate microtubule functions
Tan, R., Lam, A. J., Tan, T., Han, J., Nowakowski, D. W., Vershinin, M., Simó, S., Ori-McKenney, K. M., & McKenney, R. J. (2019) · Nature Cell Biology · doi:10.1038/s41556-019-0375-5 · Cited by 231
Abyzov, A., Blackledge, M., & Zweckstetter, M. (2022) · Chemical Reviews · doi:10.1021/acs.chemrev.1c00774 · Cited by 215
Acetylation Disfavors Tau Phase Separation
Ferreon, J. C., Jain, A., Choi, K.-J., Tsoi, P. S., MacKenzie, K. R., Jung, S. Y., & Ferreon, A. C. (2018) · International Journal of Molecular Sciences · doi:10.3390/ijms19051360 · Cited by 183
RNA binding proteins co-localize with small tau inclusions in tauopathy
Maziuk, B. F., Apicco, D. J., Cruz, A. L., Jiang, L., Ash, P. E. A., da Rocha, E. L., Zhang, C., Yu, W. H., Leszyk, J., Abisambra, J. F., et al. (2018) · Acta Neuropathologica Communications · doi:10.1186/s40478-018-0574-5 · Cited by 151
Cofactors are essential constituents of stable and seeding-active tau fibrils
Fichou, Y., Lin, Y., Rauch, J. N., Vigers, M., Zeng, Z., Srivastava, M., Keller, T. J., Freed, J. H., Kosik, K. S., & Han, S. (2018) · Proceedings of the National Academy of Sciences · doi:10.1073/pnas.1810058115 · Cited by 128
Tau filaments in neurodegenerative diseases
Goedert, M. (2018) · FEBS Letters · doi:10.1002/1873-3468.13108 · Cited by 127
Hochmair, J., Exner, C., Franck, M., Dominguez‐Baquero, A., Diez, L., Brognaro, H., Kraushar, M. L., Mielke, T., Radbruch, H., Kaniyappan, S., et al. (2022) · The EMBO Journal · doi:10.15252/embj.2021108882 · Cited by 106
Microtubule lattice spacing governs cohesive envelope formation of tau family proteins
Siahaan, V., Tan, R., Humhalova, T., Libusova, L., Lacey, S. E., Tan, T., Dacy, M., Ori-McKenney, K. M., McKenney, R. J., Braun, M., et al. (2022) · Nature Chemical Biology · doi:10.1038/s41589-022-01096-2 · Cited by 94
Bishof, I., Dammer, E. B., Duong, D. M., Kundinger, S. R., Gearing, M., Lah, J. J., Levey, A. I., & Seyfried, N. T. (2018) · Journal of Biological Chemistry · doi:10.1074/jbc.ra118.001747 · Cited by 80
McMillan, P. J., Strovas, T. J., Baum, M., Mitchell, B. K., Eck, R. J., Hendricks, N., Wheeler, J. M., Latimer, C. S., Keene, C. D., & Kraemer, B. C. (2021) · Acta Neuropathologica Communications · doi:10.1186/s40478-021-01219-1 · Cited by 64
Ainani, H., Bouchmaa, N., Ben Mrid, R., & El Fatimy, R. (2023) · Neurobiology of Disease · doi:10.1016/j.nbd.2023.106011 · Cited by 54
Liquid-liquid phase separation in Alzheimer’s disease
Fu, Q., Zhang, B., Chen, X., & Chu, L. (2024) · Journal of Molecular Medicine · doi:10.1007/s00109-023-02407-3 · Cited by 33
Liquid − liquid phase separation of tau: Driving forces, regulation, and biological implications
Li, P., Chen, J., Wang, X., Su, Z., Gao, M., & Huang, Y. (2023) · Neurobiology of Disease · doi:10.1016/j.nbd.2023.106167 · Cited by 30
Tau liquid–liquid phase separation: At the crossroads of tau physiology and tauopathy
Islam, M., Shen, F., Regmi, D., Petersen, K., Karim, M. R. U., & Du, D. (2024) · Journal of Cellular Physiology · doi:10.1002/jcp.30853 · Cited by 28
Thiou, S., Martin, L., Manousaki, E., Nguyen, M., Mortelecque, J., Heidsieck, L., Cantrelle, F.-X., Blum, D., Buée-Scherrer, V., Buée, L., et al. (2026) · ACS Chemical Neuroscience · doi:10.1021/acschemneuro.6c00110 · Cited by 1
Tau is an m 6 A-associated RNA binding protein that causes RNA dysregulation in disease
Dixon, G., Keys, A., Rothamel, K., McKetney, J., Jiang, Y. X., Gordon, L. A., Page, M. L., Liu, C., Hou, K., Flanagan, K., et al. (2026) · doi:10.64898/2026.10.26.762095
Metadata
- Authors
- Zhang, X., Lin, Y., Eschmann, N. A., Zhou, H., Rauch, J. N., Hernandez, I., Guzman, E., Kosik, K. S., & Han, S.
- Venue
- PLOS Biology
- Publisher
- Public Library of Science (PLoS)
- Published
- 2017-07-06
- Volume
- 15
- Issue
- 7
- Pages
- e2002183
- ISSN
- 1545-7885
- PMC
- PMC5500003
- Cited by
- 302
- References
- 11
- Language
- en
About these checks
Registry, retraction, Cites and statistics results are computed, not judged, with one exception: a printed reference that no index lists is read once by a model before it counts as a citation error. Claims are extracted by a model and kept only when their quote appears verbatim in the text; each cited source is then checked, with a model’s help, for whether it says what the claim relies on. Those verdicts can be wrong — read the claim’s quote and the cited source before relying on one.
Statistics and arithmetic are recomputed, not judged.
Confidence bands are shown only for fields calibrated on our annotated test set. None is calibrated yet, so no band is shown.
What counts as a claim ›How we measure confidence ›How we check this ›
Are you an author, or do you see a problem with this page? Request a review
Data sources
Bibliographic data: Semantic Scholar, OpenAlex, Crossref.
Contains information from the Semantic Scholar Academic Graph Datasets, made available under the ODC Attribution License (ODC-BY 1.0).
Semantic Scholar’s data is described in: Kinney, R., et al. (2023). The Semantic Scholar Open Data Platform. arXiv:2301.10140.
