

The DOI matches its Crossref record; 81 of the 81 references it cites were found in a registry or an index.
Brain Anatomical Network and Intelligence
Open accessAbstract
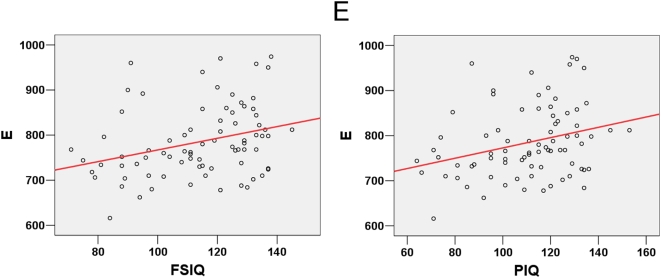
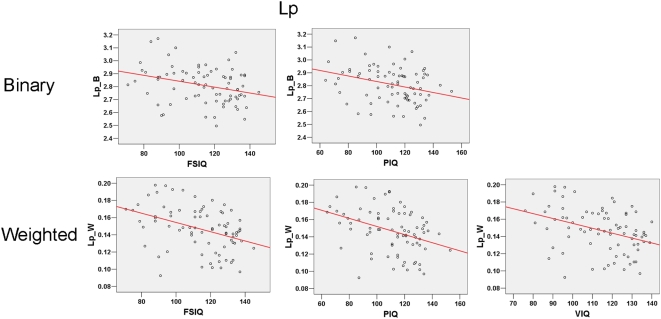
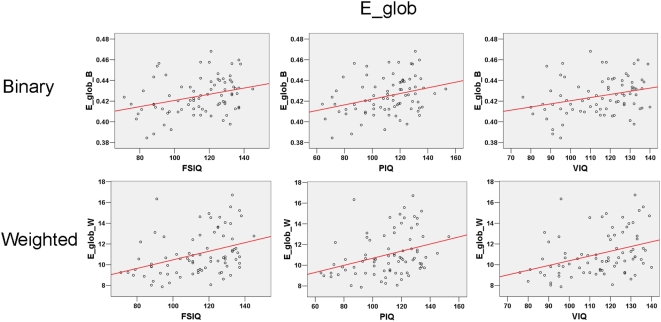
Intuitively, higher intelligence might be assumed to correspond to more efficient information transfer in the brain, but no direct evidence has been reported from the perspective of brain networks. In this study, we performed extensive analyses to test the hypothesis that individual differences in intelligence are associated with brain structural organization, and in particular that higher scores on intelligence tests are related to greater global efficiency of the brain anatomical network. We constructed binary and weighted brain anatomical networks in each of 79 healthy young adults utilizing diffusion tensor tractography and calculated topological properties of the networks using a graph theoretical method. Based on their IQ test scores, all subjects were divided into general and high intelligence groups and significantly higher global efficiencies were found in the networks of the latter group. Moreover, we showed significant correlations between IQ scores and network properties across all subjects while controlling for age and gender. Specifically, higher intelligence scores corresponded to a shorter characteristic path length and a higher global efficiency of the networks, indicating a more efficient parallel information transfer in the brain. The results were consistently observed not only in the binary but also in the weighted networks, which together provide convergent evidence for our hypothesis. Our findings suggest that the efficiency of brain structural organization may be an important biological basis for intelligence.
Overview
The claims and statistics of this paper haven’t been checked yet.
Run the check — free, no account needed. It reads the open-access text and checks the sources it cites.
Integrity signals
Registry
Cites
Statistics
Figures
Verification
Claims the paper makes
The claims and statistics of this paper haven’t been checked yet.
Run the check — free, no account needed. It reads the open-access text and checks the sources it cites.
Claims other papers make about this one
Each is checked against this paper’s own text: does it say what the citing paper says it does?
The cited source says what the claim attributes to it.
In the citing paper
“High intelligence corresponds to higher global efficiency in both weighted and binary graphs.”
From Graph theory analysis of complex brain networks: new concepts in brain mapping applied to neurosurgery (2016) · cites this paper as [63]
Self-check
Percentages, sums and reported differences re-computed from the paper’s own numbers.
The self-check needs the paper’s full text.
Citations
Cites
Collective dynamics of ‘small-world’ networks
Watts, D. J., & Strogatz, S. H. (1998) · Nature · doi:10.1038/30918 · Cited by 43,060
Tzourio-Mazoyer, N., Landeau, B., Papathanassiou, D., Crivello, F., Etard, O., Delcroix, N., Mazoyer, B., & Joliot, M. (2002) · NeuroImage · doi:10.1006/nimg.2001.0978 · Cited by 16,319
Complex networks: structure and dynamics
BOCCALETTI, S., LATORA, V, MORENO, Y., CHAVEZ, M., & HWANG, D. (2006) · Physics Reports · doi:10.1016/j.physrep.2005.10.009 · Cited by 11,010
Strogatz, S. H. (2001) · Nature · doi:10.1038/35065725 · Cited by 8,236
Network motifs: simple building blocks of complex networks.
Milo, R., Shen-Orr, S., Itzkovitz, S., Kashtan, N., Chklovskii, D., & Alon, U. (2002) · Science · doi:10.1126/science.298.5594.824 · Cited by 7,368
Efficient behavior of small-world networks
Latora, V., & Marchiori, M. (2001) · Physical Review Letters · doi:10.1103/physrevlett.87.198701 · Cited by 5,119
Mapping the structural core of human cerebral cortex
Hagmann, P., Cammoun, L., Gigandet, X., Meuli, R., Honey, C. J., Wedeen, V. J., & Sporns, O. (2008) · PLoS Biology · doi:10.1371/journal.pbio.0060159 · Cited by 4,173
The architecture of complex weighted networks.
Barrat, A., Barthelemy, M., Pastor-Satorras, R., & Vespignani, A. (2003) · Proceedings of the National Academy of Sciences of the United States of America · doi:10.1073/pnas.0400087101 · Cited by 4,084
Three-dimensional tracking of axonal projections in the brain by magnetic resonance imaging
Mori, S., Crain, B. J., Chacko, V. P., & van Zijl, P. C. M. (1999) · Annals of Neurology · doi:10.1002/1531-8249(199902)45:2 · Cited by 3,513
Probabilistic diffusion tractography with multiple fibre orientations: What can we gain?
Behrens, T. E. J., Berg, H. J., Jbabdi, S., Rushworth, M. F. S., & Woolrich, M. W. (2007) · NeuroImage · doi:10.1016/j.neuroimage.2006.09.018 · Cited by 3,471
Cited by
Sorted by citations
Items 101–200 of 599
Lo, C. Z., Su, T.-W., Huang, C., Hung, C., Chen, W.-L., Lan, T., Lin, C., & Bullmore, E. T. (2015) · Proceedings of the National Academy of Sciences · doi:10.1073/pnas.1502052112 · Cited by 125
Vaessen, M. J., Hofman, P. A. M., Tijssen, H. N., Aldenkamp, A. P., Jansen, J. F. A., & Backes, W. H. (2010) · NeuroImage · doi:10.1016/j.neuroimage.2010.03.011 · Cited by 125
Pan, J., Zhan, L., Hu, C., Yang, J., Wang, C., Gu, L., Zhong, S., Huang, Y., Wu, Q., Xie, X., et al. (2018) · Frontiers in Human Neuroscience · doi:10.3389/fnhum.2018.00070 · Cited by 130
The Problem of Thresholding in Small-World Network Analysis
Langer, N., Pedroni, A., & Jäncke, L. (2013) · PLoS ONE · doi:10.1371/journal.pone.0053199 · Cited by 121
Mapping Individual Brain Networks Using Statistical Similarity in Regional Morphology from MRI
Kong, X., Liu, Z., Huang, L., Wang, X., Yang, Z., Zhou, G., Zhen, Z., & Liu, J. (2015) · PLoS ONE · doi:10.1371/journal.pone.0141840 · Cited by 121
MEG Network Differences between Low- and High-Grade Glioma Related to Epilepsy and Cognition
van Dellen, E., Douw, L., Hillebrand, A., Ris-Hilgersom, I. H. M., Schoonheim, M. M., Baayen, J. C., Hamer, P. C. D. W., Velis, D. N., Klein, M., Heimans, J. J., et al. (2012) · PLoS ONE · doi:10.1371/journal.pone.0050122 · Cited by 121
Connectomic Intermediate Phenotypes for Psychiatric Disorders
Fornito, A., & Bullmore, E. T. (2012) · Frontiers in Psychiatry · doi:10.3389/fpsyt.2012.00032 · Cited by 121
Chen, Y., Wang, S.-J., Hilgetag, C. C., & Zhou, C. (2013) · PLoS Computational Biology · doi:10.1371/journal.pcbi.1002937 · Cited by 119
Fledgling pathoconnectomics of psychiatric disorders
Rubinov, M., & Bullmore, E. T. (2013) · Trends in Cognitive Sciences · doi:10.1016/j.tics.2013.10.007 · Cited by 118
Relationships between the resting-state network and the P3: Evidence from a scalp EEG study
Li, F., Liu, T., Wang, F., Li, H., Gong, D., Zhang, R., Jiang, Y., Tian, Y., Guo, D., Yao, D., et al. (2015) · Scientific Reports · doi:10.1038/srep15129 · Cited by 115
Fluid intelligence and brain functional organization in aging yoga and meditation practitioners
Gard, T., Taquet, M., Dixit, R., Hölzel, B. K., de Montjoye, Y.-A., Brach, N., Salat, D. H., Dickerson, B. C., Gray, J. R., & Lazar, S. W. (2014) · Frontiers in Aging Neuroscience · doi:10.3389/fnagi.2014.00076 · Cited by 112
Gießing, C., Thiel, C. M., Alexander‐Bloch, A. F., Patel, A. X., & Bullmore, E. T. (2013) · Journal of Neuroscience · doi:10.1523/jneurosci.4854-12.2013 · Cited by 114
Fronto-Parietal Network Reconfiguration Supports the Development of Reasoning Ability
Wendelken, C., Ferrer, E. E., Whitaker, K. J., & Bunge, S. A. (2015) · Cerebral Cortex · doi:10.1093/cercor/bhv050 · Cited by 115
Mapping putative hubs in human, chimpanzee and rhesus macaque connectomes via diffusion tractography
Li, L., Hu, X., Preuss, T. M., Glasser, M. F., Damen, F. W., Qiu, Y., & Rilling, J. (2013) · NeuroImage · doi:10.1016/j.neuroimage.2013.04.024 · Cited by 109
Chen, G., Chen, G., Xie, C., & Li, S.-J. (2011) · Brain Connectivity · doi:10.1089/brain.2011.0025 · Cited by 115
Kim, K., Kim, S.-W., Myung, W., Han, C. E., Fava, M., Mischoulon, D., Papakostas, G. I., Seo, S. W., Cho, H., Seong, J.-K., et al. (2017) · Scientific Reports · doi:10.1038/s41598-017-15926-0 · Cited by 107
Hilger, K., Ekman, M., Fiebach, C. J., & Basten, U. (2016) · Intelligence · doi:10.1016/j.intell.2016.11.001 · Cited by 113
Hemispheric lateralization of topological organization in structural brain networks
Caeyenberghs, K., & Leemans, A. (2014) · Human Brain Mapping · doi:10.1002/hbm.22524 · Cited by 108
Deprez, S., Billiet, T., Sunaert, S. G., & Leemans, A. (2013) · Brain Imaging and Behavior · doi:10.1007/s11682-012-9220-1 · Cited by 109
Altered whole-brain white matter networks in preclinical Alzheimer's disease
Fischer, F. U., Wolf, D., Scheurich, A., & Fellgiebel, A. (2015) · NeuroImage: Clinical · doi:10.1016/j.nicl.2015.06.007 · Cited by 105
Hosseini, S. M. H., Black, J. M., Soriano, T. J., Bugescu, N., Martinez, R., Raman, M. M., Kesler, S. R., & Hoeft, F. (2013) · NeuroImage · doi:10.1016/j.neuroimage.2013.01.013 · Cited by 109
Brain network analysis reveals affected connectome structure in bipolar I disorder
Collin, G., van den Heuvel, M. P., Abramovic, L., Vreeker, A., de Reus, M. A., van Haren, N. E. M., Boks, M. P., Ophoff, R. A., & Kahn, R. S. (2015) · Human Brain Mapping · doi:10.1002/hbm.23017 · Cited by 104
Xia, M., & Yong He, A. (2011) · Brain Connectivity · doi:10.1089/brain.2011.0062 · Cited by 107
Gupta, R., Laghari, K. U. R., & Falk, T. H. (2015) · Neurocomputing · doi:10.1016/j.neucom.2015.09.085 · Cited by 106
A predictive model of the cat cortical connectome based on cytoarchitecture and distance
Beul, S. F., Grant, S., & Hilgetag, C. C. (2014) · Brain Structure and Function · doi:10.1007/s00429-014-0849-y · Cited by 103
Heringa, S. M., on behalf of the Utrecht Vascular Cognitive Impairment (VCI) Study Group, Reijmer, Y. D., Leemans, A., Koek, H. L., Kappelle, L. J., & Biessels, G. J. (2013) · Journal of Alzheimer's Disease · doi:10.3233/jad-130542 · Cited by 100
Zhou, Z., Irizarry, J., & Guo, W. (2021) · Safety Science · doi:10.1016/j.ssci.2021.105261 · Cited by 100
The functional connectome of cognitive reserve
Marques, P., Moreira, P. S., Magalhães, R. J. D. S., Costa, P., Santos, N. C., Zihl, J., Soares, J. M., & Sousa, N. (2016) · Human Brain Mapping · doi:10.1002/hbm.23242 · Cited by 104
Sun, Y., Chen, Y. S., Collinson, S. L., Bezerianos, A., & Sim, K. (2015) · Cerebral Cortex · doi:10.1093/cercor/bhv255 · Cited by 100
The influence of construction methodology on structural brain network measures: A review
Qi, S., Meesters, S., Nicolay, K., Romeny, B. M. T. H., & Ossenblok, P. (2015) · Journal of Neuroscience Methods · doi:10.1016/j.jneumeth.2015.06.016 · Cited by 98
Principles of recovery from traumatic brain injury: Reorganization of functional networks
Castellanos, N. P., Leyva, I., Buldú, J. M., Bajo, R., Paúl, N., Cuesta, P., Ordóñez, V. E., Pascua, C. L., Boccaletti, S., Maestú, F., et al. (2011) · NeuroImage · doi:10.1016/j.neuroimage.2010.12.046 · Cited by 96
Li, L., Rilling, J. K., Preuss, T. M., Glasser, M. F., & Hu, X. P. (2011) · Human Brain Mapping · doi:10.1002/hbm.21332 · Cited by 102
Structural connectome disruption at baseline predicts 6-months post-stroke outcome
Kuceyeski, A. F., Navi, B. B., Kamel, H., Raj, A., Relkin, N. R., Toglia, J. P., Iadecola, C., & O’Dell, M. W. (2016) · Human Brain Mapping · doi:10.1002/hbm.23198 · Cited by 96
Functional brain networks contributing to the Parieto-Frontal Integration Theory of Intelligence
Vakhtin, A. A., Ryman, S. G., Flores, R. A., & Jung, R. E. (2014) · NeuroImage · doi:10.1016/j.neuroimage.2014.09.055 · Cited by 94
Stam, C. J. (2010) · Frontiers in Computational Neuroscience · doi:10.3389/fncom.2010.00133 · Cited by 90
Brain network alterations and vulnerability to simulated neurodegeneration in breast cancer
Kesler, S. R., Watson, C., & Blayney, D. W. (2015) · Neurobiology of Aging · doi:10.1016/j.neurobiolaging.2015.04.015 · Cited by 94
Regional homogeneity of the resting-state brain activity correlates with individual intelligence
Wang, L., Song, M., Jiang, T., Zhang, Y., & Yu, C. (2010) · Neuroscience Letters · doi:10.1016/j.neulet.2010.11.046 · Cited by 92
Self-citationDisrupted Functional Brain Networks in Autistic Toddlers
Boersma, M., Kemner, C., de Reus, M. A., Collin, G., Snijders, T. M., Hofman, D., Buitelaar, J. K., Stam, C. J., & van den Heuvel, M. P. (2012) · Brain Connectivity · doi:10.1089/brain.2012.0127 · Cited by 93
Brain anatomical networks in world class gymnasts: A DTI tractography study
Wang, B., Fan, Y., Lü, M., Li, S., Song, Z., Peng, X., Zhang, R., Lin, Q., Yong He, A., Wang, J., et al. (2012) · NeuroImage · doi:10.1016/j.neuroimage.2012.10.007 · Cited by 91
The correlation of metrics in complex networks with applications in functional brain networks
Li, C., Wang, H., de Haan, W., Stam, C. J., & Mieghem, P. V. (2011) · Journal of Statistical Mechanics Theory and Experiment · doi:10.1088/1742-5468/2011/11/p11018 · Cited by 90
A DTI-based template-free cortical connectome study of brain maturation
Tymofiyeva, O., Hess, C. P., Ziv, E., Lee, P. N., Glass, H. C., Ferriero, D. M., Barkovich, A. J., & Xu, D. (2013) · PLoS ONE · doi:10.1371/journal.pone.0063310 · Cited by 86
Persistent Homology in Sparse Regression and Its Application to Brain Morphometry
Chung, M. K., Hanson, J. L., Ye, J., Davidson, R. J., & Pollak, S. D. (2015) · IEEE Transactions on Medical Imaging · doi:10.1109/tmi.2015.2416271 · Cited by 87
Yuan, K., Qin, W., Liu, J., Guo, Q., Dong, M., Sun, J., Zhang, Y., Liu, P., Wang, W., Wang, Y., et al. (2010) · Neuroscience Letters · doi:10.1016/j.neulet.2010.04.032 · Cited by 81
Self-citationBayesian Inference and Testing of Group Differences in Brain Networks
Durante, D., & Dunson, D. B. (2016) · Bayesian Analysis · doi:10.1214/16-ba1030 · Cited by 93
Cao, R., Wang, X., Gao, Y., Li, T., Zhang, H., Hussain, W., Xie, Y., Wang, J., Wang, B., & Xiang, J. (2020) · Frontiers in Neurology · doi:10.3389/fneur.2020.00053 · Cited by 81
Zong, Y., Zuo, Q., Ng, M. K., Lei, B., & Wang, S. (2024) · IEEE Transactions on Pattern Analysis and Machine Intelligence · doi:10.1109/tpami.2024.3442811 · Cited by 89
Yeh, C., Smith, R. E., Liang, X., Calamante, F., & Connelly, A. (2016) · NeuroImage · doi:10.1016/j.neuroimage.2016.05.047 · Cited by 81
Analyzing the association between functional connectivity of the brain and intellectual performance
Pamplona, G. S. P., Neto, G. S. S., Rosset, S., Rogers, B. P., & Salmón, C. E. G. (2015) · Frontiers in Human Neuroscience · doi:10.3389/fnhum.2015.00061 · Cited by 84
Towards the “Baby Connectome”: Mapping the Structural Connectivity of the Newborn Brain
Tymofiyeva, O., Hess, C. P., Ziv, E., Tian, N., Bonifacio, S. L., McQuillen, P. S., Ferriero, D. M., Barkovich, A. J., & Xu, D. (2012) · PLoS ONE · doi:10.1371/journal.pone.0031029 · Cited by 80
Altered structural connectivity in ADHD: a network based analysis
Beare, R. J., Adamson, C. L., Bellgrove, M. A., Vilgis, V., Vance, A. L. A., Seal, M. L., & Silk, T. J. (2016) · Brain Imaging and Behavior · doi:10.1007/s11682-016-9559-9 · Cited by 82
Children's intellectual ability is associated with structural network integrity
Kim, D., Davis, E. P., Sandman, C. A., Sporns, O., O’Donnell, B. F., Buß, C., & Hetrick, W. P. (2015) · NeuroImage · doi:10.1016/j.neuroimage.2015.09.012 · Cited by 81
Cai, L., Dong, Q., & Niu, H. (2018) · Developmental Cognitive Neuroscience · doi:10.1016/j.dcn.2018.03.003 · Cited by 78
What graph theory actually tells us about resting state interictal MEG epileptic activity
Niso, G., Carrasco, S., Gudín, M., Maestú, F., del Pozo, F., & Pereda, E. (2015) · NeuroImage Clinical · doi:10.1016/j.nicl.2015.05.008 · Cited by 77
Heritability of the network architecture of intrinsic brain functional connectivity
Sinclair, B., Hansell, N. K., Blokland, G. A. M., Martin, N. G., Thompson, P. M., Breakspear, M. J., de Zubicaray, G. I., Wright, M. J., & McMahon, K. L. (2015) · NeuroImage · doi:10.1016/j.neuroimage.2015.07.048 · Cited by 78
Hart, M. G., Ypma, R. J. F., Romero-Garcia, R., Price, S. J., & Suckling, J. (2016) · Journal of Neurosurgery · doi:10.3171/2015.4.jns142683 · Cited by 74
Integrating across neuroimaging modalities boosts prediction accuracy of cognitive ability
Rasero, J., Sentis, A. I., Yeh, F.-C. F., & Verstynen, T. (2021) · PLoS Computational Biology · doi:10.1371/journal.pcbi.1008347 · Cited by 78
Batallé, D., Muñoz‐Moreno, E., Figueras, F., Bargalló, N., Eixarch, E., & Gratacós, E. (2013) · NeuroImage · doi:10.1016/j.neuroimage.2013.07.045 · Cited by 75
Martínez, K., Janssen, J., Pineda‐Pardo, J. A., Carmona, S., Román, F. J., Alemán‐Gómez, Y., García‐García, D., Escorial, S., Quiroga, M. Á., Santarnecchi, E., et al. (2017) · NeuroImage · doi:10.1016/j.neuroimage.2017.04.029 · Cited by 74
Reber, J., Hwang, K., Bowren, M. D., Bruss, J., Mukherjee, P., Tranel, D., & Boes, A. D. (2021) · Proceedings of the National Academy of Sciences · doi:10.1073/pnas.2018784118 · Cited by 77
The link between callosal thickness and intelligence in healthy children and adolescents
Eileen Luders, A., Thompson, P. M., Narr, K. L., Zamanyan, A., Chou, Y., Gutman, B. A., Dinov, I. D., & Toga, A. W. (2010) · NeuroImage · doi:10.1016/j.neuroimage.2010.09.083 · Cited by 73
Association of Structural Global Brain Network Properties with Intelligence in Normal Aging
Fischer, F. U., Wolf, D. G. F., Scheurich, A., & Fellgiebel, A. (2014) · PLoS ONE · doi:10.1371/journal.pone.0086258 · Cited by 72
Koenis, M. M. G., Brouwer, R. M., van den Heuvel, M. P., Mandl, R. C. W., van Soelen, I. L. C., Kahn, R. S., Boomsma, D. I., & Pol, H. E. H. (2015) · Human Brain Mapping · doi:10.1002/hbm.22988 · Cited by 78
Graph theoretical analysis of EEG functional connectivity during music perception
Wu, J., Zhang, J., Liu, C., Liu, D., Ding, X., & Zhou, C. (2012) · Brain Research · doi:10.1016/j.brainres.2012.09.014 · Cited by 71
Sex differences in the IQ-white matter microstructure relationship: A DTI study
Dunst, B., Benedek, M., Koschutnig, K., Jauk, E., & Neubauer, A. C. (2014) · Brain and Cognition · doi:10.1016/j.bandc.2014.08.006 · Cited by 73
Dipasquale, O., Cooper, E. A., Tibble, J. A., Voon, V., Baglio, F., Baselli, G., Cercignani, M., & Harrison, N. A. (2015) · Brain Behavior and Immunity · doi:10.1016/j.bbi.2015.12.011 · Cited by 71
Richmond, S., Johnson, K. A., Seal, M. L., Allen, N. B., & Whittle, S. (2016) · Neuroscience & Biobehavioral Reviews · doi:10.1016/j.neubiorev.2016.08.024 · Cited by 70
Heritability of structural brain network topology: A DTI study of 156 twins
Bohlken, M. M., Mandl, R. C. W., Brouwer, R. M., van den Heuvel, M. P., Hedman, A. M., Kahn, R. S., & Pol, H. E. H. (2014) · Human Brain Mapping · doi:10.1002/hbm.22550 · Cited by 69
Elmer, S., Hänggi, J., Meyer, M. E., & Jäncke, L. (2010) · Human Brain Mapping · doi:10.1002/hbm.21169 · Cited by 76
Genes, Evolution and Intelligence
Bouchard, T. J. (2014) · Behavior Genetics · doi:10.1007/s10519-014-9646-x · Cited by 73
Zhong, S., Yong He, A., Shu, H., & Gong, G. (2016) · Cerebral Cortex · doi:10.1093/cercor/bhw109 · Cited by 69
Koenis, M. M. G., Brouwer, R. M., Swagerman, S. C., van Soelen, I. L. C., Boomsma, D. I., & Pol, H. E. H. (2017) · Human Brain Mapping · doi:10.1002/hbm.23885 · Cited by 72
Childhood poverty and the organization of structural brain connectome
Kim, D., Davis, E. P., Sandman, C. A., Glynn, L. M., Sporns, O., O’Donnell, B. F., & Hetrick, W. P. (2018) · NeuroImage · doi:10.1016/j.neuroimage.2018.09.041 · Cited by 72
Individualized functional networks reconfigure with cognitive state
Salehi, M., Karbasi, A., Barron, D. S., Scheinost, D., & Constable, R. T. (2019) · NeuroImage · doi:10.1016/j.neuroimage.2019.116233 · Cited by 68
Kruschwitz, J., Waller, L., Daedelow, L. S., Walter, H., & Veer, I. M. (2018) · NeuroImage · doi:10.1016/j.neuroimage.2018.01.018 · Cited by 71
Prediction of SSVEP-based BCI performance by the resting-state EEG network
Zhang, Y., Xu, P., Guo, D., & Yao, D. (2013) · Journal of Neural Engineering · doi:10.1088/1741-2560/10/6/066017 · Cited by 67
Bäuml, J., Daamen, M., Meng, C., Neitzel, J., Scheef, L., Jaekel, J., Busch, B., Baumann, N., Bartmann, P., Dieter Wolke, C., et al. (2014) · Cerebral Cortex · doi:10.1093/cercor/bhu133 · Cited by 74
DiffusionKit: A light one-stop solution for diffusion MRI data analysis
Xie, S., Chen, L., Zuo, N., & Jiang, T. (2016) · Journal of Neuroscience Methods · doi:10.1016/j.jneumeth.2016.08.011 · Cited by 66
Self-citationImaging structural covariance in the development of intelligence
Khundrakpam, B. S., Lewis, J. D., Reid, A., Karama, S., Zhao, L., Chouinard-Decorte, F., & Evans, A. C. (2016) · NeuroImage · doi:10.1016/j.neuroimage.2016.08.041 · Cited by 69
Tijms, B. M., Yeung, H. M., Sikkes, S. A. M., Möller, C., Smits, L. L., Stam, C. J., Scheltens, P., van der Flier, W. M., & Barkhof, F. (2014) · Brain Connectivity · doi:10.1089/brain.2013.0209 · Cited by 67
Intrinsic Functional Connectivity of the Brain in Adults with a Single Cerebral Hemisphere
Kliemann, D., Adolphs, R., Tyszka, J. M., Fischl, B. R., Yeo, B. T. T., Nair, R., Dubois, J., & Paul, L. K. (2019) · Cell Reports · doi:10.1016/j.celrep.2019.10.067 · Cited by 66
Modular‐level alterations of structure–function coupling in schizophrenia connectome
Sun, Y., Dai, Z., Li, J., Collinson, S. L., & Sim, K. (2016) · Human Brain Mapping · doi:10.1002/hbm.23501 · Cited by 65
Self-citationSex differences in the relationship between white matter connectivity and creativity
Ryman, S. G., van den Heuvel, M. P., Yeo, R. A., Caprihan, A., Carrasco, J., Vakhtin, A. A., Flores, R. A., Wertz, C. J., & Jung, R. E. (2014) · NeuroImage · doi:10.1016/j.neuroimage.2014.07.027 · Cited by 63
Abnormal Brain Network Organization in Body Dysmorphic Disorder
Arienzo, D., Leow, A., Brown, J. A., Zhan, L., GadElkarim, J., Hovav, S., & Feusner, J. D. (2013) · Neuropsychopharmacology · doi:10.1038/npp.2013.18 · Cited by 65
Ferguson, M. A., Anderson, J. S., & Spreng, R. N. (2017) · Network Neuroscience · doi:10.1162/netn_a_00010 · Cited by 67
Exact topological inference of the resting-state brain networks in twins
Chung, M. K., Lee, H., DiChristofano, A., Ombao, H., & Solo, V. (2019) · Network Neuroscience · doi:10.1162/netn_a_00091 · Cited by 64
Neural network alterations underlie cognitive deficits in brain tumor patients
Derks, J., Reijneveld, J. C., & Douw, L. (2014) · Current Opinion in Oncology · doi:10.1097/cco.0000000000000126 · Cited by 62
A Network Flow-based Analysis of Cognitive Reserve in Normal Ageing and Alzheimer’s Disease
Yoo, S. W., Han, C. E., Shin, J. S., Seo, S. W., Na, D. L., Kaiser, M., Jeong, Y., & Seong, J. (2015) · Scientific Reports · doi:10.1038/srep10057 · Cited by 65
Mapping the structural and functional network architecture of the medial temporal lobe using 7T MRI
Shah, P., Bassett, D. S., Wisse, L. E. M., Detre, J. A., Stein, J. M., Yushkevich, P. A., Shinohara, R. T., Pluta, J. B., Valenciano, E., Daffner, M., et al. (2017) · Human Brain Mapping · doi:10.1002/hbm.23887 · Cited by 64
Timescales of spontaneous fMRI fluctuations relate to structural connectivity in the brain
Fallon, J., Ward, P. G. D., Parkes, L., Oldham, S., Arnatkevičiūtė, A., Fornito, A., & Fulcher, B. (2020) · Network Neuroscience · doi:10.1162/netn_a_00151 · Cited by 66
Alavash, M., Doebler, P., Holling, H., Thiel, C. M., & Gießing, C. (2014) · NeuroImage · doi:10.1016/j.neuroimage.2014.12.046 · Cited by 68
Emerging Frontiers of Neuroengineering: A Network Science of Brain Connectivity
Bassett, D. S., Khambhati, A. N., & Grafton, S. T. (2017) · Annual Review of Biomedical Engineering · doi:10.1146/annurev-bioeng-071516-044511 · Cited by 61
A network engineering perspective on probing and perturbing cognition with neurofeedback
Bassett, D. S., & Khambhati, A. N. (2017) · Annals of the New York Academy of Sciences · doi:10.1111/nyas.13338 · Cited by 64
Graph-based network analysis in schizophrenia
Micheloyannis, S. (2012) · World Journal of Psychiatry · doi:10.5498/wjp.v2.i1.1 · Cited by 59
Prediction of Alzheimer's disease using individual structural connectivity networks
Shao, J., Myers, N. E., Yang, Q., Feng, J., Plant, C., Böhm, C., Förstl, H., Kurz, A., Zimmer, C., Meng, C., et al. (2012) · Neurobiology of Aging · doi:10.1016/j.neurobiolaging.2012.01.017 · Cited by 62
Ieong, H. F.-H., & Yuan, Z. (2017) · Frontiers in Human Neuroscience · doi:10.3389/fnhum.2017.00169 · Cited by 61
Bi, K., Hua, L., Wei, M., Qin, J., Lü, Q., & Yao, Z. (2015) · Journal of Affective Disorders · doi:10.1016/j.jad.2015.11.041 · Cited by 58
Zhao, K., Zheng, Q., Che, T., Dyrba, M., Li, Q., Ding, Y., Zheng, Y., Liu, Y., & Li, S. (2021) · Network Neuroscience · doi:10.1162/netn_a_00200 · Cited by 58
Self-citationReorganization of Brain Networks in Aging and Age-related Diseases.
Sun, J., Tong, S., & Yang, G. (2012) · Europe PMC (PubMed Central) · Cited by 58
Intelligence and the brain: A model-based approach
Kievit, R., van Rooijen, H., Wicherts, J. M., Waldorp, L., Kan, K., Scholte, H. S., & Borsboom, D. (2012) · Cognitive Neuroscience · doi:10.1080/17588928.2011.628383 · Cited by 58
Chiang, S., Levin, H. S., Wilde, E. A., & Haneef, Z. (2015) · Epilepsy Research · doi:10.1016/j.eplepsyres.2015.12.002 · Cited by 58
Metadata
- Authors
- Li, Y., Liu, Y., Li, J., Qin, W., Li, K., Yu, C., & Jiang, T.
- Affiliations
- Chinese Academy of Sciences (CN)
- Capital Medical University (CN)
- Corresponding author
- Yu, Chunshui
- Jiang, Tianzi
- Venue
- PLoS Computational Biology
- Publisher
- Public Library of Science (PLoS)
- Published
- 2009-05-29
- Volume
- 5
- Issue
- 5
- Pages
- e1000395
- ISSN
- 1553-734X (ISSN-L)
- 1553-7358
- PMC
- PMC2683575
- OpenAlex
- W2073017605
- Cited by
- 597
- References
- 81
- Citations by year
- 2026: 9 · 2025: 9 · 2024: 14 · 2023: 18 · 2022: 26 · 2021: 41 · 2020: 29 · 2019: 53 · 2018: 27 · 2017: 40 · 2016: 56 · 2015: 54 · 2014: 43 · 2013: 59 · 2012: 50
- FWCI
- 29.97
- Type
- journal article
- Language
- en
- Open access
- gold
- doi.org
- Locations
- PLoS Computational Biology (publishedVersion, cc-by)
- PubMed Central (publishedVersion, cc-by)
- PubMed (publishedVersion)
- DOAJ (DOAJ: Directory of Open Access Journals) (submittedVersion, cc-by-sa)
- Figshare (submittedVersion, cc-by)
- Funders
- National Natural Science Foundation of China (30730035, 60675033, 30670601)
- Chinese Academy of Sciences
- Program for New Century Excellent Talents in University (NCET-07-0568)
- Topics
- Health Sciences › Medicine › Radiology, Nuclear Medicine and Imaging › Advanced Neuroimaging Techniques and Applications
- Life Sciences › Neuroscience › Cognitive Neuroscience › Functional Brain Connectivity Studies
- Physical Sciences › Physics and Astronomy › Statistical and Nonlinear Physics › Complex Network Analysis Techniques
- Keywords
- intelligence, global efficiency, average path length, individual differences in intelligence, structural connectivity, diffusion tensor tractography, graph theory, information transmission efficiency, IQ
- MeSH terms
- Adolescent, Adult, Brain, Brain Mapping, Female, Humans, Intelligence, Intelligence Tests, Male, Models, Neurological, Nerve Net, Neural Pathways, Cluster Analysis, Diffusion Magnetic Resonance Imaging
About these checks
Registry, retraction, Cites and statistics results are computed, not judged, with one exception: a printed reference that no index lists is read once by a model before it counts as a citation error. Claims are extracted by a model and kept only when their quote appears verbatim in the text; each cited source is then checked, with a model’s help, for whether it says what the claim relies on. Those verdicts can be wrong — read the claim’s quote and the cited source before relying on one.
Statistics and arithmetic are recomputed, not judged.
Confidence bands are shown only for fields calibrated on our annotated test set. None is calibrated yet, so no band is shown.
What counts as a claim ›How we measure confidence ›How we check this ›
Are you an author, or do you see a problem with this page? Request a review
