

The DOI matches its Crossref record; 60 of the 60 references it cites were found in a registry or an index.
Is My Network Module Preserved and Reproducible?
Open accessAbstract
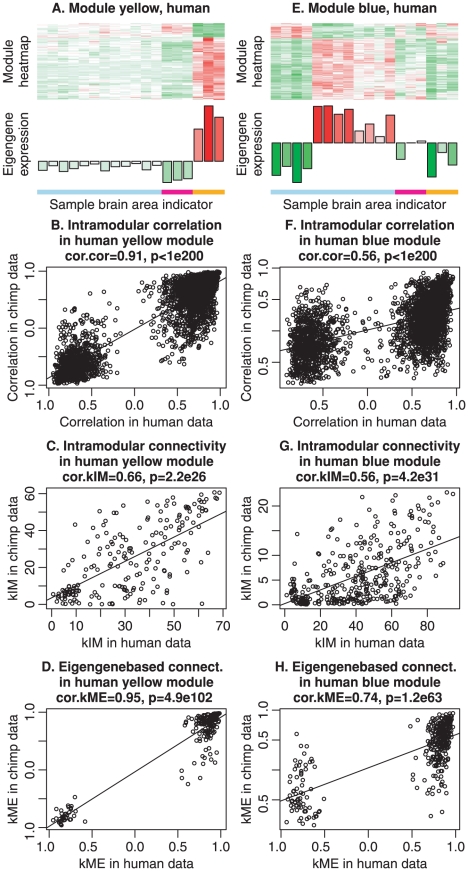
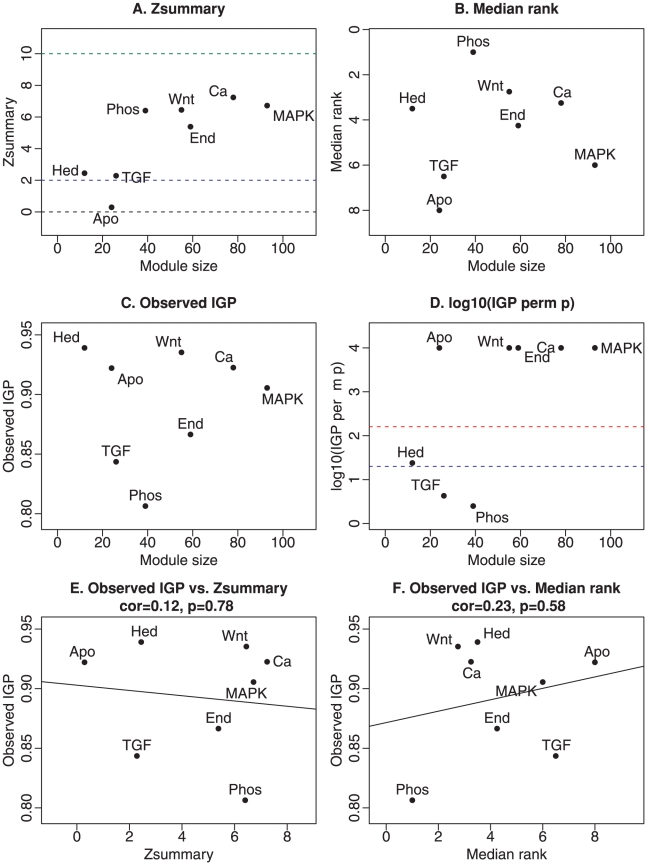
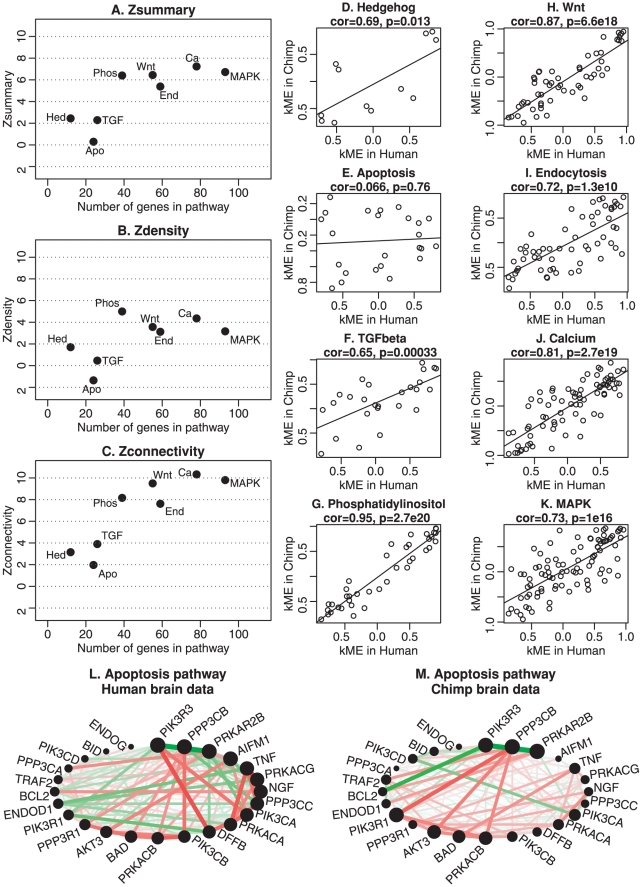
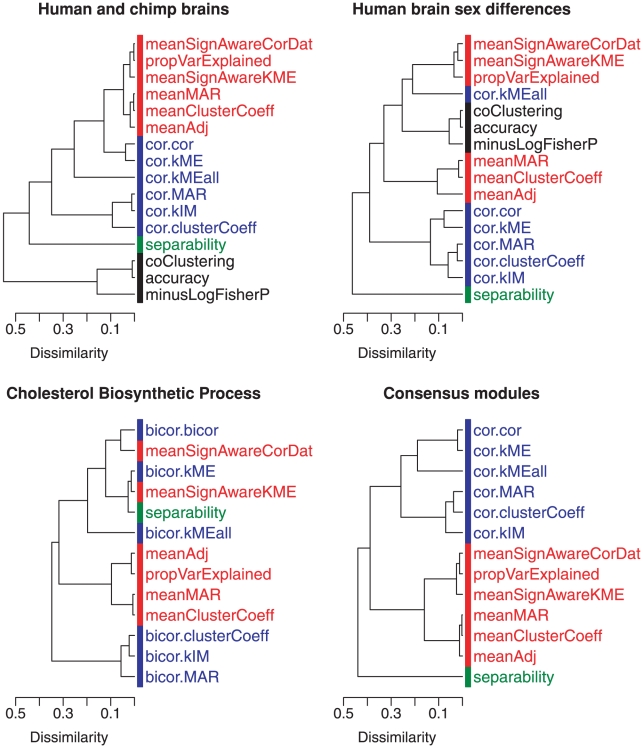
In many applications, one is interested in determining which of the properties of a network module change across conditions. For example, to validate the existence of a module, it is desirable to show that it is reproducible (or preserved) in an independent test network. Here we study several types of network preservation statistics that do not require a module assignment in the test network. We distinguish network preservation statistics by the type of the underlying network. Some preservation statistics are defined for a general network (defined by an adjacency matrix) while others are only defined for a correlation network (constructed on the basis of pairwise correlations between numeric variables). Our applications show that the correlation structure facilitates the definition of particularly powerful module preservation statistics. We illustrate that evaluating module preservation is in general different from evaluating cluster preservation. We find that it is advantageous to aggregate multiple preservation statistics into summary preservation statistics. We illustrate the use of these methods in six gene co-expression network applications including 1) preservation of cholesterol biosynthesis pathway in mouse tissues, 2) comparison of human and chimpanzee brain networks, 3) preservation of selected KEGG pathways between human and chimpanzee brain networks, 4) sex differences in human cortical networks, 5) sex differences in mouse liver networks. While we find no evidence for sex specific modules in human cortical networks, we find that several human cortical modules are less preserved in chimpanzees. In particular, apoptosis genes are differentially co-expressed between humans and chimpanzees. Our simulation studies and applications show that module preservation statistics are useful for studying differences between the modular structure of networks. Data, R software and accompanying tutorials can be downloaded from the following webpage: http://www.genetics.ucla.edu/labs/horvath/CoexpressionNetwork/ModulePreservation.
Overview
The claims and statistics of this paper haven’t been checked yet.
Run the check — free, no account needed. It reads the open-access text and checks the sources it cites.
Integrity signals
Registry
Cites
Statistics
Figures
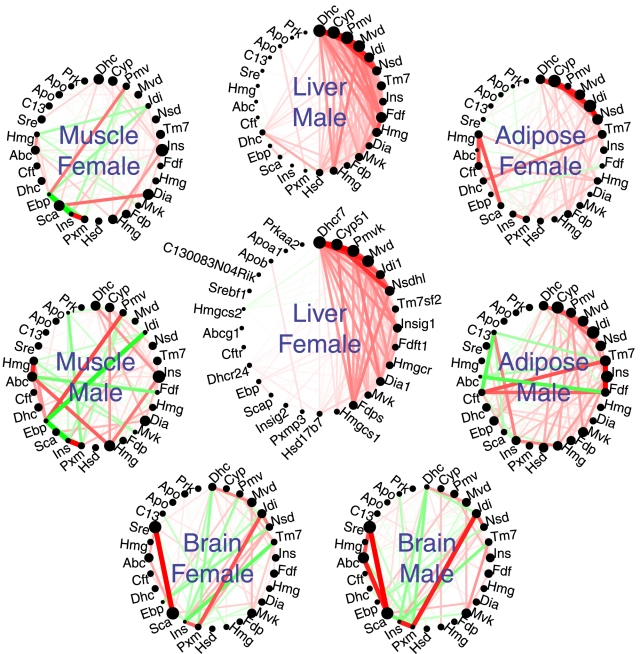
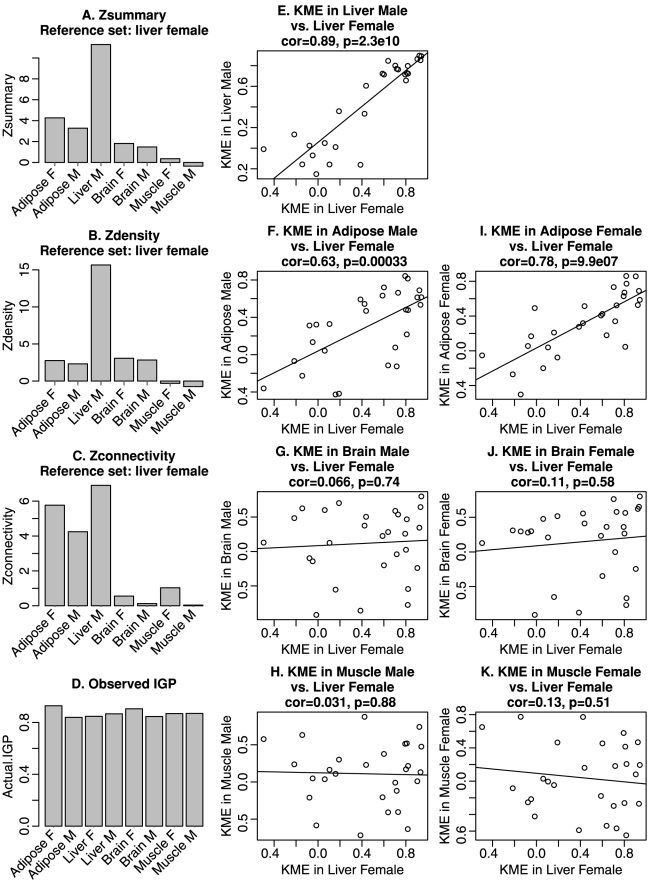
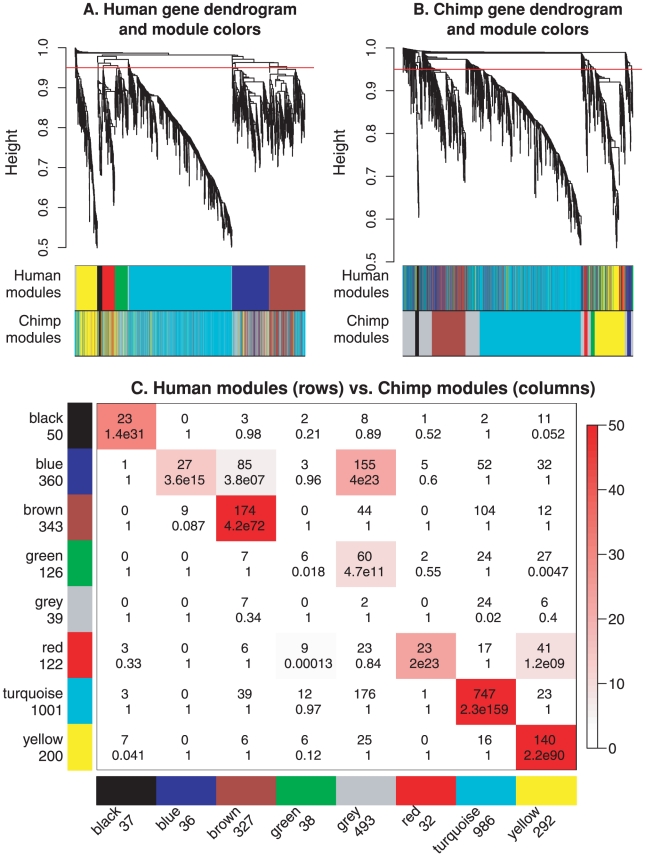
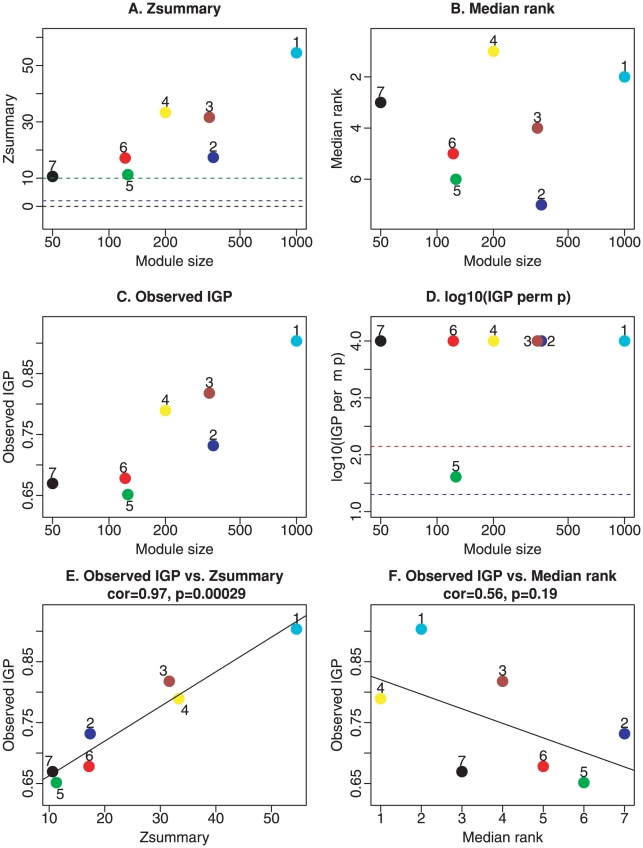
Verification
Claims the paper makes
The claims and statistics of this paper haven’t been checked yet.
Run the check — free, no account needed. It reads the open-access text and checks the sources it cites.
Claims other papers make about this one
Each is checked against this paper’s own text: does it say what the citing paper says it does?
The source backs part of the claim, not all of it — or backs it for a different population, condition or comparison.
In the citing paper
“At currently available sample sizes, networks are most reproducible at a module level35,38,39, then at the hub gene level41,223 and, last, at the level of precise gene connectivity rankings or precise module memberships of genes40,49.”
From Systems biology and gene networks in neurodevelopmental and neurodegenerative disorders (2015) · cites this paper as [35]
Experimental — accuracy not yet measuredThe cited source says what the claim attributes to it.
In the citing paper
“we performed module preservation analysis20 to test the reproducibility of these modules in an independent dataset12 and found that all of the ODC-specific modules were significantly preserved (Z summary preservation ≥5).”
From hdWGCNA identifies co-expression networks in high-dimensional transcriptomics data (2023) · cites this paper as [20]
In the citing paper
“The gene modules identified in Brain 1 were well conserved in Brain 2 as a whole (Fig. 3b), both at the level of regional gene expression patterns (third row) and as measured by a module preservation index (fourth row) using a summary Z-statistic as described previously20.”
From An anatomically comprehensive atlas of the adult human brain transcriptome (2012) · cites this paper as [20]
In the citing paper
“We note that the clustering assignment identified by the SpeakEasy algorithm overlapped significantly with those proposed by the frequently used WGCNA algorithm22 (Supplementary methods; Table S4)”
From A molecular network of the aging human brain provides insights into the pathology and cognitive decline of Alzheimer’s disease (2018) · cites this paper as [22]
In the citing paper
“Importantly, 13 of the 16 modules in the BLSA network (Fig. 4A) were preserved in the Emory network, with Zsummary scores above 2 (p<0.05) (Fig. 4A) (Langfelder et al., 2011).”
From A Multi-network Approach Identifies Protein-Specific Co-expression in Asymptomatic and Symptomatic Alzheimer’s Disease (2017) · cites this paper as Langfelder et al., 2011
In the citing paper
“Using the six brains now available, we identified a consensus network22 common to all brains (Fig. 3a, panel 1), using the 50% highest DS genes (ΔBR>0.5284, g=8674, Supplementary Methods).”
From Canonical genetic signatures of the adult human brain (2015) · cites this paper as [22]
In the citing paper
“Network analyses of AD brain tissue demonstrate the most reproducibility at the module level, followed by the hub protein level, and then finally at the level of precise protein connectivity rankings and module protein membership [61, 89–94].”
From Systems-based proteomics to resolve the biology of Alzheimer’s disease beyond amyloid and tau (2021) · cites this paper as [89]
Self-check
Percentages, sums and reported differences re-computed from the paper’s own numbers.
The self-check needs the paper’s full text.
Citations
Cites
Collective dynamics of ‘small-world’ networks
Watts, D. J., & Strogatz, S. H. (1998) · Nature · doi:10.1038/30918 · Cited by 43,060
KEGG: Kyoto Encyclopedia of Genes and Genomes
Kanehisa, M. (2000) · Nucleic Acids Research · doi:10.1093/nar/28.1.27 · Cited by 37,077
KEGG: Kyoto Encyclopedia of Genes and Genomes
Ogata, H., Goto, S., Sato, K., Fujibuchi, W., Bono, H., & Kanehisa, M. (1999) · Nucleic Acids Research · doi:10.1093/nar/27.1.29 · Cited by 31,232
WGCNA: an R package for weighted correlation network analysis
Langfelder, P., & Horvath, S. (2008) · BMC Bioinformatics · doi:10.1186/1471-2105-9-559 · Cited by 27,252
Self-citationSilhouettes: A graphical aid to the interpretation and validation of cluster analysis
Rousseeuw, P. J. (1987) · Journal of Computational and Applied Mathematics · doi:10.1016/0377-0427(87)90125-7 · Cited by 21,392
Finding groups in data: an introduction to cluster analysis
(1991) · Choice Reviews Online · doi:10.5860/choice.28-4558 · Cited by 10,537
Finding Groups in Data: An Introduction to Cluster Analysis
Kaufman, L., & Rousseeuw, P. J. (1990) · Wiley Series in Probability and Statistics · doi:10.1002/9780470316801 · Cited by 7,344 · cited 1×
“For example, the mean intramodular adjacency meanAdj1⁄2test (q) (Equation 8) is oppositely related to the within-module scatter used in assessing the quality of clusters based on a dissimilarity [55].”
BackgroundObjective Criteria for the Evaluation of Clustering Methods
Rand, W. M. (1971) · Journal of the American Statistical Association · doi:10.1080/01621459.1971.10482356 · Cited by 6,493
A General Framework for Weighted Gene Co-Expression Network Analysis
Zhang, B., & Horvath, S. (2005) · Statistical Applications in Genetics and Molecular Biology · doi:10.2202/1544-6115.1128 · Cited by 5,684
Self-citationA Gene-Coexpression Network for Global Discovery of Conserved Genetic Modules
Stuart, J. M., Segal, E., Koller, D., & Kim, S. K. (2003) · Science · doi:10.1126/science.1087447 · Cited by 2,274
Cited by
Sorted by citations
Items 1,001–1,002 of 1,002
Zhu, Y., & Feng, Y. (2026) · Current Issues in Molecular Biology · doi:10.3390/cimb48101005
Huai, W., Ng, L.-F., Lee, J. H., Wang, Q., Pabis, K., Yee, Z., Raventhiran, S., Guan, S.-P., Thein, S., Raj, S. D., et al. (2026) · Science Advances · doi:10.1126/sciadv.aee3657
Metadata
- Authors
- Langfelder, P., Luo, R., Oldham, M. C., & Horvath, S.
- Affiliations
- University of California, Los Angeles (US)
- Corresponding author
- Horvath, Steve
- Venue
- PLoS Computational Biology
- Publisher
- Public Library of Science (PLoS)
- Published
- 2011-01-20
- Volume
- 7
- Issue
- 1
- Pages
- e1001057
- ISSN
- 1553-734X (ISSN-L)
- 1553-7358
- PMC
- PMC3024255
- OpenAlex
- W1974033269
- Cited by
- 1,012
- References
- 60
- Citations by year
- 2026: 83 · 2025: 74 · 2024: 77 · 2023: 97 · 2022: 78 · 2021: 119 · 2020: 99 · 2019: 77 · 2018: 73 · 2017: 61 · 2016: 56 · 2015: 30 · 2014: 28 · 2013: 26 · 2012: 24
- FWCI
- 11.23
- Type
- journal article
- Language
- en
- Open access
- gold
- doi.org
- Locations
- PLoS Computational Biology (publishedVersion, cc-by)
- PubMed Central (publishedVersion, cc-by)
- PubMed (publishedVersion)
- RePEc: Research Papers in Economics (submittedVersion)
- DOAJ (DOAJ: Directory of Open Access Journals) (submittedVersion, cc-by-sa)
- eScholarship (California Digital Library) (submittedVersion)
- eScholarship (California Digital Library) (submittedVersion, cc-by)
- Figshare (submittedVersion, cc-by)
- Funders
- National Cancer Institute (P50CA092131, P30CA016042)
- National Institute of Allergy and Infectious Diseases (U19AI063603)
- National Institute of Diabetes and Digestive and Kidney Diseases (R01DK072206, DK-072206)
- Topics
- Life Sciences › Biochemistry, Genetics and Molecular Biology › Molecular Biology › Bioinformatics and Genomic Networks
- Life Sciences › Biochemistry, Genetics and Molecular Biology › Molecular Biology › Gene Regulatory Network Analysis
- Life Sciences › Biochemistry, Genetics and Molecular Biology › Molecular Biology › Gene expression and cancer classification
- Keywords
- reproducibility, gene co-expression network, correlation networks, cholesterol biosynthesis, apoptosis-related genes
- MeSH terms
- Animals, Brain, Female, Humans, Male, Reproducibility of Results, Gene Expression, Mice
About these checks
Registry, retraction, Cites and statistics results are computed, not judged, with one exception: a printed reference that no index lists is read once by a model before it counts as a citation error. Claims are extracted by a model and kept only when their quote appears verbatim in the text; each cited source is then checked, with a model’s help, for whether it says what the claim relies on. Those verdicts can be wrong — read the claim’s quote and the cited source before relying on one.
Statistics and arithmetic are recomputed, not judged.
Confidence bands are shown only for fields calibrated on our annotated test set. None is calibrated yet, so no band is shown.
What counts as a claim ›How we measure confidence ›How we check this ›
Are you an author, or do you see a problem with this page? Request a review
