

Measuring Integrated Information from the Decoding Perspective
Open accessThe DOI matches its Crossref record; 47 of the 48 references it cites were found in a registry or an index.
Abstract
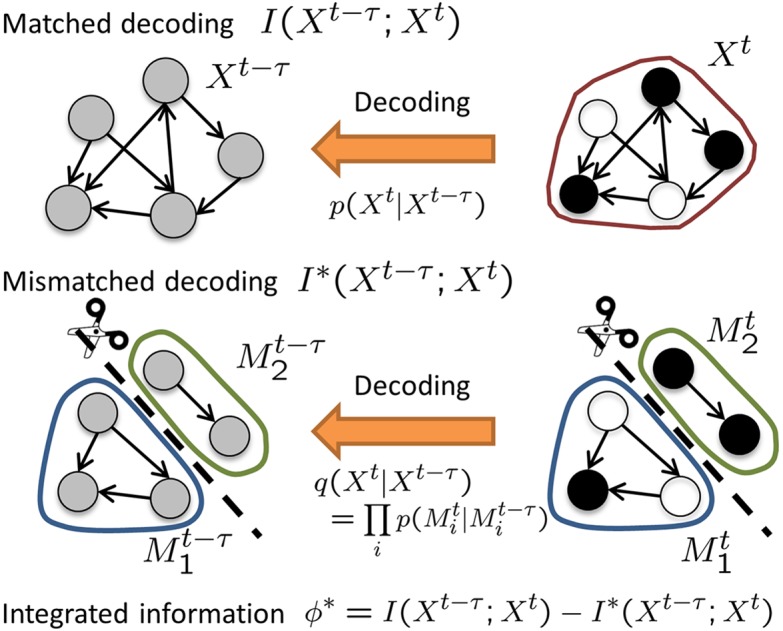
Accumulating evidence indicates that the capacity to integrate information in the brain is a prerequisite for consciousness. Integrated Information Theory (IIT) of consciousness provides a mathematical approach to quantifying the information integrated in a system, called integrated information, Φ. Integrated information is defined theoretically as the amount of information a system generates as a whole, above and beyond the amount of information its parts independently generate. IIT predicts that the amount of integrated information in the brain should reflect levels of consciousness. Empirical evaluation of this theory requires computing integrated information from neural data acquired from experiments, although difficulties with using the original measure Φ precludes such computations. Although some practical measures have been previously proposed, we found that these measures fail to satisfy the theoretical requirements as a measure of integrated information. Measures of integrated information should satisfy the lower and upper bounds as follows: The lower bound of integrated information should be 0 and is equal to 0 when the system does not generate information (no information) or when the system comprises independent parts (no integration). The upper bound of integrated information is the amount of information generated by the whole system. Here we derive the novel practical measure Φ* by introducing a concept of mismatched decoding developed from information theory. We show that Φ* is properly bounded from below and above, as required, as a measure of integrated information. We derive the analytical expression of Φ* under the Gaussian assumption, which makes it readily applicable to experimental data. Our novel measure Φ* can generally be used as a measure of integrated information in research on consciousness, and also as a tool for network analysis on diverse areas of biology.
Overview
The claims and statistics of this paper haven’t been checked yet.
Free: it reads the open-access text and checks the first 5 claims that cite a source we can check. Create a free account to check every claim.
Integrity signals
Registry
Cites
Statistics
Figures
Verification
Claims the paper makes
The claims and statistics of this paper haven’t been checked yet.
Free: it reads the open-access text and checks the first 5 claims that cite a source we can check. Create a free account to check every claim.
Claims other papers make about this one
Each is checked against this paper’s own text: does it say what the citing paper says it does?
The cited source says what the claim attributes to it.
In the citing paper
“IIT’s Φ cannot be easily computed from large-scale data, making it difficult to test the theory (for attempts, see Oizumi et al., 2016 and Tajima et al., 2015).”
From Conscious Processing and the Global Neuronal Workspace Hypothesis (2020) · cites this paper as Oizumi et al., 2016
Self-check
Percentages, sums and reported differences re-computed from the paper’s own numbers.
The self-check needs the paper’s full text.
Citations
Cites
Elements of Information Theory
Cover, T. M., & Thomas, J. A. (2001) · Wiley eBooks · doi:10.1002/0471200611 · Cited by 36,808
Information theory and statistical mechanics
Jaynes, E. T. (1957) · Physical Review · doi:10.1103/physrev.106.620 · Cited by 12,931
Theoretical Neuroscience: Computational and Mathematical Modeling of Neural Systems
Dayan, P., & Abbott, L. F. (2001) · Cited by 4,099
Elements of Information Theory
Jacobs, K. (1992) · Discrete Stochastics · doi:10.1007/978-3-0348-8645-1_7 · Cited by 2,918
Spikes: Exploring the Neural Code
Rieke, F. M., Warland, D., van Steveninck, R. R. D. R., & Bialek, W. (1996) · Medical Entomology and Zoology · Cited by 2,844
Methods of Information Geometry
Amari, S.-I., & Nagaoka, H. (2007) · Translations of Mathematical Monographs · doi:10.1090/mmono/191 · Cited by 2,204
Facing up to the problem of consciousness
Chalmers, D. J. (1996) · Toward a Science of Consciousness · doi:10.7551/mitpress/6860.003.0003 · Cited by 1,966
An information integration theory of consciousness
Tononi, G. (2004) · BMC Neuroscience · doi:10.1186/1471-2202-5-42 · Cited by 1,958 · cited 2×
“Although its neurobiological basis remains unclear, consciousness may be related to certain aspects of information processing [1, 2].”
BackgroundNeural correlations, population coding and computation
Averbeck, B. B., Latham, P. E., & Pouget, A. (2006) · Nature reviews. Neuroscience · doi:10.1038/nrn1888 · Cited by 1,743
Breakdown of cortical effective connectivity during sleep
Massimini, M., Ferrarelli, F., Huber, R., Esser, S. K., Singh, H., & Tononi, G. (2005) · Science · doi:10.1126/science.1117256 · Cited by 1,534
Consciousness as integrated information: a provisional manifesto
Tononi, G. (2008) · The Biological Bulletin · doi:10.2307/25470707 · Cited by 1,529
Facing Up to the Problem of Consciousness
Chalmers, D. J. (1998) · Consciousness and Emotion in Cognitive Science · doi:10.4324/9780203826430-11 · Cited by 1,327
A theoretically based index of consciousness independent of sensory processing and behavior
Casali, A. G., Gosseries, O., Rosanova, M., Boly, M., Sarasso, S., Casali, K. R., Casarotto, S., Bruno, M.-A., Laureys, S., Tononi, G., et al. (2013) · Science Translational Medicine · doi:10.1126/scitranslmed.3006294 · Cited by 1,246 · cited 1×
“In particular, Casali and colleagues [14] found that a complexity measure, motivated by IIT, successfully separates conscious awake states from various unconscious states due to deep sleep, anesthesia, and traumatic brain injuries.”
BackgroundAlkire, M. T., Hudetz, A. G., & Tononi, G. (2008) · Science · doi:10.1126/science.1149213 · Cited by 1,245
From the phenomenology to the mechanisms of consciousness: integrated information theory 3.0
Oizumi, M., Albantakis, L., & Tononi, G. (2014) · PLoS Computational Biology · doi:10.1371/journal.pcbi.1003588 · Cited by 1,128
Self-citationTransfer entropy—a model-free measure of effective connectivity for the neurosciences
Vicente, R., Wibral, M., Lindner, M., & Pipa, G. (2011) · Journal of Computational Neuroscience · doi:10.1007/s10827-010-0262-3 · Cited by 1,014
Extracting information from neuronal populations: information theory and decoding approaches
Quian Quiroga, R., & Panzeri, S. (2009) · Nature Reviews Neuroscience · doi:10.1038/nrn2578 · Cited by 811
Consciousness: here, there and everywhere?
Tononi, G., & Koch, C. (2015) · Philosophical Transactions of the Royal Society B: Biological Sciences · doi:10.1098/rstb.2014.0167 · Cited by 811
Granger Causality: Basic Theory and Application to Neuroscience
Ding, M., Chen, Y., & Bressler, S. L. (2006) · Handbook of Time Series Analysis · doi:10.1002/9783527609970.ch17 · Cited by 653
Breakdown in cortical effective connectivity during midazolam-induced loss of consciousness
Ferrarelli, F., Massimini, M., Sarasso, S., Casali, A., Riedner, B. A., Angelini, G., Tononi, G., & Pearce, R. A. (2010) · Proceedings of the National Academy of Sciences · doi:10.1073/pnas.0913008107 · Cited by 554
Triggering sleep slow waves by transcranial magnetic stimulation
Massimini, M., Ferrarelli, F., Esser, S. K., Riedner, B. A., Huber, R., Murphy, M., Peterson, M. J., & Tononi, G. (2007) · Proceedings of the National Academy of Sciences · doi:10.1073/pnas.0702495104 · Cited by 489
Unresponsiveness ≠ unconsciousness
Sanders, R. D., Tononi, G., Laureys, S., Sleigh, J. W., & Warner, D. S. (2012) · Anesthesiology · doi:10.1097/aln.0b013e318249d0a7 · Cited by 474
Recovery of cortical effective connectivity and recovery of consciousness in vegetative patients
Rosanova, M., Gosseries, O., Casarotto, S., Boly, M., Casali, A. G., Bruno, M.-A., Mariotti, M., Boveroux, P., Tononi, G., Laureys, S., et al. (2012) · Brain · doi:10.1093/brain/awr340 · Cited by 457
Integrated information in discrete dynamical systems: motivation and theoretical framework
Balduzzi, D., & Tononi, G. (2008) · PLoS Computational Biology · doi:10.1371/journal.pcbi.1000091 · Cited by 419 · cited 11×
“The theoretical requirements are naturally derived from the original philosophy of integrated information [3, 6], which states that integrated information is the information generated by a system as a whole above and beyond its parts.”
BackgroundMethodInfluentialOn information rates for mismatched decoders
Merhav, N., Kaplan, G., Lapidoth, A., & Shamai Shitz, S. (1994) · IEEE Transactions on Information Theory · doi:10.1109/18.340469 · Cited by 409
Integrated information theory of consciousness: an updated account.
(2012) · PubMed · doi:10.4449/aib.v149i5.1388 · Cited by 370
Handbook of Time Series Analysis: Recent Theoretical Developments and Applications
(2006) · Wiley eBooks · doi:10.1002/9783527609970 · Cited by 360
Facing up to the problem of consciousness.
Chalmers, D. J. (2010) · The Character of Consciousness · doi:10.1093/acprof:oso/9780195311105.003.0001 · Cited by 300 · cited 1×
“Although its neurobiological basis remains unclear, consciousness may be related to certain aspects of information processing [1, 2].”
BackgroundThe Information Integration Theory of Consciousness
Tononi, G. (2007) · The Blackwell Companion to Consciousness · doi:10.1002/9780470751466.ch23 · Cited by 283
Qualia: The Geometry of Integrated Information
Balduzzi, D., & Tononi, G. (2009) · PLoS Computational Biology · doi:10.1371/journal.pcbi.1000462 · Cited by 269
Synergy, Redundancy, and Independence in Population Codes, Revisited
Latham, P. E., & Nirenberg, S. (2005) · The Journal of Neuroscience · doi:10.1523/jneurosci.5319-04.2005 · Cited by 232
Practical Measures of Integrated Information for Time-Series Data
Barrett, A. B., & Seth, A. K. (2011) · PLoS Computational Biology · doi:10.1371/journal.pcbi.1001052 · Cited by 225
Unified framework for information integration based on information geometry
Oizumi, M., Tsuchiya, N., & Amari, S. (2016) · Proceedings of the National Academy of Sciences · doi:10.1073/pnas.1603583113 · Cited by 162
Self-citationLee, U., Mashour, G. A., Kim, S., Noh, G., & Choi, B. (2008) · Consciousness and Cognition · doi:10.1016/j.concog.2008.10.005 · Cited by 157
Causal density and integrated information as measures of conscious level
Seth, A. K., Barrett, A. B., & Barnett, L. (2011) · Philosophical Transactions of the Royal Society A Mathematical Physical and Engineering Sciences · doi:10.1098/rsta.2011.0079 · Cited by 153
Integrated Information Increases with Fitness in the Evolution of Animats
Edlund, J. A., Chaumont, N., Hintze, A., Koch, C., Tononi, G., & Adami, C. (2011) · PLoS Computational Biology · doi:10.1371/journal.pcbi.1002236 · Cited by 150
Information integration: its relevance to brain function and consciousness.
Tononi, G. (2010) · PubMed · Cited by 114
Information Geometry on Complexity and Stochastic Interaction
Ay, N. (2015) · Entropy · doi:10.3390/e17042432 · Cited by 100
Large-Scale Information Flow in Conscious and Unconscious States: an ECoG Study in Monkeys
Yanagawa, T., Chao, Z. C., Hasegawa, N., & Fujii, N. (2013) · PLoS ONE · doi:10.1371/journal.pone.0080845 · Cited by 96
Self-citationKihlstrom, J. F., & Cork, R. C. (2007) · Blackwell Publishing Ltd eBooks · doi:10.1002/9780470751466.ch50 · Cited by 86
Boly, M., Sasai, S., Gosseries, O., Oizumi, M., Casali, A. G., Massimini, M., & Tononi, G. (2015) · PLoS ONE · doi:10.1371/journal.pone.0125337 · Cited by 67
Self-citationMeasuring the fading consciousness in the human brain
Boly, M. (2011) · Current Opinion in Neurology · doi:10.1097/wco.0b013e328347da94 · Cited by 58
Chang, J.-Y., Pigorini, A., Massimini, M., Tononi, G., Nobili, L., & Veen, B. D. V. (2012) · Frontiers in Human Neuroscience · doi:10.3389/fnhum.2012.00317 · Cited by 45
Mismatched Decoding in the Brain
Oizumi, M., Ishii, T., Ishibashi, K., Hosoya, T., & Okada, M. (2010) · Journal of Neuroscience · doi:10.1523/jneurosci.4360-09.2010 · Cited by 40
Self-citationOn Information Rates for Mismatched Decoders
Merhav, N., & Kaplan, G. (2005) · IEEE International Symposium on Information Theory (ISIT) · doi:10.1109/isit.1993.748580 · Cited by 26
Information Loss Associated with Imperfect Observation and Mismatched Decoding
Oizumi, M., Okada, M., & Амари, Ш.-И. (2011) · Frontiers in Computational Neuroscience · doi:10.3389/fncom.2011.00009 · Cited by 13
Self-citationA comment on Tononi & Koch (2015) ‘Consciousness: here, there and everywhere?’
Barrett, A. B. (2016) · Philosophical Transactions of the Royal Society B Biological Sciences · doi:10.1098/rstb.2014.0198 · Cited by 9
Research works printed but not linked: 1
- Ay N. Information geometry on complexity and stochastic interaction. 2001. MPI MIS Preprint 95. Available: http://www.mis.mpg.de/publications/preprints/2001/prepr2001-95.html.
Cited by
Integrated information theory: from consciousness to its physical substrate
Tononi, G., Boly, M., Massimini, M., & Koch, C. (2016) · Nature Reviews Neuroscience · doi:10.1038/nrn.2016.44 · Cited by 1,727
Conscious Processing and the Global Neuronal Workspace Hypothesis
Mashour, G. A., Roelfsema, P., Changeux, J.-P., & Dehaene, S. (2020) · Neuron · doi:10.1016/j.neuron.2020.01.026 · Cited by 1,164
“making it difficult to test the theory (for attempts, see (Oizumi et al., 2016; Tajima et al., 2015).”
BackgroundNo-Report Paradigms: Extracting the True Neural Correlates of Consciousness
Tsuchiya, N., Wilke, M., Frässle, S., & Lamme, V. A. F. (2015) · Trends in Cognitive Sciences · doi:10.1016/j.tics.2015.10.002 · Cited by 551
Self-citationDeep neural networks in computational neuroscience
Kietzmann, T. C., McClure, P., & Kriegeskorte, N. (2019) · Oxford Research Encyclopedia of Neuroscience · doi:10.1093/acrefore/9780190264086.013.46 · Cited by 186
Unified framework for information integration based on information geometry
Oizumi, M., Tsuchiya, N., & Amari, S. (2016) · Proceedings of the National Academy of Sciences · doi:10.1073/pnas.1603583113 · Cited by 162
Self-citation
Metadata
- Authors
- Oizumi, M., Amari, S.-I., Yanagawa, T., Fujii, N., & Tsuchiya, N.
- Affiliations
- RIKEN Center for Brain Science (JP)
- Japan Science and Technology Agency (JP)
- Corresponding author
- Oizumi, Masafumi
- Tsuchiya, Naotsugu
- Venue
- PLOS Computational Biology
- Publisher
- Public Library of Science (PLoS)
- Published
- 2016-01-21
- Volume
- 12
- Issue
- 1
- Pages
- e1004654
- ISSN
- 1553-734X (ISSN-L)
- 1553-7358
- PMC
- PMC4721632
- OpenAlex
- W2242515881
- Cited by
- 184
- References
- 48
- Citations by year
- 2026: 4 · 2025: 8 · 2024: 11 · 2023: 15 · 2022: 22 · 2021: 18 · 2020: 27 · 2019: 29 · 2018: 21 · 2017: 12 · 2016: 15
- FWCI
- 36.18
- Type
- journal article
- Language
- en
- Open access
- gold
- doi.org
- Licence
- Locations
- PLoS Computational Biology (publishedVersion, cc-by)
- PubMed Central (publishedVersion, cc-by)
- PubMed (publishedVersion)
- arXiv (Cornell University) (submittedVersion)
- Monash University Research Portal (Monash University) (submittedVersion, cc-by)
- RePEc: Research Papers in Economics (submittedVersion)
- DOAJ (DOAJ: Directory of Open Access Journals) (submittedVersion)
- Figshare (submittedVersion, cc-by)
- Institutional Repositories DataBase (IRDB) (submittedVersion)
- arXiv (Cornell University)
- Funders
- Australian Research Council (DP130100194)
- Japan Society for the Promotion of Science (26870860)
- Japan Science and Technology Agency
- Precursory Research for Embryonic Science and Technology
- Topics
- Social Sciences › Arts and Humanities › Philosophy › Philosophy and Theoretical Science
- Life Sciences › Neuroscience › Cognitive Neuroscience › Neural dynamics and brain function
- Life Sciences › Neuroscience › Cognitive Neuroscience › Functional Brain Connectivity Studies
- Keywords
- integrated information, integrated information theory, consciousness, information decoding, mismatched decoding, neural network analysis, information integration
- MeSH terms
- Electrocorticography, Animals, Cerebral Cortex, Consciousness, Information Theory, Macaca, Models, Neurological, Normal Distribution, Computational Biology
About these checks
Registry, retraction, Cites and statistics results are computed, not judged, with one exception: a printed reference that no index lists is read once by a model before it counts as a citation error. Claims are extracted by a model and kept only when their quote appears verbatim in the text; each cited source is then checked, with a model’s help, for whether it says what the claim relies on. Those verdicts can be wrong — read the claim’s quote and the cited source before relying on one.
Statistics and arithmetic are recomputed, not judged.
Confidence bands are shown only for fields calibrated on our annotated test set. None is calibrated yet, so no band is shown.
What counts as a claim ›How we measure confidence ›How we check this ›
Are you an author, or do you see a problem with this page? Request a review
Data sources
Bibliographic data: Semantic Scholar, OpenAlex, Crossref.
Contains information from the Semantic Scholar Academic Graph Datasets, made available under the ODC Attribution License (ODC-BY 1.0).
Semantic Scholar’s data is described in: Kinney, R., et al. (2023). The Semantic Scholar Open Data Platform. arXiv:2301.10140.
