

The DOI matches its Crossref record; 74 of the 74 references it cites were found in a registry or an index.
Unraveling the Genetics of Human Obesity
Open accessAbstract
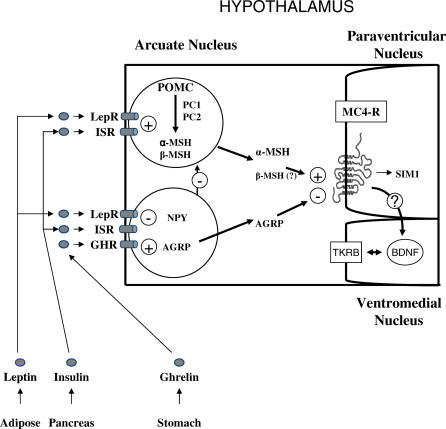
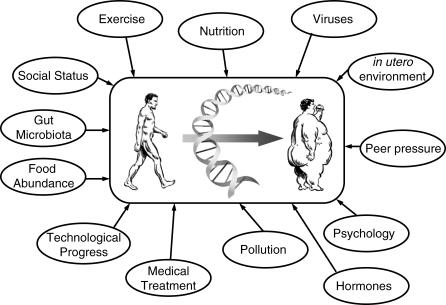
The use of modern molecular biology tools in deciphering the perturbed biochemistry and physiology underlying the obese state has proven invaluable. Identifying the hypothalamic leptin/melanocortin pathway as critical in many cases of monogenic obesity has permitted targeted, hypothesis-driven experiments to be performed, and has implicated new candidates as causative for previously uncharacterized clinical cases of obesity. Meanwhile, the effects of mutations in the melanocortin-4 receptor gene, for which the obese phenotype varies in the degree of severity among individuals, are now thought to be influenced by one's environmental surroundings. Molecular approaches have revealed that syndromes (Prader-Willi and Bardet-Biedl) previously assumed to be controlled by a single gene are, conversely, regulated by multiple elements. Finally, the application of comprehensive profiling technologies coupled with creative statistical analyses has revealed that interactions between genetic and environmental factors are responsible for the common obesity currently challenging many Westernized societies. As such, an improved understanding of the different "types" of obesity not only permits the development of potential therapies, but also proposes novel and often unexpected directions in deciphering the dysfunctional state of obesity.
Overview
The claims and statistics of this paper haven’t been checked yet.
Run the check — free, no account needed. It reads the open-access text and checks the sources it cites.
Integrity signals
Registry
Cites
Statistics
Figures
Verification
Claims the paper makes
The claims and statistics of this paper haven’t been checked yet.
Run the check — free, no account needed. It reads the open-access text and checks the sources it cites.
Claims other papers make about this one
Each is checked against this paper’s own text: does it say what the citing paper says it does?
In the citing paper
“In the initial phase, behavioral and environmental factors could play a key role in the constitution of adipose tissue excess on a genetically predisposed background [61].”
From Adipose tissue transcriptomic signature highlights the pathological relevance of extracellular matrix in human obesity (2008) · cites this paper as [61]
Self-check
Percentages, sums and reported differences re-computed from the paper’s own numbers.
The self-check needs the paper’s full text.
Citations
Cites
Krude, H., Biebermann, H., Luck, W., Horn, R., Brabant, G. E., & Grüters, A. (1998) · Nature Genetics · doi:10.1038/509 · Cited by 1,769
Farooqi, I. S., Matarese, G., Lord, G. M., Keogh, J. M., Lawrence, E., Agwu, C., Sanna, V., Jebb, S. A., Perna, F., Fontana, S., et al. (2002) · Journal of Clinical Investigation · doi:10.1172/jci15693 · Cited by 1,374
A frameshift mutation in MC4R associated with dominantly inherited human obesity
Yeo, G. S. H., Farooqi, I. S., Aminian, S., Halsall, D. J., Stanhope, R. G., & O'Rahilly, S. (1998) · Nature Genetics · doi:10.1038/2404 · Cited by 1,159
Patterns of linkage disequilibrium in the human genome
Ardlie, K., Kruglyak, L., & Seielstad, M. T. (2002) · Nature Reviews Genetics · doi:10.1038/nrg777 · Cited by 1,133
Gene–environment interactions in human diseases
Hunter, D. J. (2005) · Nature Reviews Genetics · doi:10.1038/nrg1578 · Cited by 1,132
The Human Obesity Gene Map: The 2005 Update
Rankinen, T., Zuberi, A., Chagnon, Y. C., Weisnagel, S. J., Argyropoulos, G., Walts, B., Pérusse, L., & Bouchard, C. (2006) · Obesity · doi:10.1038/oby.2006.71 · Cited by 1,119
A frameshift mutation in human MC4R is associated with a dominant form of obesity
Vaisse, C., Clément, K., Guy-grand, B., & Froguel, P. (1998) · Nature Genetics · doi:10.1038/2407 · Cited by 1,091
Self-citationMelanocortin-4 receptor mutations are a frequent and heterogeneous cause of morbid obesity
Vaisse, C., Clement, K., Durand, E., Hercberg, S., Guy-Grand, B., & Froguel, P. (2000) · Journal of Clinical Investigation · doi:10.1172/jci9238 · Cited by 897
Self-citationBrain-derived neurotrophic factor regulates energy balance downstream of melanocortin-4 receptor
Xu, B., Goulding, E. H., Zang, K., Cepoi, D., Cone, R. D., Jones, K. R., Tecott, L. H., & Reichardt, L. F. (2003) · Nature Neuroscience · doi:10.1038/nn1073 · Cited by 896
Finding genes that underlie complex traits.
Glazier, A. M., Nadeau, J. H., & Aitman, T. J. (2002) · Science · doi:10.1126/science.1076641 · Cited by 855
BDNF regulates eating behavior and locomotor activity in mice
Kernie, S. G., Liebl, D. J., & Parada, L. F. (2000) · The EMBO Journal · doi:10.1093/emboj/19.6.1290 · Cited by 806
Farooqi, I. S., Yeo, G. S. H., Keogh, J. M., Aminian, S., Jebb, S. A., Butler, G. E., Cheetham, T. D., & O’Rahilly, S. (2000) · Journal of Clinical Investigation · doi:10.1172/jci9397 · Cited by 801
Genetics of body-weight regulation
Barsh, G. S., Farooqi, I. S., & O’Rahilly, S. (2000) · Nature · doi:10.1038/35007519 · Cited by 783
A common genetic variant is associated with adult and childhood obesity.
Herbert, A., Gerry, N. P., McQueen, M. B., Heid, I. M., Pfeufer, A., Illig, T., Wichmann, H.-E., Meitinger, T., Hunter, D., Hu, F. B., et al. (2006) · Science · doi:10.1126/science.1124779 · Cited by 732 · cited 2×
“While more common statistical tests, such as the Bonferroni and Hochberg corrections, did not identify this variant, the multi-stage approach employed by the authors proved accurate, as this variant was replicated in four out of five independent populations (no significant association was found using the Nurses Health…”
MethodBell, C. G., Walley, A. J., & Froguel, P. (2005) · Nature Reviews Genetics · doi:10.1038/nrg1556 · Cited by 677
A de novo mutation affecting human TrkB associated with severe obesity and developmental delay
Yeo, G. S. H., Hung, C.-C. C., Rochford, J. J., Keogh, J. M., Gray, J. A., Sivaramakrishnan, S., O’Rahilly, S., & Farooqi, I. S. (2004) · Nature Neuroscience · doi:10.1038/nn1336 · Cited by 608
Elevated plasma ghrelin levels in Prader–Willi syndrome
Cummings, D. E., Clément, K., Purnell, J. Q., Vaisse, C., Foster, K. E., Frayo, R. S., Schwartz, M. W., Basdevant, A., & Weigle, D. S. (2002) · Nature Medicine · doi:10.1038/nm0702-643 · Cited by 599
Self-citationClayton, D. G., Walker, N. M., Smyth, D. J., Pask, R., Cooper, J. D., Maier, L. M., Smink, L. J., Lam, A. C., Ovington, N. R., Stevens, H. E., et al. (2005) · Nature Genetics · doi:10.1038/ng1653 · Cited by 526
Family-based designs in the age of large-scale gene-association studies
Laird, N. M., & Lange, C. (2006) · Nature Reviews Genetics · doi:10.1038/nrg1839 · Cited by 459
Farooqi, I. S., & O’Rahilly, S. (2005) · Annual Review of Medicine · doi:10.1146/annurev.med.56.062904.144924 · Cited by 452
The nature and identification of quantitative trait loci: a community's view
Members of the Complex Trait Consortium (2003) · Nature Reviews Genetics · doi:10.1038/nrg1206 · Cited by 446
Chiang, A. P.-F., Beck, J. S., Yen, H.-J., Tayeh, M. K., Scheetz, T. E., Swiderski, R. E., Nishimura, D. Y., Braun, T. A., Kim, K. A., Huang, J., et al. (2006) · Proceedings of the National Academy of Sciences · doi:10.1073/pnas.0600158103 · Cited by 433
Profound obesity associated with a balanced translocation that disrupts the SIM1 gene
L., J., Jr. (2000) · Human Molecular Genetics · doi:10.1093/hmg/9.1.101 · Cited by 405
Prader-Willi syndrome: advances in genetics, pathophysiology and treatment
Goldstone, A. P. (2003) · Trends in Endocrinology and Metabolism · doi:10.1016/j.tem.2003.11.003 · Cited by 397
de Luca, C., Kowalski, T. J., Zhang, Y., Elmquist, J. K., Lee, C., Kilimann, M. W., Ludwig, T. E., Liu, S.-M., & Chua, S. C. (2005) · Journal of Clinical Investigation · doi:10.1172/jci24059 · Cited by 385
Nutrigenomics and nutrigenetics: the emerging faces of nutrition
Mutch, D. M., Wahli, W., & Williamson, G. (2005) · The FASEB Journal · doi:10.1096/fj.05-3911rev · Cited by 359
Self-citationMykytyn, K., Mullins, R. F., Andrews, M., Chiang, A. P.-F., Swiderski, R. E., Yang, B., Braun, T. A., Casavant, T. L., Stone, E. M., & Sheffield, V. C. (2004) · Proceedings of the National Academy of Sciences · doi:10.1073/pnas.0402354101 · Cited by 342
Fan, Y., Esmail, M. A., Ansley, S. J., Blacque, O. E., Boroevich, K. A., Ross, A. J., Moore, S., Badano, J. L., May‐Simera, H., Compton, D. S., et al. (2004) · Nature Genetics · doi:10.1038/ng1414 · Cited by 336
Cilia: Tuning in to the Cell's Antenna
Marshall, W. F., & Nonaka, S. (2006) · Current Biology · doi:10.1016/j.cub.2006.07.012 · Cited by 295
BBS10 encodes a vertebrate-specific chaperonin-like protein and is a major BBS locus
Stoetzel, C., Laurier, V., Davis, E. E., Muller, J., Rix, S., Badano, J. L., Leitch, C. C., Salem, N., Chouery, É., Corbani, S., et al. (2006) · Nature Genetics · doi:10.1038/ng1771 · Cited by 285
Nutritional Epigenomics of Metabolic Syndrome
Gallou‐Kabani, C., & Junien, C. (2005) · Diabetes · doi:10.2337/diabetes.54.7.1899 · Cited by 278
Lubrano-Berthelier, C., Dubern, B., Lacorte, J., Picard, F., Shapiro, A., Zhang, S., Bertrais, S., Herçberg, S., Basdevant, A., Clément, K., et al. (2006) · The Journal of Clinical Endocrinology & Metabolism · doi:10.1210/jc.2005-1411 · Cited by 241
Self-citationA POMC variant implicates β-melanocyte-stimulating hormone in the control of human energy balance
Lee, Y. S., Challis, B. G., Thompson, D. A., Yeo, G. S. H., Keogh, J. M., Madonna, M. E., Wraight, V., Sims, M., Vatin, V., Meyre, D., et al. (2006) · Cell Metabolism · doi:10.1016/j.cmet.2006.01.006 · Cited by 235
Proopiomelanocortin and Energy Balance: Insights from Human and Murine Genetics
Coll, A. P., Farooqi, I. S., Challis, B., Yeo, G. S. H., & O’Rahilly, S. (2004) · The Journal of Clinical Endocrinology & Metabolism · doi:10.1210/jc.2004-0428 · Cited by 230
Melanocortin-4 Receptor Gene Variant I103 Is Negatively Associated with Obesity
Geller, F., Reichwald, K., Dempfle, A., Illig, T., Vollmert, C., Herpertz, S., Siffert, W., Platzer, M., Hess, C., Gudermann, T. W., et al. (2004) · The American Journal of Human Genetics · doi:10.1086/382490 · Cited by 217
Hinney, A., Bettecken, T., Tarnow, P., Brumm, H., Reichwald, K., Lichtner, P., Scherag, A., Nguyen, T. T., Schlumberger, P., Rief, W., et al. (2006) · The Journal of Clinical Endocrinology & Metabolism · doi:10.1210/jc.2005-2056 · Cited by 217
Comparative Genomics and Gene Expression Analysis Identifies BBS9, a New Bardet-Biedl Syndrome Gene
Nishimura, D. Y., Swiderski, R. E., Searby, C. C., Berg, E. M., Ferguson, A. L., Hennekam, R. C. M., Merin, S. C., Weleber, R. G., Biesecker, L. G., Stone, E. M., et al. (2005) · The American Journal of Human Genetics · doi:10.1086/498323 · Cited by 216
Polygenic control of Caenorhabditis elegans fat storage
Mak, H. Y., Nelson, L. S., Basson, M., Johnson, C. D., & Ruvkun, G. (2006) · Nature Genetics · doi:10.1038/ng1739 · Cited by 194
Sebhat, I. K., Martin, W. J., Ye, Z., Barakat, K., Mosley, R. T., Johnston, D. B. R., Bakshi, R. K., Palucki, B. L., Weinberg, D. H., MacNeil, T., et al. (2002) · Journal of Medicinal Chemistry · doi:10.1021/jm025539h · Cited by 194
Targeting melanocortin receptors as potential novel therapeutics
Getting, S. J. (2006) · Pharmacology & Therapeutics · doi:10.1016/j.pharmthera.2005.06.022 · Cited by 194
Statistical false positive or true disease pathway?
Todd, J. A. (2006) · Nature Genetics · doi:10.1038/ng0706-731 · Cited by 179
The metabolic syndrome: the crossroads of diet and genetics
Roche, H. M., Phillips, C. M., & Gibney, M. J. (2005) · Proceedings of The Nutrition Society · doi:10.1079/pns2005445 · Cited by 179
Exploring the molecular basis of Bardet-Biedl syndrome
Katsanis, N. (2001) · Human Molecular Genetics · doi:10.1093/hmg/10.20.2293 · Cited by 166
Kaput, J., Ordovás, J. M., Ferguson, L. R., van Ommen, B., Rodriguez, R. L., Allen, L. H., Ames, B. N., Dawson, K., German, B. J., Krauss, R. M., et al. (2005) · British Journal Of Nutrition · doi:10.1079/bjn20051585 · Cited by 156
Self-citationCarrel, A. L., Moerchen, V. A., Myers, S. E., Bekx, M. T., Whitman, B. Y., & Allen, D. B. (2004) · The Journal of Pediatrics · doi:10.1016/j.jpeds.2004.08.002 · Cited by 153
GAD2 on Chromosome 10p12 Is a Candidate Gene for Human Obesity
Boutin, P., Dina, C., Vasseur, F., Dubois, S. G., Corset, L., Séron, K., Bekris, L. M., Cabellon, J., Neve, B., Vasseur-Delannoy, V., et al. (2003) · PLoS Biology · doi:10.1371/journal.pbio.0000068 · Cited by 151
Self-citationEllacott, K. L. J., & Cone, R. D. (2006) · Philosophical Transactions of the Royal Society B Biological Sciences · doi:10.1098/rstb.2006.1861 · Cited by 138
Kublaoui, B. M., Holder, J. L., Gemelli, T., & Zinn, A. R. (2006) · Molecular Endocrinology · doi:10.1210/me.2005-0483 · Cited by 123
Gray, J. A., Yeo, G. S. H., Hung, C.-C. C., Keogh, J. M., Clayton, P., Banerjee, K., McAulay, A., O’Rahilly, S., & Farooqi, I. S. (2006) · International Journal of Obesity · doi:10.1038/sj.ijo.0803390 · Cited by 121
Functional Characterization of Mutations in Melanocortin-4 Receptor Associated with Human Obesity
Ho, G., & MacKenzie, R. G. (1999) · Journal of Biological Chemistry · doi:10.1074/jbc.274.50.35816 · Cited by 121
Molecular Genetics of Human Obesity‐Associated MC4R Mutations
Lubrano-Berthelier, C., Cavazos, M. M., Dubern, B., Shapiro, A., Stunff, C. L., Zhang, S., Picart, F., Govaerts, C., Froguel, P., Bougneres, P. F., et al. (2003) · Annals of the New York Academy of Sciences · doi:10.1111/j.1749-6632.2003.tb03161.x · Cited by 119
Self-citationHeid, I. M., Vollmert, C., Hinney, A., Döring, A., Geller, F., Löwel, H., Wichmann, H. ‐., Illig, T., Hebebrand, J., & Kronenberg, F. (2005) · Journal of Medical Genetics · doi:10.1136/jmg.2004.027011 · Cited by 114
PT‐141: A Melanocortin Agonist for the Treatment of Sexual Dysfunction
Molinoff, P. B., Shadiack, A. M., Earle, D. C., Diamond, L. E., & Quon, C. Y. (2003) · Annals of the New York Academy of Sciences · doi:10.1111/j.1749-6632.2003.tb03167.x · Cited by 106
S�rensen, T. I. A., Boutin, P., Taylor, M. A., Larsen, L. H., Verdich, C., Petersen, L. V., Holst, C., Echwald, S. M., Dina, C., Toubro, S., et al. (2006) · PLoS Clinical Trials · doi:10.1371/journal.pctr.0010012 · Cited by 80
Self-citationPerspectives: molecular genetic research in human obesity
Hebebrand, J., Friedel, S., Schäuble, N., Geller, F., & Hinney, A. (2003) · Obesity Reviews · doi:10.1046/j.1467-789x.2003.00106.x · Cited by 80
Clément, K. (2006) · Comptes Rendus Biologies · doi:10.1016/j.crvi.2005.10.009 · Cited by 79
Self-citationTriallelic inheritance: a bridge between Mendelian and multifactorial traits
Eichers, E. R., Lewis, R. A., Katsanis, N., & Lupski, J. R. (2004) · Annals of Medicine · doi:10.1080/07853890410026214 · Cited by 70
Slavotinek, A. M., Searby, C. C., Al‐Gazali, L., Hennekam, R. C. M., Schrander-Stumpel, C. T. R. M., Orcana-Losa, M., Pardo-Reoyo, S., Cantani, A., Kumar, D., Capellini, Q., et al. (2002) · Human Genetics · doi:10.1007/s00439-002-0733-3 · Cited by 68
Clément, K. (2005) · Proceedings of The Nutrition Society · doi:10.1079/pns2005416 · Cited by 65
Self-citationMelanocortin-4 receptors, β-MSH and leptin: Key elements in the satiety pathway
Harrold, J. A., & Williams, G. (2005) · Peptides · doi:10.1016/j.peptides.2005.01.030 · Cited by 61
Li, G., Zhang, Y., Wilsey, J. T., & Scarpace, P. J. (2005) · Diabetologia · doi:10.1007/s00125-005-1943-8 · Cited by 54
Lack of Support for the Association between GAD2 Polymorphisms and Severe Human Obesity
Swarbrick, M. M., Waldenmaier, B., Pennacchio, L. A., Lind, D. L., Cavazos, M. M., Geller, F., Merriman, R. B., Ustaszewska, A., Malloy, M. J., Scherag, A., et al. (2005) · PLoS Biology · doi:10.1371/journal.pbio.0030315 · Cited by 51
Molecular physiology of syndromic obesities in humans
Chung, W. K., & Leibel, R. L. (2005) · Trends in Endocrinology and Metabolism · doi:10.1016/j.tem.2005.06.009 · Cited by 48
Strategies for dissecting epigenetic mechanisms in the mouse
Mager, J., & Bartolomei, M. S. (2005) · Nature Genetics · doi:10.1038/ng1664 · Cited by 39
Personalized Medicine: Decades Away?
Lunshof, J. E., Pirmohamed, M., & Gurwitz, D. (2006) · Pharmacogenomics · doi:10.2217/14622416.7.2.237 · Cited by 35
DiOGenes: a multidisciplinary offensive focused on the obesity epidemic
Saris, W. H. M., & Harper, A. E. (2005) · Obesity Reviews · doi:10.1111/j.1467-789x.2005.00200.x · Cited by 33
The 103I Variant of the Melanocortin 4 Receptor Is Associated with Low Serum Triglyceride Levels
Brönner, G., Sattler, A., Hinney, A., Soufi, M., Geller, F., Schäfer, H., Maisch, B., Hebebrand, J., & Schaefer, J. R. (2006) · The Journal of Clinical Endocrinology & Metabolism · doi:10.1210/jc.2005-0919 · Cited by 31
Emerging trends in the search for genetic variants predisposing to human obesity
Swarbrick, M. M., & Vaisse, C. (2003) · Current Opinion in Clinical Nutrition & Metabolic Care · doi:10.1097/01.mco.0000078997.96795.03 · Cited by 28
MT‐II Induces Penile Erection via Brain and Spinal Mechanisms
Wessells, H., Hruby, V. J., Hackett, J. T., Han, G., Balse, P., & Vanderah, T. W. (2003) · Annals of the New York Academy of Sciences · doi:10.1111/j.1749-6632.2003.tb03166.x · Cited by 28
The Effect of the Melanocortin Agonist, MT-II, on the Defended Level of Body Adiposity
Seeley, R. J., Burklow, M. L., Wilmer, K. A., Matthews, C. C., Reizes, O., McOsker, C. C., Trokhan, D. P., Gross, M. C., & Sheldon, R. J. (2005) · Endocrinology · doi:10.1210/en.2004-1663 · Cited by 26
Identifying regulatory hubs in obesity with nutrigenomics
Mutch, D. M. (2006) · Current Opinion in Endocrinology & Diabetes · doi:10.1097/01.med.0000244224.76033.06 · Cited by 13
Self-citationIs GAD2 on Chromosome 10p12 a Potential Candidate Gene for Morbid Obesity?
Tiwari, H. K., Bouchard, L., Përusse, L., & Allison, D. B. (2005) · Nutrition Reviews · doi:10.1111/j.1753-4887.2005.tb00147.x · Cited by 9
Growth hormone therapy in children with Prader-Willi syndrome
Franzese, A., Romano, A., Spagnuolo, M. I., Ruju, F., & Valerio, G. (2006) · The Journal of Pediatrics · doi:10.1016/j.jpeds.2005.10.022 · Cited by 7
Gorman, C. (2006) · PubMed · Cited by 3
Research works printed but not linked: 71
- Lunshof, 2006, Pharmacogenomics, 7, 237
- Hunter, 2005, Nat Rev Genet, 6, 287
- Mutch, 2005, FASEB J, 19, 1602
- Kaput, 2005, Br J Nutr, 94, 623
- Gorman, 2006, Time, 167, 69
- Rankinen, 2006, Obesity (Silver Spring), 14, 529
- Bell, 2005, Nat Rev Genet, 6, 221
- Farooqi, 2005, Annu Rev Med, 56, 443
- Ardlie, 2002, Nat Rev Genet, 3, 299
- Barsh, 2000, Nature, 404, 644
- Ellacott, 2006, Philos Trans R Soc Lond B Biol Sci, 361, 1265
- Coll, 2004, J Clin Endocrinol Metab, 89, 2557
- Harrold, 2006, Peptides, 27, 365
- Clement, 2005, Proc Nutr Soc, 64, 133
- Holder, 2000, Hum Mol Genet, 9, 101
- Kublaoui, 2006, Mol Endocrinol, 20, 2483
- Kernie, 2000, EMBO J, 19, 1290
- Xu, 2003, Nat Neurosci, 6, 736
- Gray, 2006, Int J Obes (Lond)
- Yeo, 2004, Nat Neurosci, 7, 1187
- Vaisse, 1998, Nat Genet, 20, 113
- Yeo, 1998, Nat Genet, 20, 111
- Vaisse, 2000, J Clin Invest, 106, 253
- Farooqi, 2000, J Clin Invest, 106, 271
- Hinney, 2006, J Clin Endocrinol Metab, 91, 1761
- Lubrano-Berthelier, 2006, J Clin Endocrinol Metab, 91, 1811
- Lubrano-Berthelier, 2003, Ann N Y Acad Sci, 994, 49
- Ho, 1999, J Biol Chem, 274, 35816
- Krude, 1998, Nat Genet, 19, 155
- Lee, 2006, Cell Metab, 3, 135
- Farooqi, 2002, J Clin Invest, 110, 1093
- Getting, 2006, Pharmacol Ther, 111, 1
- de Luca, 2005, J Clin Invest, 115, 3484
- Li, 2005, Diabetologia, 48, 2376
- Seeley, 2005, Endocrinology, 146, 3732
- Molinoff, 2003, Ann N Y Acad Sci, 994, 96
- Sebhat, 2002, J Med Chem, 45, 4589
- Wessells, 2003, Ann N Y Acad Sci, 994, 90
- Chung, 2005, Trends Endocrinol Metab, 16, 267
- Goldstone, 2004, Trends Endocrinol Metab, 15, 12
- Cummings, 2002, Nat Med, 8, 643
- Franzese, 2006, J Pediatr, 148, 846
- Carrel, 2004, J Pediatr, 145, 744
- Katsanis, 2001, Hum Mol Genet, 10, 2293
- Stoetzel, 2006, Nat Genet, 38, 521
- Nishimura, 2005, Am J Hum Genet, 77, 1021
- Chiang, 2006, Proc Natl Acad Sci U S A, 103, 6287
- Eichers, 2004, Ann Med, 36, 262
- Slavotinek, 2002, Hum Genet, 110, 561
- Fan, 2004, Nat Genet, 36, 989
- Marshall, 2006, Curr Biol, 16, R604
- Mykytyn, 2004, Proc Natl Acad Sci U S A, 101, 8664
- Mak, 2006, Nat Genet, 38, 363
- Roche, 2005, Proc Nutr Soc, 64, 371
- Swarbrick, 2003, Curr Opin Clin Nutr Metab Care, 6, 369
- Hebebrand, 2003, Obes Rev, 4, 139
- Gallou-Kabani, 2005, Diabetes, 54, 1899
- Mager, 2005, Nat Genet, 37, 1194
- Mutch, 2006, Curr Opin Endocrinol Diabetes, 13, 431
- Laird, 2006, Nat Rev Genet, 7, 385
- Glazier, 2002, Science, 298, 2345
- Clayton, 2005, Nat Genet, 37, 1243
- Tiwari, 2005, Nutr Rev, 63, 315
- Abiola, 2003, Nat Rev Genet, 4, 911
- Herbert, 2006, Science, 312, 279
- Todd, 2006, Nat Genet, 38, 731
- Saris, 2005, Obes Rev, 6, 175
- Sørensen, 2006, PLoS Clin Trials, 1
- Bronner, 2006, J Clin Endocrinol Metab, 91, 535
- Heid, 2005, J Med Genet, 42, e21
- Geller, 2004, Am J Hum Genet, 74, 572
Cited by
Sorted by citations
Dietary intervention impact on gut microbial gene richness
Cotillard, A., Kennedy, S. P., Kong, L. C., Prifti, E., Pons, N., Le Chatelier, E., Almeida, M., Quinquis, B., Levenez, F., Galleron, N., et al. (2013) · Nature · doi:10.1038/nature12480 · Cited by 1,832
Self-citationThorleifsson, G., Walters, G. B., Gudbjartsson, D. F., Steinthorsdottir, V., Sulem, P., Helgadottir, A., Styrkarsdottir, U., Gretarsdottir, S., Thorlacius, S., Jonsdottir, I., et al. (2009) · Nature Genetics · doi:10.1038/ng.274 · Cited by 1,375
Childhood and Adolescent Obesity: A Review
Kansra, A. R., Lakkunarajah, S., & Jay, M. S. (2021) · Frontiers in Pediatrics · doi:10.3389/fped.2020.581461 · Cited by 631
Henegar, C., Tordjman, J., Achard, V., Lacasa, D., Cremer, I., Guerre-Millo, M., Poitou, C., Basdevant, A., Stich, V., Viguerie, N., et al. (2008) · Genome Biology · doi:10.1186/gb-2008-9-1-r14 · Cited by 471
Pallejá, A., Kashani, A., Allin, K. H., Nielsen, T., Zhang, C., Li, Y., Brach, T., Liang, S., Feng, Q., Jørgensen, N. B., et al. (2016) · Genome Medicine · doi:10.1186/s13073-016-0312-1 · Cited by 320
Metadata
- Authors
- Mutch, D. M., & Clément, K.
- Affiliations
- Inserm (FR)
- University College London (GB)
- Corresponding author
- Clément, Karine
- Venue
- PLoS Genetics
- Publisher
- Public Library of Science (PLoS)
- Published
- 2006
- Volume
- 2
- Issue
- 12
- Pages
- e188
- ISSN
- 1553-7390 (ISSN-L)
- 1553-7404
- PMC
- PMC1756898
- OpenAlex
- W1977583120
- Cited by
- 169
- References
- 74
- Citations by year
- 2026: 1 · 2023: 3 · 2022: 5 · 2021: 4 · 2020: 6 · 2019: 8 · 2018: 7 · 2017: 10 · 2016: 12 · 2015: 7 · 2014: 11 · 2013: 13 · 2012: 13
- FWCI
- 1.43
- Type
- journal article
- Language
- en
- Open access
- gold
- doi.org
- Locations
- PLoS Genetics (publishedVersion, cc-by)
- Europe PMC (PubMed Central) (publishedVersion, cc-by)
- PubMed Central (publishedVersion, cc-by)
- PubMed (publishedVersion)
- DOAJ (DOAJ: Directory of Open Access Journals) (submittedVersion, cc-by-sa)
- Topics
- Life Sciences › Neuroscience › Endocrine and Autonomic Systems › Regulation of Appetite and Obesity
- Life Sciences › Biochemistry, Genetics and Molecular Biology › Genetics › Genetic Associations and Epidemiology
- Health Sciences › Medicine › Endocrinology, Diabetes and Metabolism › Adipokines, Inflammation, and Metabolic Diseases
- Keywords
- human obesity, monogenic obesity, leptin, melanocortin pathway, melanocortin-4 receptor, Prader-Willi syndrome, Bardet-Biedl syndrome, gene-environment interaction, obesity phenotypes, obesity treatment
- MeSH terms
- Animals, Chromosome Mapping, Environment, Humans, Hypothalamus, Mutation, Obesity, Phenotype, Syndrome, Gene Expression Profiling
About these checks
Registry, retraction, Cites and statistics results are computed, not judged, with one exception: a printed reference that no index lists is read once by a model before it counts as a citation error. Claims are extracted by a model and kept only when their quote appears verbatim in the text; each cited source is then checked, with a model’s help, for whether it says what the claim relies on. Those verdicts can be wrong — read the claim’s quote and the cited source before relying on one.
Statistics and arithmetic are recomputed, not judged.
Confidence bands are shown only for fields calibrated on our annotated test set. None is calibrated yet, so no band is shown.
What counts as a claim ›How we measure confidence ›How we check this ›
Are you an author, or do you see a problem with this page? Request a review
