

The DOI matches its Crossref record; 95 of the 97 references it cites were found in a registry or an index.
Patterns of Positive Selection in Six Mammalian Genomes
Open accessAbstract
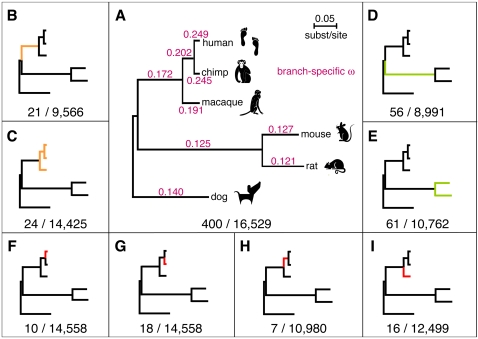
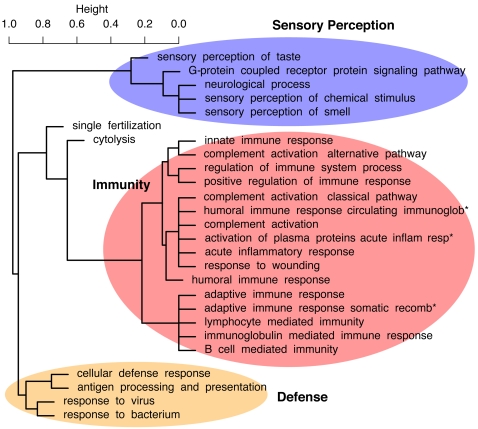
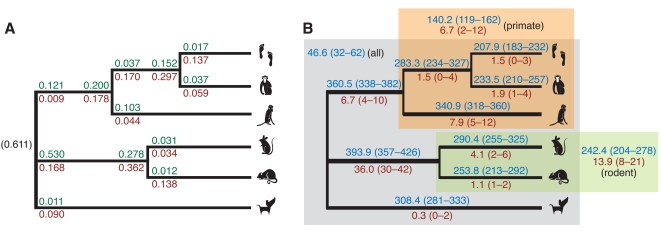
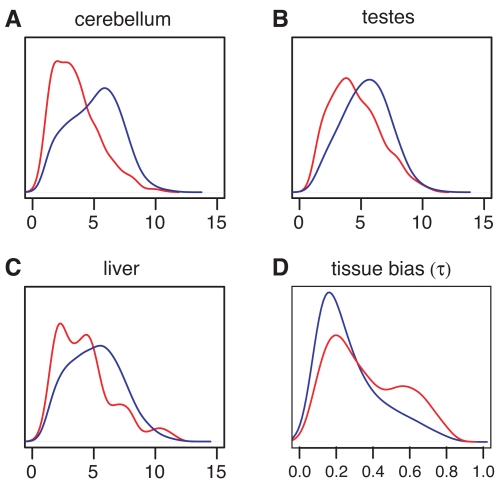
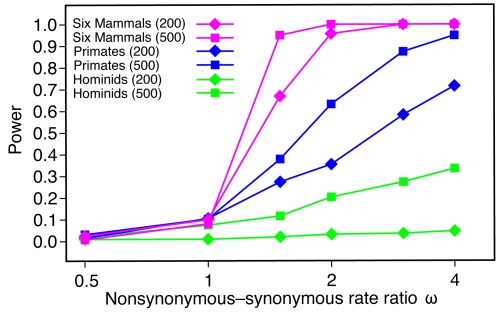
Genome-wide scans for positively selected genes (PSGs) in mammals have provided insight into the dynamics of genome evolution, the genetic basis of differences between species, and the functions of individual genes. However, previous scans have been limited in power and accuracy owing to small numbers of available genomes. Here we present the most comprehensive examination of mammalian PSGs to date, using the six high-coverage genome assemblies now available for eutherian mammals. The increased phylogenetic depth of this dataset results in substantially improved statistical power, and permits several new lineage- and clade-specific tests to be applied. Of approximately 16,500 human genes with high-confidence orthologs in at least two other species, 400 genes showed significant evidence of positive selection (FDR<0.05), according to a standard likelihood ratio test. An additional 144 genes showed evidence of positive selection on particular lineages or clades. As in previous studies, the identified PSGs were enriched for roles in defense/immunity, chemosensory perception, and reproduction, but enrichments were also evident for more specific functions, such as complement-mediated immunity and taste perception. Several pathways were strongly enriched for PSGs, suggesting possible co-evolution of interacting genes. A novel Bayesian analysis of the possible "selection histories" of each gene indicated that most PSGs have switched multiple times between positive selection and nonselection, suggesting that positive selection is often episodic. A detailed analysis of Affymetrix exon array data indicated that PSGs are expressed at significantly lower levels, and in a more tissue-specific manner, than non-PSGs. Genes that are specifically expressed in the spleen, testes, liver, and breast are significantly enriched for PSGs, but no evidence was found for an enrichment for PSGs among brain-specific genes. This study provides additional evidence for widespread positive selection in mammalian evolution and new genome-wide insights into the functional implications of positive selection.
Overview
The claims and statistics of this paper haven’t been checked yet.
Run the check — free, no account needed. It reads the open-access text and checks the sources it cites.
Integrity signals
Registry
Cites
Statistics
Figures
Verification
Claims the paper makes
The claims and statistics of this paper haven’t been checked yet.
Run the check — free, no account needed. It reads the open-access text and checks the sources it cites.
Claims other papers make about this one
Each is checked against this paper’s own text: does it say what the citing paper says it does?
The cited source says what the claim attributes to it.
In the citing paper
“Genomic comparisons between closely related species provide insights into the genetic basis of mammalian divergence and adaptation 8,9 .”
From The yak genome and adaptation to life at high altitude (2012) · cites this paper as [8]
Self-check
Percentages, sums and reported differences re-computed from the paper’s own numbers.
The self-check needs the paper’s full text.
Citations
Cites
Controlling the False Discovery Rate: A Practical and Powerful Approach to Multiple Testing
Benjamini, Y., & Hochberg, Y. (1995) · Journal of the Royal Statistical Society Series B: Statistical Methodology · doi:10.1111/j.2517-6161.1995.tb02031.x · Cited by 109,482
Gene Ontology: tool for the unification of biology
Ashburner, M., Ball, C. A., Blake, J. A., Botstein, D., Butler, H., Cherry, J. M., Davis, A. P., Dolinski, K., Dwight, S. S., Eppig, J. T., et al. (2000) · Nature Genetics · doi:10.1038/75556 · Cited by 43,206
Initial sequencing and analysis of the human genome
International Human Genome Sequencing Consortium, Whitehead Institute for Biomedical Research, C. F. G. R., Lander, E. S., Linton, L. M., Birren, B., Nusbaum, C., Zody, M. C., Baldwin, J., Devon, K., Dewar, K., et al. (2001) · Nature · doi:10.1038/35057062 · Cited by 24,216
A Simple Sequentially Rejective Multiple Test Procedure
(1979) · Scandinavian Journal of Statistics · doi:10.2307/4615733 · Cited by 21,526
Statistical Methods for Research Workers
Fisher, R. A. (1945) · American Journal of Clinical Pathology · doi:10.1093/ajcp/15.11.552b · Cited by 10,883
Initial sequencing and comparative analysis of the mouse genome
Mouse Genome Sequencing Consortium (2002) · Nature · doi:10.1038/nature01262 · Cited by 7,187
A haplotype map of the human genome
The International HapMap Consortium (2005) · Nature · doi:10.1038/nature04226 · Cited by 5,858
PAML: a program package for phylogenetic analysis by maximum likelihood
Yang, Z. (1997) · Computer applications in the biosciences · doi:10.1093/bioinformatics/13.5.555 · Cited by 5,377
Summaries of Affymetrix GeneChip probe level data
Irizarry, R. A. (2003) · Nucleic Acids Research · doi:10.1093/nar/gng015 · Cited by 4,837
Pruitt, K. D., Tatusova, T. A., & Maglott, D. R. (2006) · Nucleic Acids Research · doi:10.1093/nar/gkl842 · Cited by 4,441
Pruitt, K., Tatusova, T., & Maglott, D. (2004) · Nucleic Acids Res. · doi:10.1093/nar/gki025 · Cited by 3,248
From genomics to chemical genomics: new developments in KEGG
Kanehisa, M. I. (2005) · Nucleic Acids Research · doi:10.1093/nar/gkj102 · Cited by 3,126
A Map of Recent Positive Selection in the Human Genome
Voight, B. F., Kudaravalli, S., Wen, X., & Pritchard, J. K. (2006) · PLoS Biology · doi:10.1371/journal.pbio.0040072 · Cited by 2,925
Genome sequence, comparative analysis and haplotype structure of the domestic dog
members, B. S. P., Lindblad-Toh, K., Wade, C. M., Mikkelsen, T. S., Karlsson, E. K., Jaffe, D. B., Kamal, M., Clamp, M., Chang, J. L., Kulbokas, E. J., et al. (2005) · Nature · doi:10.1038/nature04338 · Cited by 2,568
Initial sequence of the chimpanzee genome and comparison with the human genome
The Chimpanzee Sequencing and Analysis Consortium (2005) · Nature · doi:10.1038/nature04072 · Cited by 2,459
Bayes Empirical Bayes Inference of Amino Acid Sites Under Positive Selection
Yang, Z. (2005) · Molecular Biology and Evolution · doi:10.1093/molbev/msi097 · Cited by 2,326
Statistical Methods for Research Workers.
I., L., & Fisher, R. A. (1926) · Journal Of The Royal Statistical Society · doi:10.2307/2341488 · Cited by 2,171
Genome sequence of the Brown Norway rat yields insights into mammalian evolution
Gibbs, R. A., Weinstock, G. M., Metzker, M. L., Muzny, D. M., Sodergren, E. J., Scherer, S. E., Scott, G., Steffen, D. L., Worley, K. C., Burch, P. E., et al. (2004) · Nature · doi:10.1038/nature02426 · Cited by 2,170
Evolution of genes and genomes on the Drosophila phylogeny
Drosophila 12 Genomes Consortium (2007) · Nature · doi:10.1038/nature06341 · Cited by 2,010
Zhang, J. (2005) · Molecular Biology and Evolution · doi:10.1093/molbev/msi237 · Cited by 1,785
Molecular Signatures of Natural Selection
Nielsen, R. (2005) · Annual Review of Genetics · doi:10.1146/annurev.genet.39.073003.112420 · Cited by 1,705
Self-citationNielsen, R., & Yang, Z. (1998) · Genetics · doi:10.1093/genetics/148.3.929 · Cited by 1,622
Self-citationDiet and the evolution of human amylase gene copy number variation
Perry, G. H., Dominy, N. J., Claw, K. G., Lee, A. S., Fiegler, H., Redon, R., Werner, J., Villanea, F. A., Mountain, J. L., Misra, R., et al. (2007) · Nature Genetics · doi:10.1038/ng2123 · Cited by 1,496
Aligning Multiple Genomic Sequences With the Threaded Blockset Aligner
Blanchette, M., Kent, W. J., Riemer, C., Elnitski, L., Smit, A. F. A., Roskin, K. M., Baertsch, R., Rosenbloom, K., Clawson, H., Green, E. D., et al. (2004) · Genome Research · doi:10.1101/gr.1933104 · Cited by 1,452
Evolutionary and biomedical insights from the rhesus macaque genome.
Gibbs, R. A., Rogers, J., Katze, M. G., Bumgarner, R., Weinstock, G. M., Mardis, E. R., Remington, K. A., Strausberg, R. L., Venter, J. C., Wilson, R. K., et al. (2007) · Science · doi:10.1126/science.1139247 · Cited by 1,403
Self-citationYang, Z., & Nielsen, R. (2002) · Molecular Biology and Evolution · doi:10.1093/oxfordjournals.molbev.a004148 · Cited by 1,374
Self-citationThe Receptors for Mammalian Sweet and Umami Taste
Zhao, G. Q., Zhang, Y., Hoon, M. A., Chandrashekar, J. V., Erlenbach, I., Ryba, N. J. P., & Zuker, C. S. (2003) · Cell · doi:10.1016/s0092-8674(03)00844-4 · Cited by 1,343
Yanai, I., Benjamin, H., Shmoish, M., Chalifa-Caspi, V., Shklar, M., Ophir, R., Bar-Even, A., Horn-Saban, S., Safran, M., Domany, E., et al. (2005) · Bioinformatics · doi:10.1093/bioinformatics/bti042 · Cited by 1,300
How Malaria Has Affected the Human Genome and What Human Genetics Can Teach Us about Malaria
Kwiatkowski, D. P. (2005) · The American Journal of Human Genetics · doi:10.1086/432519 · Cited by 1,149
Structure of acid-sensing ion channel 1 at 1.9 Å resolution and low pH
Jasti, J., Furukawa, H., Gonzales, E. B., & Gouaux, E. (2007) · Nature · doi:10.1038/nature06163 · Cited by 1,044
A Scan for Positively Selected Genes in the Genomes of Humans and Chimpanzees
Nielsen, R., Bustamante, C. D., Clark, A. G., Glanowski, S., Sackton, T. B., Hubisz, M. J., Fledel-Alon, A., Tanenbaum, D. M., Civello, D., White, T. J., et al. (2005) · PLoS Biology · doi:10.1371/journal.pbio.0030170 · Cited by 998
Self-citationHuman and mouse proteases: a comparative genomic approach
Puente, X. S., Sánchez, L. M., Overall, C. M., & López-Otı́n, C. (2003) · Nature Reviews Genetics · doi:10.1038/nrg1111 · Cited by 964
Evolution's cauldron: Duplication, deletion, and rearrangement in the mouse and human genomes
Kent, W. J., Baertsch, R., Hinrichs, A., Miller, W., & Haussler, D. (2003) · Proceedings of the National Academy of Sciences · doi:10.1073/pnas.1932072100 · Cited by 850
Why highly expressed proteins evolve slowly
Drummond, D. A., Bloom, J. D., Adami, C., Wilke, C. O., & Arnold, F. H. (2005) · Proceedings of the National Academy of Sciences · doi:10.1073/pnas.0504070102 · Cited by 815
Natural selection on protein-coding genes in the human genome
Bustamante, C. D., Fledel-Alon, A., Williamson, S., Nielsen, R., Hubisz, M. J., Glanowski, S., Tanenbaum, D. M., White, T. J., Sninsky, J. J., Hernandez, R. D., et al. (2005) · Nature · doi:10.1038/nature04240 · Cited by 794
Self-citationChen, F.-C., & Li, W. (2001) · The American Journal of Human Genetics · doi:10.1086/318206 · Cited by 720
Inferring Nonneutral Evolution from Human-Chimp-Mouse Orthologous Gene Trios
Clark, A. G., Glanowski, S., Nielsen, R., Thomas, P. D., Kejariwal, A., Todd, M. A., Tanenbaum, D. M., Civello, D., Lu, F., Murphy, B., et al. (2003) · Science · doi:10.1126/science.1088821 · Cited by 667
Self-citationThomas, P. D. (2003) · Nucleic Acids Research · doi:10.1093/nar/gkg115 · Cited by 665
Population Genomics: Whole-Genome Analysis of Polymorphism and Divergence in Drosophila simulans
Begun, D. J., Holloway, A. K., Stevens, K., Hillier, L. W., Poh, Y.-P., Hahn, M. W., Nista, P. M., Jones, C. D., Kern, A. D., Dewey, C. N., et al. (2007) · PLoS Biology · doi:10.1371/journal.pbio.0050310 · Cited by 637
Neurotensin and neurotensin receptors
Vincent, J., Mazella, J., & Kitabgi, P. (1999) · Trends in Pharmacological Sciences · doi:10.1016/s0165-6147(99)01357-7 · Cited by 568
Recent and ongoing selection in the human genome
Nielsen, R., Hellmann, I., Hubisz, M. J., Bustamante, C. D., & Clark, A. G. (2007) · Nature Reviews Genetics · doi:10.1038/nrg2187 · Cited by 513
Self-citationForces shaping the fastest evolving regions in the human genome
Pollard, K. S., Salama, S. R., King, B., Kern, A. D., Dreszer, T., Katzman, S., Siepel, A., Pedersen, J. S., Bejerano, G., Baertsch, R., et al. (2006) · PLoS Genetics · doi:10.1371/journal.pgen.0020168 · Cited by 511
Self-citationLocalizing Recent Adaptive Evolution in the Human Genome.
Williamson, S. H., Hubisz, M. J., Clark, A. G., Payseur, B. A., Bustamante, C. D., & Nielsen, R. (2007) · PLoS Genetics · doi:10.1371/journal.pgen.0030090 · Cited by 507
Self-citationDuret, L., & Mouchiroud, D. (2000) · Molecular Biology and Evolution · doi:10.1093/oxfordjournals.molbev.a026239 · Cited by 505
Hsu, F., Kent, W. J., Clawson, H., Kuhn, R. M., Diekhans, M., & Haussler, D. H. (2006) · Bioinformatics · doi:10.1093/bioinformatics/btl048 · Cited by 503
Kurima, K., Peters, L. M., Yang, Y., Riazuddin, S., Ahmed, Z. M., Naz, S., Arnaud, D., Drury, S. S., Mo, J., Makishima, T., et al. (2002) · Nature Genetics · doi:10.1038/ng842 · Cited by 476
Episodic adaptive evolution of primate lysozymes
Messier, W., & Stewart, C. (1997) · Nature · doi:10.1038/385151a0 · Cited by 476
p53 regulates maternal reproduction through LIF
Hu, W., Feng, Z., Teresky, A. K., & Levine, A. J. (2007) · Nature · doi:10.1038/nature05993 · Cited by 456
Accelerated Evolution of Nervous System Genes in the Origin of Homo sapiens
Dorus, S., Vallender, E. J., Evans, P. D., Anderson, J. R., Gilbert, S. L., Mahowald, M. A., Wyckoff, G. J., Malcom, C. M., & Lahn, B. T. (2004) · Cell · doi:10.1016/j.cell.2004.11.040 · Cited by 429
Dynamic evolution of the innate immune system in Drosophila
Sackton, T. B., Lazzaro, B. P., Schlenke, T. A., Evans, J. D., Hultmark, D., & Clark, A. G. (2007) · Nature Genetics · doi:10.1038/ng.2007.60 · Cited by 423
Methods to Detect Selection in Populations with Applications to the Human
Kreitman, M. (2000) · Annual Review of Genomics and Human Genetics · doi:10.1146/annurev.genom.1.1.539 · Cited by 421
The TIM gene family: emerging roles in immunity and disease
Kuchroo, V. K., Umetsu, D. T., DeKruyff, R. H., & Freeman, G. J. (2003) · Nature Reviews Immunology · doi:10.1038/nri1111 · Cited by 388
Orthology, paralogy and proposed classification for paralog subtypes
Sonnhammer, E. L. L., & Koonin, E. V. (2002) · Trends in Genetics · doi:10.1016/s0168-9525(02)02793-2 · Cited by 380
Global landscape of recent inferred Darwinian selection for Homo sapiens
Wang, E. T., Kodama, G., Baldi, P., & Moyzis, R. K. (2005) · Proceedings of the National Academy of Sciences · doi:10.1073/pnas.0509691102 · Cited by 376
The vertebrate genome annotation (Vega) database
Wilming, L. G., Gilbert, J. G. R., Howe, K., Trevanion, S. J., Hubbard, T., & Harrow, J. (2007) · Nucleic Acids Research · doi:10.1093/nar/gkm987 · Cited by 352
Expression profiling in primates reveals a rapid evolution of human transcription factors
Gilad, Y., Oshlack, A., Smyth, G. K., Speed, T. P., & White, K. P. (2006) · Nature · doi:10.1038/nature04559 · Cited by 323
Haygood, R., Fedrigo, O. D., Hanson, B., Yokoyama, K.-D., & Wray, G. A. (2007) · Nature Genetics · doi:10.1038/ng2104 · Cited by 311
Genomic regions exhibiting positive selection identified from dense genotype data
Carlson, C. S., Thomas, D. J., Eberle, M. A., Swanson, J. E., Livingston, R. J., Rieder, M. J., & Nickerson, D. A. (2005) · Genome Research · doi:10.1101/gr.4326505 · Cited by 298
Evolution of protein-coding genes in Drosophila
Larracuente, A. M., Sackton, T. B., Greenberg, A. J., Wong, A., Singh, N. D., Sturgill, D. M., Zhang, Y., Oliver, B., & Clark, A. G. (2008) · Trends in Genetics · doi:10.1016/j.tig.2007.12.001 · Cited by 264
Positive selection on the human genome
Vallender, E. J. (2004) · Human Molecular Genetics · doi:10.1093/hmg/ddh253 · Cited by 249
Rees, M. I., Harvey, K., Pearce, B. R., Chung, S., Duguid, I., Thomas, P., Beatty, S. E., Graham, G. E., Armstrong, L., Shiang, R., et al. (2006) · Nature Genetics · doi:10.1038/ng1814 · Cited by 236
Torgerson, D. G., Kulathinal, R. J., & Singh, R. S. (2002) · Molecular Biology and Evolution · doi:10.1093/oxfordjournals.molbev.a004021 · Cited by 231
More genes underwent positive selection in chimpanzee evolution than in human evolution
Bakewell, M. A., Shi, P., & Zhang, J. (2007) · Proceedings of the National Academy of Sciences · doi:10.1073/pnas.0701705104 · Cited by 221
The molecular clock may be an episodic clock.
Gillespie, J. H. (1984) · Proceedings of the National Academy of Sciences · doi:10.1073/pnas.81.24.8009 · Cited by 214
Anisimova, M., & Yang, Z. (2007) · Molecular Biology and Evolution · doi:10.1093/molbev/msm042 · Cited by 213
Nichols, B. L., Avery, S. E., Sen, P., Swallow, D. M., Hahn, D., & Sterchi, E. E. (2003) · Proceedings of the National Academy of Sciences · doi:10.1073/pnas.0237170100 · Cited by 202
Evidence for Widespread Degradation of Gene Control Regions in Hominid Genomes
Keightley, P. D., Lercher, M. J., & Eyre‐Walker, A. (2005) · PLoS Biology · doi:10.1371/journal.pbio.0030042 · Cited by 198
Modeling the site-specific variation of selection patterns along lineages
Guindon, S., Rodrigo, A. G., Dyer, K. A., & Huelsenbeck, J. P. (2004) · Proceedings of the National Academy of Sciences · doi:10.1073/pnas.0402177101 · Cited by 187
Demographic Histories and Patterns of Linkage Disequilibrium in Chinese and Indian Rhesus Macaques
Hernandez, R. D., Hubisz, M. J., Wheeler, D. A., Smith, D. G., Ferguson, B. M., Rogers, J., Nazareth, L., Indap, A. R., Bourquin, T., McPherson, J. D., et al. (2007) · Science · doi:10.1126/science.1140462 · Cited by 176
Self-citationSantiago, C. A., Ballesteros, Á., Tami, C., Martínez‐Muñoz, L., Kaplan, G. G., & Casasnovas, J. M. (2007) · Immunity · doi:10.1016/j.immuni.2007.01.014 · Cited by 166
Nielsen, R. (2003) · Molecular Biology and Evolution · doi:10.1093/molbev/msg147 · Cited by 156
Self-citationPositive Selection, Relaxation, and Acceleration in the Evolution of the Human and Chimp Genome
Arbiza, L., Dopazo, J., & Dopazo, H. (2006) · PLoS Computational Biology · doi:10.1371/journal.pcbi.0020038 · Cited by 152
The Vertebrate Genome Annotation (Vega) database
Ashurst, J. L. (2004) · Nucleic Acids Research · doi:10.1093/nar/gki135 · Cited by 141
Specificity in protein interactions and its relationship with sequence diversity and coevolution
Hakes, L., Lovell, S. C., Oliver, S. G., & Robertson, D. L. (2007) · Proceedings of the National Academy of Sciences · doi:10.1073/pnas.0609962104 · Cited by 133
Estimating Ancestral Population Sizes and Divergence Times
Wall, J. D. (2003) · Genetics · doi:10.1093/genetics/163.1.395 · Cited by 129
Margulies, E. H., Vinson, J. P., Program¶, N. C. S., Miller, W., Jaffe, D. B., Lindblad‐Toh, K., Chang, J. L., Green, E. D., Lander, E. S., Mullikin, J. C., et al. (2005) · Proceedings of the National Academy of Sciences · doi:10.1073/pnas.0409882102 · Cited by 119
Exon arrays provide accurate assessments of gene expression
Kapur, K., Xing, Y., Ouyang, Z., & Wong, W. H. (2007) · Genome biology · doi:10.1186/gb-2007-8-5-r82 · Cited by 116
Rate of Evolution in Brain-Expressed Genes in Humans and Other Primates
Wang, H., Chien, H., Osada, N., Hashimoto, K., Sugano, S., Gojobori, T., Chou, C., Tsai, S., Wu, C., & Shen, C. ‐. J. (2006) · PLoS Biology · doi:10.1371/journal.pbio.0050013 · Cited by 111
The power of phylogenetic comparison in revealing protein function
Yang, Z. (2005) · Proceedings of the National Academy of Sciences · doi:10.1073/pnas.0500371102 · Cited by 101
Positive selection in the evolution of cancer
Crespi, B. J., & Summers, K. (2006) · Biological reviews/Biological reviews of the Cambridge Philosophical Society · doi:10.1017/s1464793106007056 · Cited by 98
Pervasive Adaptive Evolution among Interactors of the Drosophila Hybrid Inviability Gene, Nup96
Presgraves, D. C., & Stephan, W. (2006) · Molecular Biology and Evolution · doi:10.1093/molbev/msl157 · Cited by 92
Go, Y. (2006) · Molecular Biology and Evolution · doi:10.1093/molbev/msj106 · Cited by 91
Adaptive Evolution of Conserved Noncoding Elements in Mammals
Kim, S. Y., & Pritchard, J. K. (2007) · PLoS Genetics · doi:10.1371/journal.pgen.0030147 · Cited by 87
Hastings, K. E. M. (1996) · Journal of Molecular Evolution · doi:10.1007/bf02338796 · Cited by 86
Spectrum of Mutations in α-Mannosidosis
Berg, T., Stensland, H. M. F. R., Hansen, G. M., Malm, D., Tranebjærg, L., Tollersrud, O. K., & Nilssen, Ø. (1999) · The American Journal of Human Genetics · doi:10.1086/302183 · Cited by 80
The gut–brain peptide neuromedin U is involved in the mammalian circadian oscillator system
Nakahara, K., Hanada, R., Murakami, N., Teranishi, H., Ohgusu, H., Fukushima, N., Moriyama, M., Ida, T., Kangawa, K., & Kojima, M. (2004) · Biochemical and Biophysical Research Communications · doi:10.1016/j.bbrc.2004.04.014 · Cited by 76
Tami, C., Silberstein, E., Manangeeswaran, M., Freeman, G. J., Umetsu, S. E., DeKruyff, R. H., Umetsu, D. T., & Kaplan, G. G. (2007) · Journal of Virology · doi:10.1128/jvi.01585-06 · Cited by 61
Did brain-specific genes evolve faster in humans than in chimpanzees?
SHI, P., Bakewell, M. A., & ZHANG, J. (2006) · Trends in Genetics · doi:10.1016/j.tig.2006.09.001 · Cited by 58
Johnston, J. J., Yang-Feng, T., & Berliner, N. (1992) · Genomics · doi:10.1016/0888-7543(92)90435-u · Cited by 56
Distinct genomic signatures of adaptation in pre- and postnatal environments during human evolution
Uddin, M., Goodman, M., Erez, O., Romero, R. J., Liu, G., Islam, M., Opazo, J. C., Sherwood, C. C., Grossman, L. I., & Wildman, D. E. (2008) · Proceedings of the National Academy of Sciences · doi:10.1073/pnas.0712400105 · Cited by 52
Neuromedin U is involved in nociceptive reflexes and adaptation to environmental stimuli in mice
Nakahara, K., Kojima, M., Hanada, R., Egi, Y., Ida, T., Miyazato, M., Kangawa, K., & Murakami, N. (2004) · Biochemical and Biophysical Research Communications · doi:10.1016/j.bbrc.2004.08.136 · Cited by 49
The evolution and genomic landscape of CGB1 and CGB2 genes
Hallast, P., Rull, K., & Laan, M. (2006) · Molecular and Cellular Endocrinology · doi:10.1016/j.mce.2005.11.049 · Cited by 42
Population Genetics Without Intraspecific Data
Thorne, J. L., Choi, S. C., Yu, J., Higgs, P. G., & Kishino, H. (2007) · Molecular Biology and Evolution · doi:10.1093/molbev/msm085 · Cited by 38
Dadabayev, A. R., Wang, Z.-Q., Zhang, Y., Zhang, J., Robinson, W. R., & Lim, S. H. (2005) · American Journal of Hematology · doi:10.1002/ajh.20415 · Cited by 33
Frost, E. B. (1901) · Science · doi:10.1126/science.13.319.222 · Cited by 23
Research works printed but not linked: 1
- JL Thorne, 2007, Population genetics without intraspecific data., Mol Biol Evol, 24, 1667, 10.1093/molbev/msm085 · DOI
Cited by
Sorted by citations
Detection of nonneutral substitution rates on mammalian phylogenies
Pollard, K. S., Hubisz, M. J., Rosenbloom, K. R., & Siepel, A. (2010) · Genome Research · doi:10.1101/gr.097857.109 · Cited by 2,353
Self-citationThe sequence and de novo assembly of the giant panda genome
Li, R., Fan, W., Tian, G., Zhu, H., He, L., Cai, J., Huang, Q., Cai, Q., Li, B., Bai, Y., et al. (2010) · Nature · doi:10.1038/nature08696 · Cited by 1,180
Self-citationThe evolution of lncRNA repertoires and expression patterns in tetrapods
Necsulea, A., Soumillon, M., Warnefors, M., Liechti, A., Daish, T., Zeller, U., Baker, J. C., Grützner, F., & Kaessmann, H. (2014) · Nature · doi:10.1038/nature12943 · Cited by 984
The yak genome and adaptation to life at high altitude
Qiu, Q., Zhang, G., Ma, T., Qian, W., Wang, J., Ye, Z., Cao, C., Hu, Q., Kim, J., Larkin, D. M., et al. (2012) · Nature Genetics · doi:10.1038/ng.2343 · Cited by 983
Gene expression across mammalian organ development
Cardoso-Moreira, M., Halbert, J., Valloton, D., Velten, B., Chen, C., Shao, Y., Liechti, A., Ascenção, K., Rummel, C., Ovchinnikova, S., et al. (2019) · Nature · doi:10.1038/s41586-019-1338-5 · Cited by 838
Metadata
- Authors
- Kosiol, C., Vinař, T., da Fonseca, R. R., Hubisz, M. J., Bustamante, C. D., Nielsen, R., & Siepel, A.
- Affiliations
- Cornell University (US)
- University of Chicago (US)
- University of Copenhagen (DK)
- Corresponding author
- Siepel, Adam
- Venue
- PLoS Genetics
- Publisher
- Public Library of Science (PLoS)
- Published
- 2008-08-01
- Volume
- 4
- Issue
- 8
- Pages
- e1000144
- ISSN
- 1553-7390 (ISSN-L)
- 1553-7404
- PMC
- PMC2483296
- OpenAlex
- W2154770881
- Cited by
- 576
- References
- 97
- Citations by year
- 2026: 5 · 2025: 15 · 2024: 23 · 2023: 17 · 2022: 19 · 2021: 58 · 2020: 27 · 2019: 27 · 2018: 24 · 2017: 31 · 2016: 25 · 2015: 32 · 2014: 51 · 2013: 55 · 2012: 41
- FWCI
- 23.75
- Type
- journal article
- Language
- en
- Open access
- gold
- doi.org
- Locations
- PLoS Genetics (publishedVersion, cc-by)
- Europe PMC (PubMed Central) (publishedVersion, cc-by)
- PubMed Central (publishedVersion, cc-by)
- PubMed (publishedVersion)
- Cold Spring Harbor Laboratory Institutional Repository (Cold Spring Harbor Laboratory) (acceptedVersion)
- eScholarship (California Digital Library) (submittedVersion, cc-by)
- Knowledge@UChicago (University of Chicago) (submittedVersion, cc-by-nc-nd)
- DOAJ (DOAJ: Directory of Open Access Journals) (submittedVersion, cc-by-sa)
- eScholarship (California Digital Library) (submittedVersion)
- Figshare (submittedVersion, cc-by)
- Research at the University of Copenhagen (University of Copenhagen) (submittedVersion)
- University of Chicago (cc-by)
- Funders
- National Science Foundation (0644111, 0516310)
- Microsoft Research
- National Human Genome Research Institute (R01HG003229)
- Topics
- Life Sciences › Biochemistry, Genetics and Molecular Biology › Genetics › Evolution and Genetic Dynamics
- Life Sciences › Biochemistry, Genetics and Molecular Biology › Molecular Biology › Genomics and Phylogenetic Studies
- Life Sciences › Biochemistry, Genetics and Molecular Biology › Genetics › Genetic diversity and population structure
- Keywords
- positive selection, mammalian evolution, placental mammals, orthologs, lineage-specific selection, immune-related genes, chemosensory perception, reproduction, taste perception, gene coevolution, episodic selection, gene expression, tissue-specific gene expression, spleen, testis, liver, breast
- MeSH terms
- Animals, Bayes Theorem, Pan troglodytes, Dogs, Humans, Macaca mulatta, Mammals, Phylogeny, Primates, Rodentia, Selection, Genetic, Gene Expression, Likelihood Functions, Sequence Alignment, Genome, Evolution, Molecular, Databases, Genetic, Mice, Rats
About these checks
Registry, retraction, Cites and statistics results are computed, not judged, with one exception: a printed reference that no index lists is read once by a model before it counts as a citation error. Claims are extracted by a model and kept only when their quote appears verbatim in the text; each cited source is then checked, with a model’s help, for whether it says what the claim relies on. Those verdicts can be wrong — read the claim’s quote and the cited source before relying on one.
Statistics and arithmetic are recomputed, not judged.
Confidence bands are shown only for fields calibrated on our annotated test set. None is calibrated yet, so no band is shown.
What counts as a claim ›How we measure confidence ›How we check this ›
Are you an author, or do you see a problem with this page? Request a review
