

The DOI matches its Crossref record; 61 of the 63 references it cites were found in a registry or an index.
Mining the Unknown: A Systems Approach to Metabolite Identification Combining Genetic and Metabolic Information
Open accessAbstract
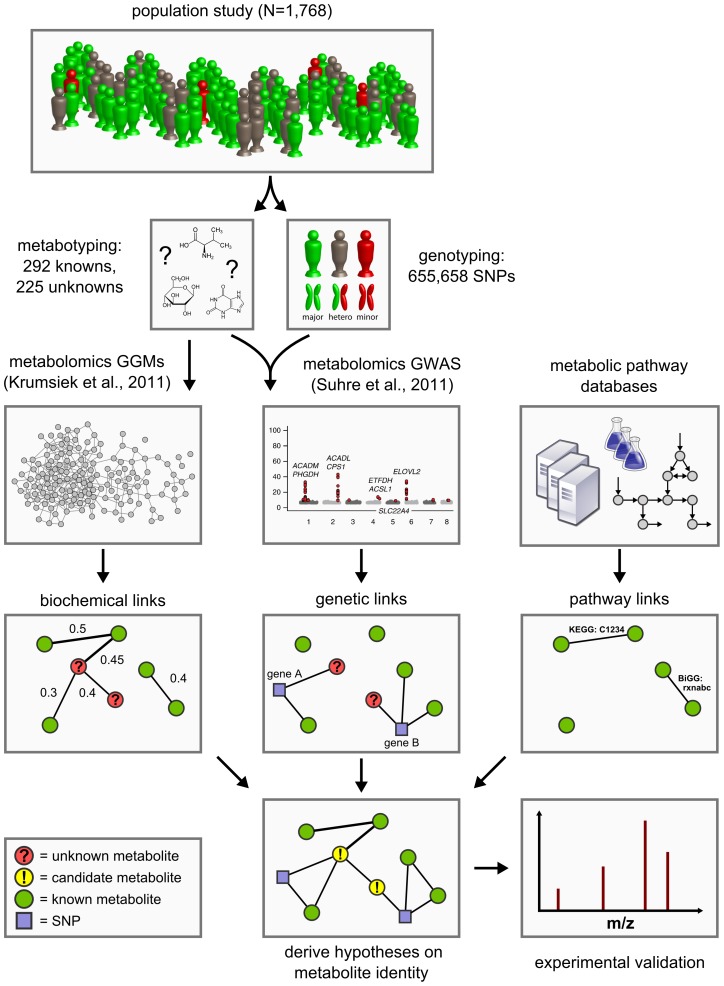
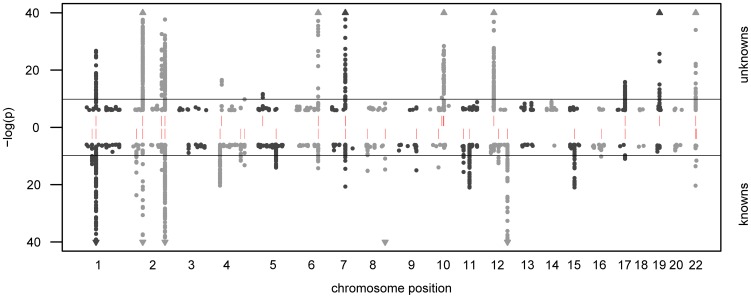
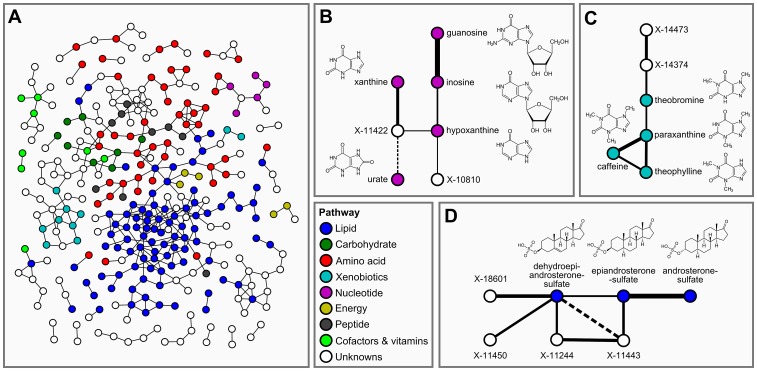
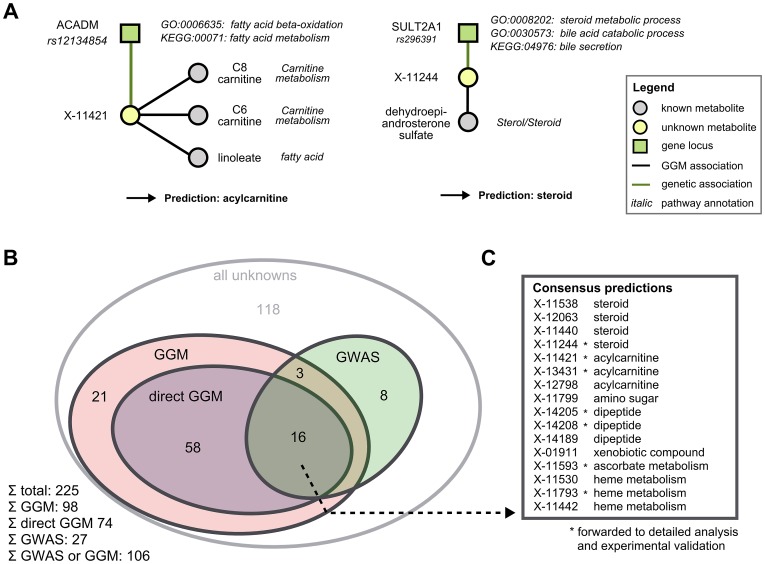
Recent genome-wide association studies (GWAS) with metabolomics data linked genetic variation in the human genome to differences in individual metabolite levels. A strong relevance of this metabolic individuality for biomedical and pharmaceutical research has been reported. However, a considerable amount of the molecules currently quantified by modern metabolomics techniques are chemically unidentified. The identification of these "unknown metabolites" is still a demanding and intricate task, limiting their usability as functional markers of metabolic processes. As a consequence, previous GWAS largely ignored unknown metabolites as metabolic traits for the analysis. Here we present a systems-level approach that combines genome-wide association analysis and Gaussian graphical modeling with metabolomics to predict the identity of the unknown metabolites. We apply our method to original data of 517 metabolic traits, of which 225 are unknowns, and genotyping information on 655,658 genetic variants, measured in 1,768 human blood samples. We report previously undescribed genotype-metabotype associations for six distinct gene loci (SLC22A2, COMT, CYP3A5, CYP2C18, GBA3, UGT3A1) and one locus not related to any known gene (rs12413935). Overlaying the inferred genetic associations, metabolic networks, and knowledge-based pathway information, we derive testable hypotheses on the biochemical identities of 106 unknown metabolites. As a proof of principle, we experimentally confirm nine concrete predictions. We demonstrate the benefit of our method for the functional interpretation of previous metabolomics biomarker studies on liver detoxification, hypertension, and insulin resistance. Our approach is generic in nature and can be directly transferred to metabolomics data from different experimental platforms.
Overview
The claims and statistics of this paper haven’t been checked yet.
Run the check — free, no account needed. It reads the open-access text and checks the sources it cites.
Integrity signals
Registry
Cites
Statistics
Figures
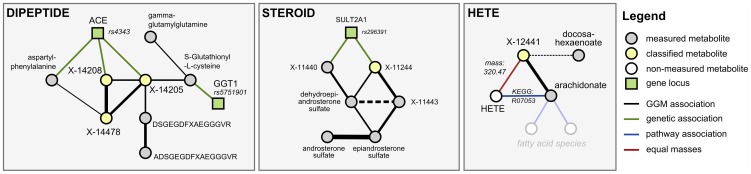
Verification
Claims the paper makes
The claims and statistics of this paper haven’t been checked yet.
Run the check — free, no account needed. It reads the open-access text and checks the sources it cites.
Claims other papers make about this one
Each is checked against this paper’s own text: does it say what the citing paper says it does?
In the citing paper
“In both targeted and untargeted methods, even for confidently identified compounds, the biological processes that generated them are often poorly understood122–125.”
From Measuring biological age using omics data (2022) · cites this paper as [125]
Self-check
Percentages, sums and reported differences re-computed from the paper’s own numbers.
The self-check needs the paper’s full text.
Citations
Cites
Gene Ontology: tool for the unification of biology
Ashburner, M., Ball, C. A., Blake, J. A., Botstein, D., Butler, H., Cherry, J. M., Davis, A. P., Dolinski, K., Dwight, S. S., Eppig, J. T., et al. (2000) · Nature Genetics · doi:10.1038/75556 · Cited by 43,206 · cited 2×
“For each enzyme catalyzing one or more reactions in our pathway model, we retrieved functional annotations from two independent sources: (i) GO-Terms from the Gene Ontology [48] and (ii) enzyme pathway annotations from the KEGG PATHWAY database [47].”
MethodKEGG: Kyoto Encyclopedia of Genes and Genomes
Kanehisa, M. (2000) · Nucleic Acids Research · doi:10.1093/nar/28.1.27 · Cited by 37,077 · cited 2×
“For each enzyme catalyzing one or more reactions in our pathway model, we retrieved functional annotations from two independent sources: (i) GO-Terms from the Gene Ontology [48] and (ii) enzyme pathway annotations from the KEGG PATHWAY database [47].”
MethodPLINK: a tool set for whole-genome association and population-based linkage analyses.
Purcell, S., Neale, B., Todd-Brown, K., Thomas, L., Ferreira, M. A. R., Bender, D., Maller, J., Sklar, P., de Bakker, P. I. W., Daly, M. J., et al. (2007) · The American Journal of Human Genetics · doi:10.1086/519795 · Cited by 34,089 · cited 1×
“06) [41] with age”
KEGG: Kyoto Encyclopedia of Genes and Genomes
Ogata, H., Goto, S., Sato, K., Fujibuchi, W., Bono, H., & Kanehisa, M. (1999) · Nucleic Acids Research · doi:10.1093/nar/27.1.29 · Cited by 31,232
Draper, N. R., & Smith, H. (2005) · Technometrics · doi:10.1198/tech.2005.s303 · Cited by 17,993
mice: Multivariate Imputation by Chained Equations in R
Buuren, S. V., & Groothuis-Oudshoorn, K. (2011) · Journal of Statistical Software · doi:10.18637/jss.v045.i03 · Cited by 13,870
(2010) · University of Twente Research Information · Cited by 6,037
Nist chemistry webbook, nist standard reference database number 69
Linstorm, P. (1998) · Medical Entomology and Zoology · Cited by 4,606
Szklarczyk, D., Franceschini, A., Kuhn, M., Simonovic, M., Roth, A. C., Mínguez, P., Doerks, T., Stark, M., Muller, J., Bork, P., et al. (2010) · Nucleic Acids Research · doi:10.1093/nar/gkq973 · Cited by 3,469 · cited 1×
“This annotation idea parallels classical concepts from functional genomics, where, for instance, co-expression between RNA transcripts is used to predict the function of poorly characterized genes [23,24].”
BackgroundIntegrating common and rare genetic variation in diverse human populations
The International HapMap 3 Consortium (2010) · Nature · doi:10.1038/nature09298 · Cited by 3,026
MassBank: a public repository for sharing mass spectral data for life sciences
Horai, H., Arita, M., Kanaya, S., Nihei, Y., Ikeda, T., Suwa, K., Ojima, Y., Tanaka, K., Tanaka, S., Aoshima, K., et al. (2010) · Journal of Mass Spectrometry · doi:10.1002/jms.1777 · Cited by 2,529 · cited 1×
“Unknowns may constitute previously undocumented small molecules, such as rare xenobiotics or secondary products of metabolism, or they may represent molecules from established pathways which could not be assigned using current libraries of MS fragmentation patterns [6,7] or NMR reference spectra [8].”
BackgroundKováts, E. S. (1958) · Helvetica Chimica Acta · doi:10.1002/hlca.19580410703 · Cited by 2,184 · cited 1×
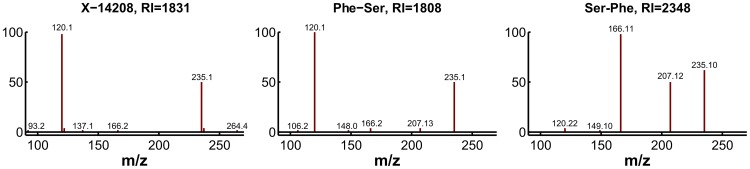
“The retention index [33] and the fragmentation spectrum received for Phe-Ser matched the index and spectrum of X-14208, whereas Ser-Phe produced a clearly”
SLCO1B1 Variants and Statin-Induced Myopathy — A Genomewide Study
(2008) · New England Journal of Medicine · doi:10.1056/nejmoa0801936 · Cited by 2,043
HMDB: a knowledgebase for the human metabolome
Wishart, D. S., Knox, C., Guo, A. C., Eisner, R., Young, N., Gautam, B., Hau, D., Psychogios, N., Dong, E., Bouatra, S., et al. (2008) · Nucleic Acids Research · doi:10.1093/nar/gkn810 · Cited by 1,874 · cited 1×
“Unknowns may constitute previously undocumented small molecules, such as rare xenobiotics or secondary products of metabolism, or they may represent molecules from established pathways which could not be assigned using current libraries of MS fragmentation patterns [6,7] or NMR reference spectra [8].”
BackgroundGlobal reconstruction of the human metabolic network based on genomic and bibliomic data
Duarte, N. C., Becker, S. A., Jamshidi, N., Thiele, I., Mo, M. L., Vo, T. D., Srivas, R., & Palsson, B. Ø. (2007) · Proceedings of the National Academy of Sciences · doi:10.1073/pnas.0610772104 · Cited by 1,374 · cited 1×
“sapiens Recon 1 from the BiGG databases [45], (2) the Edinburgh Human Metabolic Network (EHMN) reconstruction [46] and (3) the KEGG PATHWAY database [47] as of January 2012.”
MethodKind, T., & Fiehn, O. (2007) · BMC Bioinformatics · doi:10.1186/1471-2105-8-105 · Cited by 1,201 · cited 1×
“In mass-spectrometry-based metabolomics approaches, the assignment of chemical identity usually involves the interpretation and comparison of experiment-specific parameters, such as accurate masses, isotope distributions, fragmentation patterns, and chromatography retention times [12–14].”
BackgroundMännistö, P. T., & Kaakkola, S. (1999) · Pharmacological Reviews · doi:10.1016/s0031-6997(24)01423-6 · Cited by 1,068 · cited 1×
“COMT is responsible for the inactivation of catecholamines such as L-dopa and various neuroactive drugs by O-methylation [35].”
BackgroundApplied Regression Analysis, Linear Models, and Related Methods
Gray, J. B., & Fox, J. (1998) · Technometrics · doi:10.2307/1270653 · Cited by 1,049
Human metabolic individuality in biomedical and pharmaceutical research
CARDIoGRAM, Suhre, K., Shin, S.-Y., Petersen, A.-K., Mohney, R. P., Meredith, D., Wägele, B., Altmaier, E., Deloukas, P., Erdmann, J., et al. (2011) · Nature · doi:10.1038/nature10354 · Cited by 1,017 · cited 8×
“We combine high-throughput metabolomics and genotyping data in Gaussian graphical models (GGMs) [21] and in genome-wide association studies (GWAS) [5] in order to produce testable predictions of the unknown metabolites’ identities.”
BackgroundMethodResultInfluentialSelf-citationLinstrom, P. J. (2005) · Medical Entomology and Zoology · Cited by 985
New loci associated with kidney function and chronic kidney disease
Köttgen, A., Pattaro, C., Böger, C. A., Fuchsberger, C., Olden, M., Glazer, N. L., Parsa, A., Gao, X., Yang, Q., Smith, A. V., et al. (2010) · Nature Genetics · doi:10.1038/ng.568 · Cited by 807
Self-citationKORA - A Research Platform for Population Based Health Research
Holle, R., Happich, M., Löwel, H., & Wichmann, H. ‐. (2005) · Das Gesundheitswesen · doi:10.1055/s-2005-858235 · Cited by 753
Genetics meets metabolomics: a genome-wide association study of metabolite profiles in human serum
Gieger, C., Geistlinger, L., Altmaier, E., Hrabé de Angelis, M., Kronenberg, F., Meitinger, T., Mewes, H.-W., Wichmann, H.-E., Weinberger, K. M., Adamski, J., et al. (2008) · PLoS Genetics · doi:10.1371/journal.pgen.1000282 · Cited by 737 · cited 1×
“This locus does not associate with any other metabolite in the present study, but was previously reported to associate with the medium-chain length carnitines C9 and C10:1 [1,2].”
BackgroundSelf-citationGall, W. E., Beebe, K. D., Lawton, K. A., Adam, K., Mitchell, M. W., Nakhle, P. J., Ryals, J. A., Milburn, M. V., Nannipieri, M., Camastra, S., et al. (2010) · PLoS ONE · doi:10.1371/journal.pone.0010883 · Cited by 702 · cited 2×
“[9] reported several known metabolites (most prominently a-hydroxybutyrate) as biomarkers for insulin resistance.”
BackgroundSelf-citationA genome-wide perspective of genetic variation in human metabolism
Illig, T., Gieger, C., Zhai, G., Römisch-Margl, W., Wang-Sattler, R., Prehn, C., Altmaier, E., Kastenmüller, G., Kato, B. S., Mewes, H.-W., et al. (2010) · Nature Genetics · doi:10.1038/ng.507 · Cited by 653 · cited 2×
“This locus does not associate with any other metabolite in the present study, but was previously reported to associate with the medium-chain length carnitines C9 and C10:1 [1,2].”
BackgroundMethodSelf-citationTakeuchi, F., McGinnis, R. E., Bourgeois, S., Barnes, C. P., Eriksson, N., Soranzo, N., Whittaker, P., Ranganath, V., Kumanduri, V., McLaren, W. M., et al. (2009) · PLoS Genetics · doi:10.1371/journal.pgen.1000433 · Cited by 639 · cited 1×
“Interestingly, genetic variants in strong LD with CYP2C18 have been reported to associate with warfarin maintenance dose [27].”
BackgroundAdams, S. H., Hoppel, C. L., Lok, K. H., Zhao, L., Wong, S. W., Minkler, P. E., Hwang, D. H., Newman, J. W., & Garvey, W. T. (2009) · The Journal of Nutrition · doi:10.3945/jn.108.103754 · Cited by 598
Applied Regression Analysis, Linear Models, and Related Methods
Biggerstaff, B. J., & Fox, J. P. (1998) · Journal of the American Statistical Association · doi:10.2307/2669640 · Cited by 484
The Edinburgh human metabolic network reconstruction and its functional analysis
Ma, H., Sorokin, A., Mazein, A., Selkov, A., Selkov, E., Demin, O., & Goryanin, I. (2007) · Molecular Systems Biology · doi:10.1038/msb4100177 · Cited by 435 · cited 1×
“sapiens Recon 1 from the BiGG databases [45], (2) the Edinburgh Human Metabolic Network (EHMN) reconstruction [46] and (3) the KEGG PATHWAY database [47] as of January 2012.”
MethodFiehn, O., Garvey, W. T., Newman, J. W. I., Lok, K. H., Hoppel, C. L., & Adams, S. H. (2010) · PLoS ONE · doi:10.1371/journal.pone.0015234 · Cited by 424 · cited 1×
“This includes studies investigating altered metabolite levels in blood for insulin resistance [9], type 2 diabetes [10], and heart disorders [11].”
BackgroundDiscovery of Sexual Dimorphisms in Metabolic and Genetic Biomarkers
Mittelstraß, K., Ried, J. S., Yu, Z., Krumsiek, J., Gieger, C., Prehn, C. P., Roemisch‐Margl, W., Polonikov, A., Peters, A., Theis, F. J., et al. (2011) · PLoS Genetics · doi:10.1371/journal.pgen.1002215 · Cited by 385 · cited 2×
“Moreover, we found that GGMs, which are based on partial correlation coefficients, can identify biochemically related metabolites from high-throughput metabolomics data alone [21,22].”
BackgroundMethodSelf-citationSIRIUS: decomposing isotope patterns for metabolite identification
Böcker, S., Letzel, M. C., Lipták, Z., & Pervukhin, A. (2008) · Bioinformatics · doi:10.1093/bioinformatics/btn603 · Cited by 352 · cited 1×
“Other authors excluded false candidates for a given unknown by comparing observed and predicted chromatography retention times [16,17], or by the automatic determination of sum formulas from isotope distributions [18].”
BackgroundCreek, D. J., Jankevics, A., Breitling, R., Watson, D. G., Barrett, M. P., & Burgess, K. E. (2011) · Analytical Chemistry · doi:10.1021/ac2021823 · Cited by 349
Ace revisited: A new target for structure-based drug design
Acharya, K. R., Sturrock, E. D., Riordan, J. F., & Ehlers, M. R. (2003) · Nature Reviews Drug Discovery · doi:10.1038/nrd1227 · Cited by 341 · cited 1×
“Moreover, the ACE protein is a target for various pharmaceuticals (ACE inhibitors), especially in the treatment of hypertension [39].”
BackgroundGaussian graphical modeling reconstructs pathway reactions from high-throughput metabolomics data
Krumsiek, J., Suhre, K., Illig, T., Adamski, J., & Theis, F. J. (2011) · BMC Systems Biology · doi:10.1186/1752-0509-5-21 · Cited by 331 · cited 5×
“We combine high-throughput metabolomics and genotyping data in Gaussian graphical models (GGMs) [21] and in genome-wide association studies (GWAS) [5] in order to produce testable predictions of the unknown metabolites’ identities.”
InfluentialSelf-citation[50] γ-Glutamyl transpeptidase from kidney
Tate, S. S., & Meister, A. (1985) · Methods in enzymology on CD-ROM/Methods in enzymology · doi:10.1016/s0076-6879(85)13053-3 · Cited by 286
Advances in metabolite identification
Wishart, D. S. (2011) · Bioanalysis · doi:10.4155/bio.11.155 · Cited by 284 · cited 1×
“In mass-spectrometry-based metabolomics approaches, the assignment of chemical identity usually involves the interpretation and comparison of experiment-specific parameters, such as accurate masses, isotope distributions, fragmentation patterns, and chromatography retention times [12–14].”
BackgroundGenetic loci influencing kidney function and chronic kidney disease
Chambers, J. C., Zhang, W., Lord, G. M., van der Harst, P., Lawlor, D. A., Sehmi, J., Gale, D. P., Wass, M. N., Ahmadi, K. R., Bakker, S. J. L., et al. (2010) · Nature Genetics · doi:10.1038/ng.566 · Cited by 275
A genome-wide association study of metabolic traits in human urine
Suhre, K., Wallaschofski, H., Raffler, J., Friedrich, N., Haring, R., Michael, K., Wasner, C., Krebs, A., Kronenberg, F., Chang, D., et al. (2011) · Nature Genetics · doi:10.1038/ng.837 · Cited by 246 · cited 5×
“Recently, genome-wide association studies (GWAS) on metabolic quantitative traits have proven valuable tools to uncover the genetically determined metabolic individuality in the general population [1–5].”
BackgroundMethodInfluentialSelf-citationGenome-wide association meta-analysis for total serum bilirubin levels
Johnson, A. D., Kavousi, M., Smith, A. V., Chen, M., Dehghan, A., Aspelund, T., Lin, J.-P., van Duijn, C. M., Harris, T. B., Cupples, L. A., et al. (2009) · Human Molecular Genetics · doi:10.1093/hmg/ddp202 · Cited by 235
Dealing with the unknown: Metabolomics and Metabolite Atlases
Bowen, B. P., & Northen, T. R. (2010) · Journal of the American Society for Mass Spectrometry · doi:10.1016/j.jasms.2010.04.003 · Cited by 200 · cited 1×
“In mass-spectrometry-based metabolomics approaches, the assignment of chemical identity usually involves the interpretation and comparison of experiment-specific parameters, such as accurate masses, isotope distributions, fragmentation patterns, and chromatography retention times [12–14].”
BackgroundComputing Fragmentation Trees from Tandem Mass Spectrometry Data
Rasche, F., Svatoš, A., Maddula, R. K., Böttcher, C., & Böcker, S. (2010) · Analytical Chemistry · doi:10.1021/ac101825k · Cited by 159 · cited 2×
“Previously mentioned methods relying on mass-spectra [15] or chromatographic properties [17] are suitable candidates here.”
BackgroundMethodHuman liver dehydroepiandrosterone sulfotransferase: molecular cloning and expression of cDNA.
Otterness, D. M., Wieben, E. D., Wood, T. C., Watson, W. G., Madden, B. J., McCormick, D., & Weinshilboum, R. M. (1992) · Molecular Pharmacology · doi:10.1016/s0026-895x(25)09136-9 · Cited by 157 · cited 1×
“The enzyme encoded by SULT2A1, a bile salt sulfotransferase, converts steroids and bile acids into water-soluble sulfate conjugates for excretion [30].”
BackgroundSLCO1B1 Variants and Statin-Induced Myopathy — A Genomewide Study
Act, A. (2008) · Cited by 142
GAS CHROMATOGRAPHISCHE CHARAKTERISIERUNG ORGANISCHER VERBINDUNGEN
Kováts, E. S. (1958) · Cited by 141
Nicholson, G., Rantalainen, M., Li, J. V., Maher, A. D., Malmodin, D., Ahmadi, K. R., Faber, J. H., Barrett, A., Min, J. L., Rayner, N. W., et al. (2011) · PLoS Genetics · doi:10.1371/journal.pgen.1002270 · Cited by 137 · cited 1×
“[4] applied untargeted nuclear magnetic resonance (NMR) based metabolomics techniques, yielding 59 metabolites that had been identified in the spectra prior to the GWAS and 579 manually selected peaks from the spectra, respectively.”
MethodSelf-citationNayak, R. R., Kearns, M. J., Spielman, R. S., & Cheung, V. G. (2009) · Genome Research · doi:10.1101/gr.097600.109 · Cited by 133
Chung, C.-M., Wang, R.-Y., Chen, J.-W., Fann, C. S. J., Leu, H.-B., Ho, H., Ting, C.-T., Lin, T.-H., Sheu, S. H., Tsai, W.-C., et al. (2010) · The Pharmacogenomics Journal · doi:10.1038/tpj.2009.70 · Cited by 129 · cited 1×
“enzyme (ACE) encoding gene was found to be associated with the activity of the enzyme [28] (See Table 1).”
BackgroundSanna, S., Busonero, F., Maschio, A., McArdle, P. F., Usala, G., Dei, M., Lai, S., Mulas, A., Piras, M. G., Perseu, L., et al. (2009) · Human Molecular Genetics · doi:10.1093/hmg/ddp203 · Cited by 128
Zhai, G., Teumer, A., Stolk, L., Perry, J. R. B., Vandenput, L., Coviello, A. D., Koster, A., Bell, J. T., Bhasin, S., Eriksson, J., et al. (2011) · PLoS Genetics · doi:10.1371/journal.pgen.1002025 · Cited by 107
Weber, R. J. M., & Viant, M. R. (2010) · Chemometrics and Intelligent Laboratory Systems · doi:10.1016/j.chemolab.2010.04.010 · Cited by 94 · cited 1×
“[20] integrated public metabolic pathway information with correlating peak pairs in order to facilitate metabolite identification.”
BackgroundBielinski, S. J., Chai, H. S., Pathak, J., Talwalkar, J. A., Limburg, P. J., Gullerud, R. E., Sicotte, H., Klee, E. W., Ross, J., Kocher, J.-P. A., et al. (2011) · Mayo Clinic Proceedings · doi:10.4065/mcp.2011.0178 · Cited by 70
UGT1A1 is a major locus influencing bilirubin levels in African Americans
Chen, G., Ramos, E., Adeyemo, A., Shriner, D., Zhou, J., Doumatey, A. P., Huang, H., Erdos, M. R., Gerry, N. P., Herbert, A. G., et al. (2011) · European Journal of Human Genetics · doi:10.1038/ejhg.2011.206 · Cited by 69
Metabolomic Differences in Heart Failure Patients With and Without Major Depression
Steffens, D. C., Jiang, W., Krishnan, K. R. R., Karoly, E. D., Mitchell, M. W., O'Connor, C. M., & Kaddurah-Daouk, R. (2010) · Journal of Geriatric Psychiatry and Neurology · doi:10.1177/0891988709358592 · Cited by 68 · cited 2×
“[11] reported a connection between heart failure and X11805, which is in close proximity to angiontensin-related peptides in the GGM.”
BackgroundSelf-citationACE Inhibition and Bradykinin-Mediated Renal Vascular Responses
Imig, J. D. (2004) · Hypertension · doi:10.1161/01.hyp.0000118054.86193.ce · Cited by 49 · cited 1×
“The protein encoded by the ACE locus, angiotensinconverting enzyme, is an exopeptidase which cleaves dipeptides from vasoactive oligopeptides, and plays a central role in the blood pressure-controlling renin-angiotensin system [38].”
BackgroundMihaleva, V. V., Verhoeven, H. A., de Vos, R. C. H., Hall, R. D., & van Ham, R. C. H. J. (2009) · Bioinformatics · doi:10.1093/bioinformatics/btp056 · Cited by 41
Köttgen, A., Pattaro, C., Böger, C. A., Fuchsberger, C., Olden, M., Glazer, N. L., Parsa, A., Gao, X., Yang, Q., Chen, M., et al. (2010) · Das Gesundheitswesen · doi:10.1055/s-0030-1266452 · Cited by 32
Assignment of MS-based metabolomic datasets via compound interaction pair mapping
Gipson, G. T., Tatsuoka, K. S., Sokhansanj, B. A., Ball, R. J., & Connor, S. C. (2007) · Metabolomics · doi:10.1007/s11306-007-0096-9 · Cited by 24 · cited 1×
“[19] and Weber et al.”
Butterworth, M., Lau, S. S., & Monks, T. J. (1996) · PubMed · Cited by 18
Jylhävä, J., Lyytikäinen, L., Kähönen, M. A. P., Hutri‐Kähönen, N., Kettunen, J., Viikari, J. S. A., Raitakari, O. T., Lehtimäki, T. J., & Hurme, M. (2012) · PLoS ONE · doi:10.1371/journal.pone.0035426 · Cited by 16
Bowers-Komro, D. M., Db, M., King, G. A., Sweeny, J. G., & Ga, I. (1982) · PubMed · Cited by 8
Cited by
Sorted by citations
An atlas of genetic influences on human blood metabolites
The Multiple Tissue Human Expression Resource (MuTHER) Consortium, Shin, S.-Y., Fauman, E. B., Petersen, A.-K., Krumsiek, J., Santos, R., Huang, J., Arnold, M., Erte, I., Forgetta, V., et al. (2014) · Nature Genetics · doi:10.1038/ng.2982 · Cited by 1,515
“58 Pantothenate and CoA (1) 56 Hemoglobin and porphyrin (5) 55 Tocopherol (2) 53 Fibrinogen cleavage peptide (3) 52 Dipeptide (9) 49 Polyamine metabolism (1) 48 Amino fatty acid (1) 47 Guanidino and acetamido (1) 45 Tryptophan (10) 44 Glutathione (2) 42 Branched-chain amino acid (14) 41 Butanoate (3) 37 Glutamate (3)…”
Self-citationAnalytical Methods in Untargeted Metabolomics: State of the Art in 2015
Alonso, A., Marsal, S., & Julià, A. (2015) · Frontiers in Bioengineering and Biotechnology · doi:10.3389/fbioe.2015.00023 · Cited by 727
“One of these methods, Gaussian Graphical Modeling (GGM), has been recently used to identify unknown metabolites through the integration of metabolomics, GWAS, and pathway data (Krumsiek et al., 2012).”
Measuring biological age using omics data
Rutledge, J., Oh, H., & Wyss-Coray, T. (2022) · Nature Reviews Genetics · doi:10.1038/s41576-022-00511-7 · Cited by 570
“In both targeted and untargeted methods, even for confidently identified compounds, the biological processes that generated them are often poorly understood 122–125 .”
BackgroundMetabolic network failures in Alzheimer's disease: A biochemical road map
Toledo, J. B., Arnold, M., Kastenmüller, G., Chang, R. R., Baillie, R., Han, X., Thambisetty, M., Tenenbaum, J. D., Suhre, K., Thompson, J. W., et al. (2017) · Alzheimer s & Dementia · doi:10.1016/j.jalz.2017.01.020 · Cited by 463
“The partial correlation networks established direct connections between the measured metabolites, which have been shown to depict direct biochemical relationships between metabolites while omitting mediated correlations [55,57].”
BackgroundSelf-citationWhole-genome sequencing identifies common-to-rare variants associated with human blood metabolites
Long, T., Hicks, M. A., Yu, H., Biggs, W., Kirkness, E. F., Menni, C., Zierer, J., Small, K. S., Mangino, M., Messier, H., et al. (2017) · Nature Genetics · doi:10.1038/ng.3809 · Cited by 423
Self-citation
Metadata
- Authors
- Krumsiek, J., Suhre, K., Evans, A. M., Mitchell, M. W., Mohney, R. P., Milburn, M. V., Wägele, B., Römisch-Margl, W., Illig, T., Adamski, J., Gieger, C., Theis, F. J., & Kastenmüller, G.
- Affiliations
- Helmholtz Munich (DE)
- Metabolon (United States) (US)
- Corresponding author
- Kastenmüller, Gabi
- ORCID
- Venue
- PLoS Genetics
- Publisher
- Public Library of Science (PLoS)
- Published
- 2012-10-18
- Volume
- 8
- Issue
- 10
- Pages
- e1003005
- ISSN
- 1553-7390 (ISSN-L)
- 1553-7404
- PMC
- PMC3475673
- OpenAlex
- W2080426060
- Cited by
- 197
- References
- 63
- Citations by year
- 2026: 9 · 2025: 15 · 2024: 19 · 2023: 8 · 2022: 15 · 2021: 16 · 2020: 16 · 2019: 9 · 2018: 16 · 2017: 18 · 2016: 14 · 2015: 16 · 2014: 17 · 2013: 6 · 2012: 3
- FWCI
- 5.40
- Type
- journal article
- Language
- en
- Open access
- gold
- doi.org
- Locations
- PLoS Genetics (publishedVersion, cc-by)
- Europe PMC (PubMed Central) (publishedVersion, cc-by)
- PubMed Central (publishedVersion, cc-by)
- PubMed (publishedVersion)
- DOAJ (DOAJ: Directory of Open Access Journals) (submittedVersion, cc-by-sa)
- Figshare (submittedVersion, cc-by)
- Site cant be reached (submittedVersion, cc-by)
- Funders
- Qatar Foundation
- Bundesministerium für Bildung und Forschung (0315494A, 03IS2061B)
- Studienstiftung des Deutschen Volkes
- Topics
- Life Sciences › Biochemistry, Genetics and Molecular Biology › Molecular Biology › Metabolomics and Mass Spectrometry Studies
- Life Sciences › Biochemistry, Genetics and Molecular Biology › Molecular Biology › Bioinformatics and Genomic Networks
- Life Sciences › Biochemistry, Genetics and Molecular Biology › Genetics › Genetic Associations and Epidemiology
- Keywords
- genome-wide association study, metabolic networks, SLC22A2, catechol-O-methyltransferase, CYP3A5, CYP2C18, liver detoxification, hypertension, insulin resistance, blood metabolites, systems biology
- MeSH terms
- Humans, Reproducibility of Results, Models, Statistical, Signal Transduction, Computational Biology, Polymorphism, Single Nucleotide, Genomics, Genome-Wide Association Study, Metabolomics, Metabolome, Data Mining
About these checks
Registry, retraction, Cites and statistics results are computed, not judged, with one exception: a printed reference that no index lists is read once by a model before it counts as a citation error. Claims are extracted by a model and kept only when their quote appears verbatim in the text; each cited source is then checked, with a model’s help, for whether it says what the claim relies on. Those verdicts can be wrong — read the claim’s quote and the cited source before relying on one.
Statistics and arithmetic are recomputed, not judged.
Confidence bands are shown only for fields calibrated on our annotated test set. None is calibrated yet, so no band is shown.
What counts as a claim ›How we measure confidence ›How we check this ›
Are you an author, or do you see a problem with this page? Request a review
