

The DOI matches its Crossref record; 33 of the 33 references it cites were found in a registry or an index.
Projections of Global Mortality and Burden of Disease from 2002 to 2030
Open accessAbstract
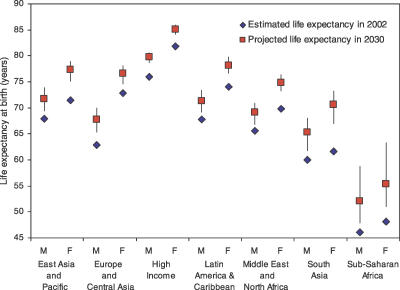
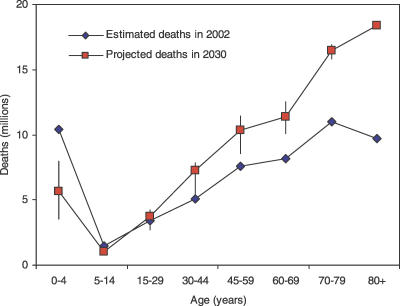
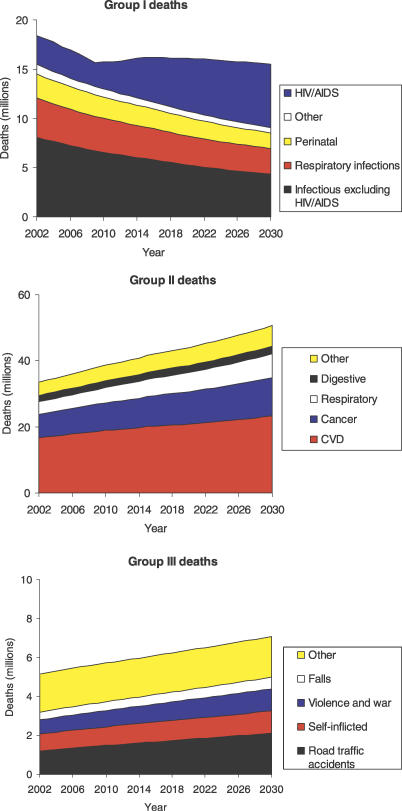
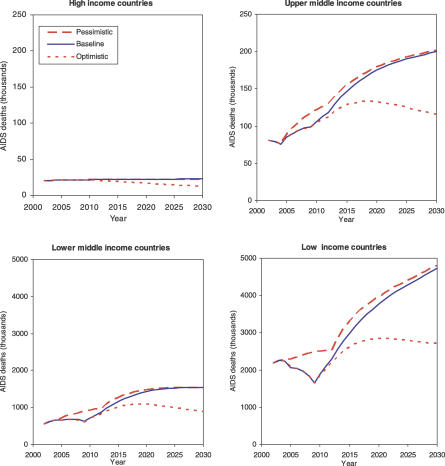
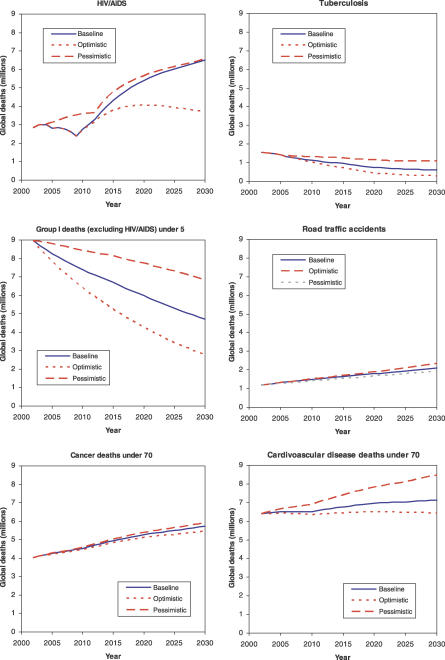
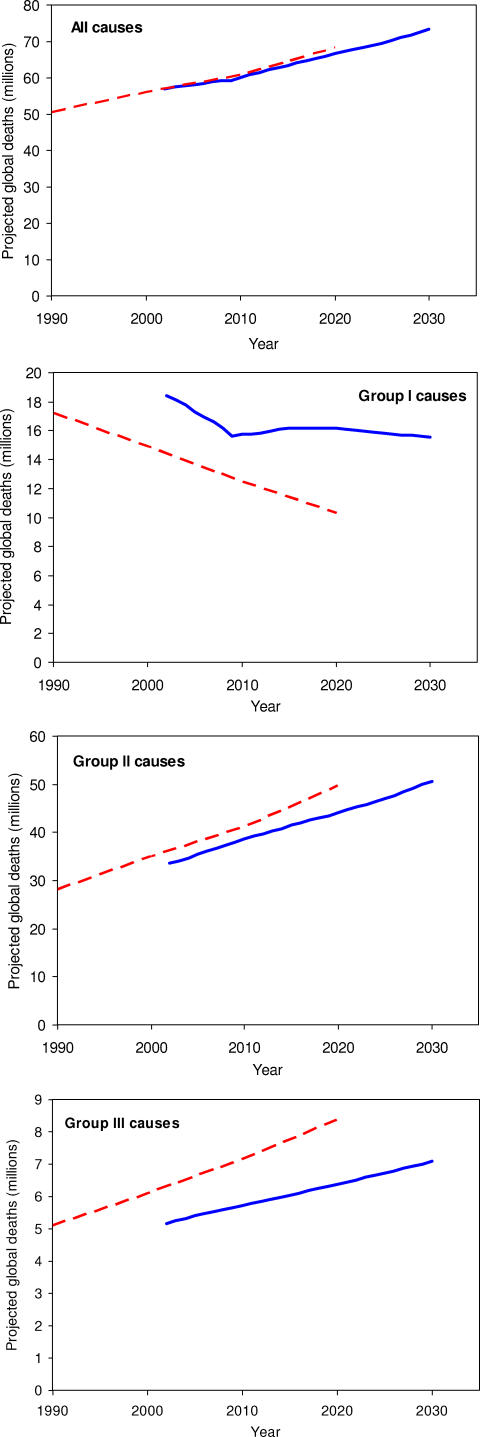
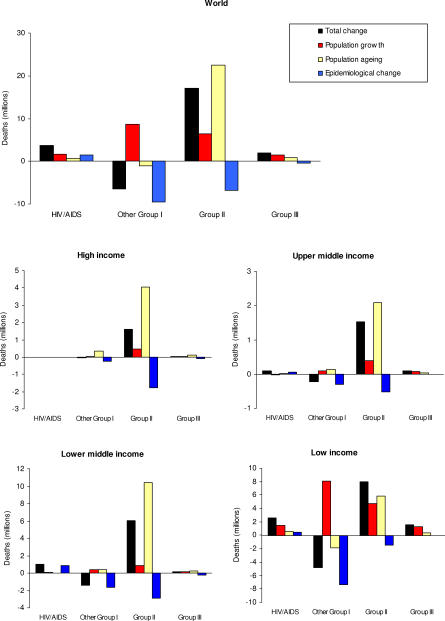
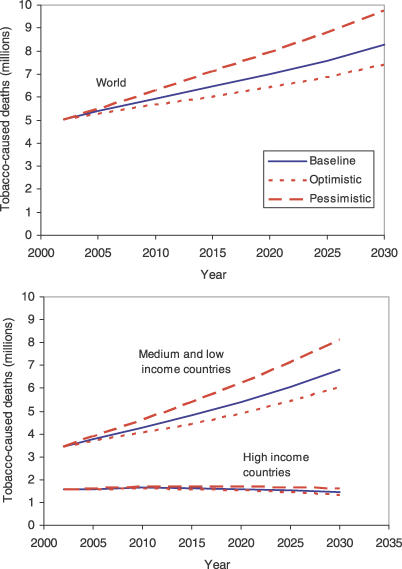
BACKGROUND: Global and regional projections of mortality and burden of disease by cause for the years 2000, 2010, and 2030 were published by Murray and Lopez in 1996 as part of the Global Burden of Disease project. These projections, which are based on 1990 data, continue to be widely quoted, although they are substantially outdated; in particular, they substantially underestimated the spread of HIV/AIDS. To address the widespread demand for information on likely future trends in global health, and thereby to support international health policy and priority setting, we have prepared new projections of mortality and burden of disease to 2030 starting from World Health Organization estimates of mortality and burden of disease for 2002. This paper describes the methods, assumptions, input data, and results. METHODS AND FINDINGS: Relatively simple models were used to project future health trends under three scenarios-baseline, optimistic, and pessimistic-based largely on projections of economic and social development, and using the historically observed relationships of these with cause-specific mortality rates. Data inputs have been updated to take account of the greater availability of death registration data and the latest available projections for HIV/AIDS, income, human capital, tobacco smoking, body mass index, and other inputs. In all three scenarios there is a dramatic shift in the distribution of deaths from younger to older ages and from communicable, maternal, perinatal, and nutritional causes to noncommunicable disease causes. The risk of death for children younger than 5 y is projected to fall by nearly 50% in the baseline scenario between 2002 and 2030. The proportion of deaths due to noncommunicable disease is projected to rise from 59% in 2002 to 69% in 2030. Global HIV/AIDS deaths are projected to rise from 2.8 million in 2002 to 6.5 million in 2030 under the baseline scenario, which assumes coverage with antiretroviral drugs reaches 80% by 2012. Under the optimistic scenario, which also assumes increased prevention activity, HIV/AIDS deaths are projected to drop to 3.7 million in 2030. Total tobacco-attributable deaths are projected to rise from 5.4 million in 2005 to 6.4 million in 2015 and 8.3 million in 2030 under our baseline scenario. Tobacco is projected to kill 50% more people in 2015 than HIV/AIDS, and to be responsible for 10% of all deaths globally. The three leading causes of burden of disease in 2030 are projected to include HIV/AIDS, unipolar depressive disorders, and ischaemic heart disease in the baseline and pessimistic scenarios. Road traffic accidents are the fourth leading cause in the baseline scenario, and the third leading cause ahead of ischaemic heart disease in the optimistic scenario. Under the baseline scenario, HIV/AIDS becomes the leading cause of burden of disease in middle- and low-income countries by 2015. CONCLUSIONS: These projections represent a set of three visions of the future for population health, based on certain explicit assumptions. Despite the wide uncertainty ranges around future projections, they enable us to appreciate better the implications for health and health policy of currently observed trends, and the likely impact of fairly certain future trends, such as the ageing of the population, the continued spread of HIV/AIDS in many regions, and the continuation of the epidemiological transition in developing countries. The results depend strongly on the assumption that future mortality trends in poor countries will have a relationship to economic and social development similar to those that have occurred in the higher-income countries.
Overview
The claims and statistics of this paper haven’t been checked yet.
Run the check — free, no account needed. It reads the open-access text and checks the sources it cites.
Integrity signals
Registry
Cites
Statistics
Figures
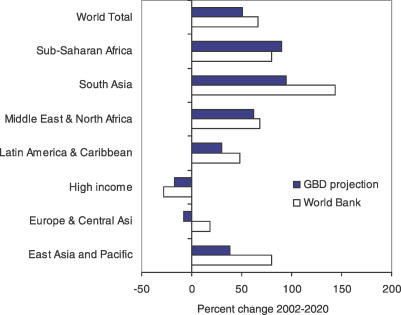
Verification
Claims the paper makes
The claims and statistics of this paper haven’t been checked yet.
Run the check — free, no account needed. It reads the open-access text and checks the sources it cites.
Claims other papers make about this one
Each is checked against this paper’s own text: does it say what the citing paper says it does?
In the citing paper
“The global burdens of cardiovascular diseases (CVD), type 2 diabetes mellitus (DM), and obesity are rising, producing enormous losses of life and disability-adjusted life-years in both developed and developing nations.1”
From Components of a Cardioprotective Diet: New Insights (2011) · cites this paper as [1]
In the citing paper
“Cardiovascular diseases (CVD), type 2 diabetes mellitus, and adiposity produce tremendous burdens of deaths, lost quality of life, and economic disruption globally.1,2”
From Population Approaches to Improve Diet, Physical Activity, and Smoking Habits: A Scientific Statement From the American Heart Association (2012) · cites this paper as [1]
Self-check
Percentages, sums and reported differences re-computed from the paper’s own numbers.
The self-check needs the paper’s full text.
Citations
Cites
Wild, S., Roglic, G., Green, A., Sicree, R., & King, H. (2004) · Diabetes Care · doi:10.2337/diacare.27.5.1047 · Cited by 15,297
Murray, C. J. L., & López, A. D. (1997) · The Lancet · doi:10.1016/s0140-6736(96)07492-2 · Cited by 7,007
(1996) · Cited by 6,884
Lopez, A. D., Mathers, C. D., Ezzati, M., Jamison, D. T., & Murray, C. J. (2006) · The Lancet · doi:10.1016/s0140-6736(06)68770-9 · Cited by 5,630
Self-citationEzzati, M., López, A. D., Rodgers, A., & Murray, C. J. L. (2004) · Cited by 3,319
Global Burden of Disease and Risk Factors
López, A. D., Mathers, C. D., Ezzati, M., Jamison, D. T. T., & Murray, C. J. L. (2006) · World Bank, Washington, DC eBooks · doi:10.1596/978-0-8213-6262-4 · Cited by 2,714
Self-citationModeling and Forecasting U. S. Mortality
Lee, R. D., & Carter, L. R. (1992) · Journal of the American Statistical Association · doi:10.1080/01621459.1992.10475265 · Cited by 2,348
(2005) · Europe PMC (PubMed Central) · Cited by 1,975
Self-citationThe Atlas of Heart Disease and Stroke
Mackay, J., Mensah, G. A., & Mendis, S. (2004) · Medical Entomology and Zoology · Cited by 1,550
Mortality from tobacco in developed countries: indirect estimation from national vital statistics.
Peto, R., Boreham, J., Lopez, A. D., Thun, M., & Heath, C. (1992) · The Lancet · doi:10.1016/0140-6736(92)91600-d · Cited by 1,394
Research works printed but not linked: 23
- Murray, 1996, The global burden of disease, 325
- Murray, 1997, Lancet, 349, 1498
- Lee, 1992, J Am Stat Assoc, 87, 659
- Lee, 2000, NAAJ, 4, 80
- Weinstein, 1987, Am J Public Health, 77, 1417
- Wolfson, 1994, World Health Stat Q, 47, 157
- Bronnum-Hansen, 1999, J Epidemiol Community Health, 53, 300
- Stover, 2002, Lancet, 360, 73
- Salomon, 2002, Popul Dev Rev, 28, 205
- Lopez, 2006, Lancet, 367, 1747
- Peto, 1992, Lancet, 339, 1268
- Mathers, 2005, Bull World Health Organ, 83, 171
- Barro, 1996, Am Econ Rev, 86, 218
- Ezzati, 2004, Comparative quantification of health risks: Global and regional burden of disease attributable to selected major risk factors, 959
- Ezzati, 2003, Tob Control, 12, 79
- Shibuya, 2005, Int J Cancer, 117, 476
- Walker, 2003, AIDS, 17, 2215
- Salomon, 2005, PLoS Med, 2, e16
- Bray, 2006, Nat Rev Cancer, 6, 63
- Wild, 2004, Diabetes Care, 27, 1047
- Ohinmaa, 2004, Can J Diabetes, 28, 1
- Boyle, 2001, Diabetes Care, 24, 1936
- Peto, 1996, Br Med Bull, 52, 12
Cited by
Sorted by citations
Vestbo, J., Hurd, S. S., Agustí, A. G., Jones, P. W., Vogelmeier, C., Anzueto, A., Barnes, P. J., Fabbri, L. M., Martinez, F. J., Nishimura, M., et al. (2013) · American Journal of Respiratory and Critical Care Medicine · doi:10.1164/rccm.201204-0596pp · Cited by 15,983
Zhang, Q., Wang, C., Zheng, M., Li, Y., Li, J., Zhang, L., Shang, X., & Yan, C. (2014) · Cerebrovascular Diseases · doi:10.1159/000369778 · Cited by 11,609
Inflammatory responses and inflammation-associated diseases in organs
Chen, L., Deng, H., Cui, H., Fang, J. S., Zuo, Z., Deng, J., Li, Y., Wang, X., & Zhao, L. (2017) · Oncotarget · doi:10.18632/oncotarget.23208 · Cited by 5,541
Higgins, S. M. F., Macken, A. P., Cullen, W., Saunders, J., Dunne, C. P., & O’Gorman, C. S. (2013) · PubMed · doi:10.34961/9953 · Cited by 4,807
Overweight, Obesity, and Depression: A Systematic Review and Meta-analysis of Longitudinal Studies
Luppino, F. S., de Wit, L. M., Bouvy, P. F., Stijnen, T., Cuijpers, P., Penninx, B. W. J. H., & Zitman, F. G. (2010) · Archives of General Psychiatry · doi:10.1001/archgenpsychiatry.2010.2 · Cited by 4,322
No health without mental health
Prince, M. J., Patel, V., Saxena, S., Maj, M., Maselko, J., Phillips, M. R., & Rahman, A. (2007) · The Lancet · doi:10.1016/s0140-6736(07)61238-0 · Cited by 4,028
Global Initiative for Chronic Obstructive Lung Disease (GOLD)
Rahman, M. M., & Siddiqui, M. M. R. (2017) · Anwer Khan Modern Medical College Journal · doi:10.3329/akmmcj.v7i1.31596 · Cited by 3,105
Foreman, K. J., Marquez, N., Dolgert, A. J., Fukutaki, K. G., Fullman, N., McGaughey, M., Pletcher, M. A., Smith, A. E., Tang, K., Yuan, C.-W., et al. (2018) · The Lancet · doi:10.1016/s0140-6736(18)31694-5 · Cited by 3,154
Nock, M. K., Borges, G., Bromet, E. J., Cha, C. B., Kessler, R. C., & Lee, S. (2008) · Epidemiologic Reviews · doi:10.1093/epirev/mxn002 · Cited by 2,897
Worldwide prevalence of anaemia, WHO Vitamin and Mineral Nutrition Information System, 1993–2005
McLean, E., Cogswell, M., Egli, I., Wojdyla, D., & de Benoist, B. (2009) · Public Health Nutrition · doi:10.1017/s1368980008002401 · Cited by 2,734
Adolescence: A foundation for future health
Sawyer, S. M., Afifi, R. A., Bearinger, L. H., Blakemore, S.-J., Dick, B., Ezeh, A. C., & Patton, G. C. (2012) · The Lancet · doi:10.1016/s0140-6736(12)60072-5 · Cited by 2,635
An estimation of the global volume of surgery: a modelling strategy based on available data
Weiser, T. G., Regenbogen, S. E., Thompson, K. D., Haynes, A. B., Lipsitz, S. R., Berry, W. R., & Gawande, A. A. (2008) · The Lancet · doi:10.1016/s0140-6736(08)60878-8 · Cited by 2,579
Global burden of disease in young people aged 10–24 years: a systematic analysis
Gore, F. M., Bloem, P. J., Patton, G. C., Ferguson, J., Joseph, V., Coffey, C., Sawyer, S. M., & Mathers, C. D. (2011) · The Lancet · doi:10.1016/s0140-6736(11)60512-6 · Cited by 2,301
Self-citationThe burden of disease in older people and implications for health policy and practice
Prince, M. J., Wu, F., Guo, Y., Gutiérrez‐Robledo, L. M., O'Donnell, M. J., Sullivan, R. J., & Yusuf, S. (2014) · The Lancet · doi:10.1016/s0140-6736(14)61347-7 · Cited by 2,473
The burden and costs of chronic diseases in low-income and middle-income countries.
Abegunde, D. O., Mathers, C. D., Adam, T., Ortegon, M., & Strong, K. (2007) · The Lancet · doi:10.1016/s0140-6736(07)61696-1 · Cited by 1,603
Self-citationA Common Allele on Chromosome 9 Associated with Coronary Heart Disease
McPherson, R., Pertsemlidis, A., Kavaslar, N., Stewart, A., Roberts, R., Cox, D. R., Hinds, D. A., Pennacchio, L. A., Tybjaerg-Hansen, A., Folsom, A. R., et al. (2007) · Science · doi:10.1126/science.1142447 · Cited by 1,587
Preventing stroke: saving lives around the world
Strong, K., Mathers, C. D., & Bonita, R. (2007) · The Lancet Neurology · doi:10.1016/s1474-4422(07)70031-5 · Cited by 1,535
Self-citationSimultaneously Mitigating Near-Term Climate Change and Improving Human Health and Food Security
Shindell, D., Kuylenstierna, J. C. I., Vignati, E., van Dingenen, R., Amann, M., Klimont, Z., Anenberg, S. C., Muller, N., Janssens-Maenhout, G., Raes, F., et al. (2012) · Science · doi:10.1126/science.1210026 · Cited by 1,382
Rajpurkar, P., Irvin, J., Ball, R. L., Zhu, K., Yang, B., Mehta, H., Duan, T., Ding, D., Bagul, A., Langlotz, C. P., et al. (2018) · PLOS Medicine · doi:10.1371/journal.pmed.1002686 · Cited by 1,449
Barriers to mental health treatment: results from the WHO World Mental Health surveys
Andrade, L. H., Alonso, J., Mneimneh, Z., Wells, J. E., Al-Hamzawi, A., Borges, G., Bromet, E., Bruffaerts, R., de Girolamo, G., de Graaf, R., et al. (2014) · Psychological Medicine · doi:10.1017/s0033291713001943 · Cited by 1,289
(2012) · Choice Reviews Online · doi:10.5860/choice.49-6620 · Cited by 1,284
Chronic obstructive pulmonary disease
Christenson, S. A., Smith, B. M., Bafadhel, M., & Putcha, N. (2022) · The Lancet · doi:10.1016/s0140-6736(22)00470-6 · Cited by 1,292
Future life expectancy in 35 industrialised countries: projections with a Bayesian model ensemble
Kontis, V., Bennett, J. E., Mathers, C. D., Li, G., Foreman, K. J., & Ezzati, M. (2017) · The Lancet · doi:10.1016/s0140-6736(16)32381-9 · Cited by 1,256
Self-citationThe relation between different dimensions of alcohol consumption and burden of disease: an overview
Rehm, J., Baliunas, D., Borges, G. L. G., Graham, K., Irving, H., Kehoe, T., Parry, C. D., Patra, J., Popova, S., Poznyak, V., et al. (2010) · Addiction · doi:10.1111/j.1360-0443.2010.02899.x · Cited by 1,174
Lin, L. Y., Sidani, J. E., Shensa, A., Radovic, A., Miller, E., Colditz, J. B., Hoffman, B. L., Giles, L. M., & Primack, B. A. (2016) · Depression and Anxiety · doi:10.1002/da.22466 · Cited by 1,111
Public health benefits of strategies to reduce greenhouse-gas emissions: urban land transport
Woodcock, J., Edwards, P., Tonne, C., Armstrong, B. G., Ashiru, O., Banister, D., Beevers, S., Chalabi, Z., Chowdhury, Z., Cohen, A., et al. (2009) · The Lancet · doi:10.1016/s0140-6736(09)61714-1 · Cited by 1,129
Mathers, C. D. (2008) · Elsevier eBooks · doi:10.1016/b978-012373960-5.00335-x · Cited by 1,125
Self-citationPoint-of-Care Diagnostics for Global Health
Yager, P., Domingo, G. J., & Gerdes, J. (2008) · Annual Review of Biomedical Engineering · doi:10.1146/annurev.bioeng.10.061807.160524 · Cited by 1,076
Collaborative care for depression and anxiety problems
Archer, J., Bower, P., Gilbody, S., Lovell, K., Richards, D., Gask, L., Dickens, C., & Coventry, P. (2012) · Cochrane Database of Systematic Reviews · doi:10.1002/14651858.cd006525.pub2 · Cited by 1,126
Climate change and mental health: a causal pathways framework
Berry, H. L., Bowen, K., & Kjellstrom, T. (2010) · International Journal of Public Health · doi:10.1007/s00038-009-0112-0 · Cited by 1,035
Heterogeneity and changes in preferences for dying at home: a systematic review
Gomes, B., Calanzani, N., Gysels, M., HALL, S. L., & Higginson, I. J. (2013) · BMC Palliative Care · doi:10.1186/1472-684x-12-7 · Cited by 1,034
Depression sum-scores don’t add up: why analyzing specific depression symptoms is essential
Fried, E. I., & Nesse, R. M. (2015) · BMC Medicine · doi:10.1186/s12916-015-0325-4 · Cited by 981
Vollset, S. E., Ababneh, H., Abate, Y. H., Abbafati, C., Abbasgholizadeh, R., Abbasian, M., Abbastabar, H., Magied, A. H. A. A. A., ElHafeez, S. A., Abdelkader, A. F. I., et al. (2024) · The Lancet · doi:10.1016/s0140-6736(24)00685-8 · Cited by 1,152
Mortality in COPD: role of comorbidities
Sin, D. D., Anthonisen, N. R., Soriano, J. B., & Agusti, A. G. (2006) · European Respiratory Journal · doi:10.1183/09031936.00133805 · Cited by 1,052
A review of depression and suicide risk assessment using speech analysis
Cummins, N., Scherer, S. J., Krajewski, J., Schnieder, S., Epps, J., & Quatieri, T. F. (2015) · Speech Communication · doi:10.1016/j.specom.2015.03.004 · Cited by 1,051
Addressing Global Mortality from Ambient PM2.5
Apte, J. S., Marshall, J. D., Cohen, A. J., & Brauer, M. (2015) · Environmental Science & Technology · doi:10.1021/acs.est.5b01236 · Cited by 995
Johnston, S. C., Mendis, S., & Mathers, C. D. (2009) · The Lancet Neurology · doi:10.1016/s1474-4422(09)70023-7 · Cited by 977
Self-citationDalgard, F. J., Gieler, U., Tomas-Aragones, L., Lien, L., Poot, F., Jemec, G. B. E., Misery, L., Szabo, C., Linder, D., Sampogna, F., et al. (2015) · Journal of Investigative Dermatology · doi:10.1038/jid.2014.530 · Cited by 968
López-Campos, J. L., Tan, W. C., & Soriano, J. B. (2015) · Respirology · doi:10.1111/resp.12660 · Cited by 980
Lithium in the prevention of suicide in mood disorders: updated systematic review and meta-analysis
Cipriani, A., Hawton, K., Stockton, S., & Geddes, J. R. (2013) · BMJ · doi:10.1136/bmj.f3646 · Cited by 920
Nogal, A., Valdes, A. M., & Menni, C. (2021) · Gut Microbes · doi:10.1080/19490976.2021.1897212 · Cited by 917
Jernberg, T., Hasvold, P., Henriksson, M., Hjelm, H., Thuresson, M., & Janzon, M. (2015) · European Heart Journal · doi:10.1093/eurheartj/ehu505 · Cited by 875
Cross-Species Virus Transmission and the Emergence of New Epidemic Diseases
Parrish, C. R., Holmes, E. C., Morens, D. M., Park, E.-C., Burke, D. S., Calisher, C. H., Laughlin, C. A., Saif, L. J., & Daszak, P. (2008) · Microbiology and Molecular Biology Reviews · doi:10.1128/mmbr.00004-08 · Cited by 834
Galletly, C., Castle, D., Dark, F., Humberstone, V., Jablensky, A., Killackey, E., Kulkarni, J., McGorry, P., Nielssen, O., & Tran, N. (2016) · Australian & New Zealand Journal of Psychiatry · doi:10.1177/0004867416641195 · Cited by 877
Tobacco smoking leads to extensive genome-wide changes in DNA methylation
Zeilinger, S., Kühnel, B., Klopp, N., Baurecht, H., Kleinschmidt, A., Gieger, C., Weidinger, S., Lattka, E., Adamski, J., Peters, A., et al. (2013) · PLoS ONE · doi:10.1371/journal.pone.0063812 · Cited by 824
Song, P., Fang, Z. A., Wang, H., Cai, Y. S., Rahimi, K., Zhu, Y., Fowkes, F. G. R., Fowkes, F. J. I., & Rudan, I. (2020) · The Lancet Global Health · doi:10.1016/s2214-109x(20)30117-0 · Cited by 880
Mental Health Service Provision in Low- and Middle-Income Countries
Rathod, S., Pinninti, N., Irfan, M., Gorczynski, P., Rathod, P., Gega, L., & Naeem, F. (2017) · Health Services Insights · doi:10.1177/1178632917694350 · Cited by 866
Sleeman, K. E., de Brito, M. F., Etkind, S. N., Nkhoma, K. B., Guo, P., Higginson, I. J., Gomes, B., & Harding, R. (2019) · The Lancet Global Health · doi:10.1016/s2214-109x(19)30172-x · Cited by 875
Penninx, B. W., Milaneschi, Y., Lamers, F., & Vogelzangs, N. (2013) · BMC Medicine · doi:10.1186/1741-7015-11-129 · Cited by 839
Wafa, H. A., Wolfe, C. D. A., Emmett, E. S., Roth, G. A., Johnson, C. O., & Wang, Y. (2020) · Stroke · doi:10.1161/strokeaha.120.029606 · Cited by 896
The International Epidemiology of Lung Cancer: Geographical Distribution and Secular Trends
Youlden, D. R., Cramb, S. M., & Baade, P. D. (2008) · Journal of Thoracic Oncology · doi:10.1097/jto.0b013e31818020eb · Cited by 817
Etkind, S. N., Bone, A. E., Gomes, B., Lovell, N., Evans, C., Higginson, I. J., & Murtagh, F. E. (2017) · BMC Medicine · doi:10.1186/s12916-017-0860-2 · Cited by 808
The Tissue-Engineered Vascular Graft—Past, Present, and Future
Pashneh‐Tala, S., MacNeil, S., & Claeyssens, F. (2015) · Tissue Engineering Part B Reviews · doi:10.1089/ten.teb.2015.0100 · Cited by 821
Benefits of the Mediterranean Diet: Insights From the PREDIMED Study
Martínez‐González, M. Á., Salas‐Salvadó, J., Estruch, R., Corella, D., Fitó, M., & Ros, E. (2015) · Progress in Cardiovascular Diseases · doi:10.1016/j.pcad.2015.04.003 · Cited by 836
Kocalevent, R.-D., Hinz, A., & Brähler, E. (2013) · General Hospital Psychiatry · doi:10.1016/j.genhosppsych.2013.04.006 · Cited by 748
Surgery and Global Health: A View from Beyond the OR
Farmer, P. E., & Kim, J. Y. (2008) · World Journal of Surgery · doi:10.1007/s00268-008-9525-9 · Cited by 738
Weight Science: Evaluating the Evidence for a Paradigm Shift
Bacon, L., & Aphramor, L. (2011) · Nutrition Journal · doi:10.1186/1475-2891-10-9 · Cited by 833
Firmann, M., Mayor, V., Marques-Vidal, P. M., Bochud, M., Pécoud, A. R., Hayoz, D., Paccaud, F. M., Preisig, M., Song, K. S., Yuan, X., et al. (2008) · BMC Cardiovascular Disorders · doi:10.1186/1471-2261-8-6 · Cited by 739
Weinberger, A. H., Gbedemah, M., Martinez, A. M., Nash, D., Galea, S., & Goodwin, R. D. (2018) · Psychological Medicine · doi:10.1017/s0033291717002781 · Cited by 716
Chan, K. Y., Wang, W., Wu, J., Τheodoratou, E., Theodoratou, E., Car, J., Middleton, L. T., Russ, T. C., Deary, I. J., Campbell, H., et al. (2013) · The Lancet · doi:10.1016/s0140-6736(13)60221-4 · Cited by 726
Facebook language predicts depression in medical records
Eichstaedt, J. C., Smith, R. J., Merchant, R. M., Ungar, L. H., Crutchley, P., Preoţiuc-Pietro, D., Asch, D. A., & Schwartz, H. A. (2018) · Proceedings of the National Academy of Sciences · doi:10.1073/pnas.1802331115 · Cited by 643
Thrombosis formation on atherosclerotic lesions and plaque rupture
Badimón, L., & Vilahur, G. (2014) · Journal of Internal Medicine · doi:10.1111/joim.12296 · Cited by 699
Alwan, A., MacLean, D. R., Riley, L. M., d’Espaignet, E. T., Mathers, C. D., Stevens, G. A., & Bettcher, D. W. (2010) · The Lancet · doi:10.1016/s0140-6736(10)61853-3 · Cited by 678
Self-citationPrognosis research strategy (PROGRESS) 1: A framework for researching clinical outcomes
Hemingway, H., Croft, P. R., Perel, P., Hayden, J. A., Abrams, K. R., Timmis, A., Briggs, A. H., Udumyan, R., Moons, K. G. M., Steyerberg, E. W., et al. (2013) · BMJ · doi:10.1136/bmj.e5595 · Cited by 698
Tobacco-smoking-related differential DNA methylation: 27K discovery and replication
Breitling, L. P., Yang, R., Korn, B., Burwinkel, B., & Brenner, H. (2011) · The American Journal of Human Genetics · doi:10.1016/j.ajhg.2011.03.003 · Cited by 640
Neural recording and modulation technologies
Chen, R., Canales, A., & Anikeeva, P. (2017) · Nature Reviews Materials · doi:10.1038/natrevmats.2016.93 · Cited by 655
Carvalho, A. F., Sharma, M. S., Brunoni, A. R., Vieta, E., & Fava, G. A. (2016) · Psychotherapy and Psychosomatics · doi:10.1159/000447034 · Cited by 650
Hingorani, A., LaMuraglia, G. M., Henke, P. K., Meissner, M. H., Loretz, L., Zinszer, K. M., Driver, V. R., Frykberg, R. G., Carman, T. L., Marston, W. A., et al. (2016) · Journal of Vascular Surgery · doi:10.1016/j.jvs.2015.10.003 · Cited by 641
Non-communicable diseases in sub-Saharan Africa: what we know now
Dalal, S., Beunza, J. J., Volmink, J. A., Adebamowo, C., Bajunirwe, F., Njelekela, M. A., Mozaffarian, D., Fawzi, W. W., Willett, W. C., Adami, H., et al. (2011) · International Journal of Epidemiology · doi:10.1093/ije/dyr050 · Cited by 647
Kim, Y.-K., Na, K.-S., Myint, A.-M., & Leonard, B. E. (2016) · Progress in Neuro-Psychopharmacology and Biological Psychiatry · doi:10.1016/j.pnpbp.2015.06.008 · Cited by 620
Smart Homes for Elderly Healthcare—Recent Advances and Research Challenges
Majumder, S., Aghayi, E., Noferesti, M., Memarzadeh‐Tehran, H., Mondal, T. K., Pang, Z., & Deen, M. J. (2017) · Sensors · doi:10.3390/s17112496 · Cited by 636
Berlim, M. T., van den Eynde, F., Tovar-Perdomo, S., & Daskalakis, Z. J. (2014) · Psychological Medicine · doi:10.1017/s0033291713000512 · Cited by 620
Fuster, V., & Kelly, B. B. (2010) · Cited by 611
Lund, C., Tomlinson, M., De Silva, M., Fekadu, A., Shidhaye, R., Jordans, M., Petersen, I., Bhana, A., Kigozi, F., Prince, M., et al. (2012) · PLoS Medicine · doi:10.1371/journal.pmed.1001359 · Cited by 584
Medicinal Plants and Cancer Chemoprevention
Desai, A., Qazi, G., Ganju, R., El-Tamer, M., Singh, J., Saxena, A., Bedi, Y. S., Taneja, S., & Bhat, H. (2008) · Current Drug Metabolism · doi:10.2174/138920008785821657 · Cited by 627
Sex differences in cardiovascular risk factors and disease prevention
Appelman, Y., van Rijn, B. B., ten Haaf, M. E., Boersma, E., & Peters, S. A. E. (2015) · Atherosclerosis · doi:10.1016/j.atherosclerosis.2015.01.027 · Cited by 588
Mozaffarian, D., Afshin, A., Benowitz, N. L., Bittner, V., Daniels, S. R., Franch, H. A., Jacobs, D. R., Kraus, W. E., Kris-Etherton, P. M., Krummel, D. A., et al. (2012) · Circulation · doi:10.1161/cir.0b013e318260a20b · Cited by 601
Stranges, S., Tigbe, W., Gómez-Olivé, F. X., Thorogood, M., & Kandala, N.-B. (2012) · Sleep · doi:10.5665/sleep.2012 · Cited by 592
Primack, B. A., Shensa, A., Escobar-Viera, C. G., Barrett, E. L., Sidani, J. E., Colditz, J. B., & James, A. E. (2017) · Computers in Human Behavior · doi:10.1016/j.chb.2016.11.013 · Cited by 581
Reward and Punishment Processing in Depression
Eshel, N., & Roiser, J. P. (2010) · Biological Psychiatry · doi:10.1016/j.biopsych.2010.01.027 · Cited by 575
Ekers, D., Webster, L., Van Straten, A., Cuijpers, P., Richards, D., & Gilbody, S. (2014) · PLoS ONE · doi:10.1371/journal.pone.0100100 · Cited by 565
Haines, A., McMichael, A. J., Smith, K. R., Roberts, I., Woodcock, J., Markandya, A., Armstrong, B., Campbell-Lendrum, D. H., Dangour, A. D., Davies, M., et al. (2009) · The Lancet · doi:10.1016/s0140-6736(09)61759-1 · Cited by 618
Physical rehabilitation approaches for the recovery of function and mobility following stroke
Todhunter‐Brown, A., Baer, G. D., Campbell, P., Choo, P. L., Förster, A., Morris, J. H., Pomeroy, V. M., & Langhorne, P. (2014) · Cochrane Database of Systematic Reviews · doi:10.1002/14651858.cd001920.pub3 · Cited by 611
The Effects of Tobacco Smoke and Nicotine on Cognition and the Brain
Swan, G. E., & Lessov‐Schlaggar, C. N. (2007) · Neuropsychology Review · doi:10.1007/s11065-007-9035-9 · Cited by 605
Micha, R., Khatibzadeh, S., Shi, P., Fahimi, S., Lim, S., Andrews, K. G., Engell, R. E., Powles, J., Ezzati, M., Mozaffarian, D., et al. (2014) · BMJ · doi:10.1136/bmj.g2272 · Cited by 573
Asaria, P., Chisholm, D., Mathers, C. D., Ezzati, M., & Beaglehole, R. (2007) · The Lancet · doi:10.1016/s0140-6736(07)61698-5 · Cited by 577
Self-citationBarth, J., Munder, T., Gerger, H., Nüesch, E., Trelle, S., Znoj, H., Jüni, P., & Cuijpers, P. (2013) · PLoS Medicine · doi:10.1371/journal.pmed.1001454 · Cited by 569
A specific antidote for dabigatran: functional and structural characterization
Schiele, F., van Ryn, J., Canada, K. A., Newsome, C., Sepulveda, E., Park, J., Nar, H., & Litzenburger, T. (2013) · Blood · doi:10.1182/blood-2012-11-468207 · Cited by 561
Designing and scaling up integrated youth mental health care
McGorry, P. D., Mei, C., Chanen, A., Hodges, C., Alvarez‐Jimenez, M., & Killackey, E. (2022) · World Psychiatry · doi:10.1002/wps.20938 · Cited by 546
Sun, H., Wu, Z., Nie, X.-W., & Bian, J. (2020) · Frontiers in Pharmacology · doi:10.3389/fphar.2019.01568 · Cited by 558
Cuijpers, P., Sijbrandij, M., Koole, S. L., Andersson, G., Beekman, A. T., & Reynolds, C. F. (2013) · World Psychiatry · doi:10.1002/wps.20038 · Cited by 540
The Lung Tissue Microbiome in Chronic Obstructive Pulmonary Disease
Sze, M. A., Dimitriu, P. A., Hayashi, S., Elliott, W. M., McDonough, J. E., Gosselink, J. V., Cooper, J. D., Sin, D. D., Mohn, W. W., & Hogg, J. C. (2012) · American Journal of Respiratory and Critical Care Medicine · doi:10.1164/rccm.201111-2075oc · Cited by 569
Semahegn, A., Torpey, K., Manu, A., Assefa, N., Tesfaye, G., & Ankomah, A. (2020) · Systematic Reviews · doi:10.1186/s13643-020-1274-3 · Cited by 555
Kemp, A. H., & Quintana, D. S. (2013) · International Journal of Psychophysiology · doi:10.1016/j.ijpsycho.2013.06.018 · Cited by 538
Opioid receptors: Distinct roles in mood disorders
Lutz, P.-E., & Kieffer, B. L. (2013) · Trends in Neurosciences · doi:10.1016/j.tins.2012.11.002 · Cited by 542
Fitzgerald, R. C., Hardwick, R. H., Huntsman, D. D., Carneiro, F., Guilford, P., Blair, V., Chung, D. C., Norton, J. A., Ragunath, K., van Krieken, J. H., et al. (2010) · Journal of Medical Genetics · doi:10.1136/jmg.2009.074237 · Cited by 541
Soy and Health Update: Evaluation of the Clinical and Epidemiologic Literature
Messina, M. (2016) · Nutrients · doi:10.3390/nu8120754 · Cited by 537
Avoidable global cancer deaths and total deaths from smoking
Jha, P. (2009) · Nature Reviews Cancer · doi:10.1038/nrc2703 · Cited by 522
Components of a Cardioprotective Diet: New Insights
Mozaffarian, D., Appel, L. J., & Van Horn, L. (2011) · Circulation · doi:10.1161/circulationaha.110.968735 · Cited by 571
Social media as a measurement tool of depression in populations
De Choudhury, M., Counts, S., & Horvitz, E. (2013) · Proceedings of the 5th Annual ACM Web Science Conference · doi:10.1145/2464464.2464480 · Cited by 497
Metadata
- Authors
- Mathers, C. D., & Loncar, D.
- Affiliations
- World Health Organization (CH)
- Corresponding author
- Mathers, Colin D
- ORCID
- Mathers, Colin D
- Venue
- PLoS Medicine
- Publisher
- Public Library of Science (PLoS)
- Published
- 2006-11-28
- Volume
- 3
- Issue
- 11
- Pages
- e442
- ISSN
- 1549-1277 (ISSN-L)
- 1549-1676
- PMC
- PMC1664601
- OpenAlex
- W2054931962
- Cited by
- 11,386
- References
- 33
- Citations by year
- 2026: 205 · 2025: 373 · 2024: 586 · 2023: 646 · 2022: 671 · 2021: 738 · 2020: 801 · 2019: 833 · 2018: 855 · 2017: 787 · 2016: 796 · 2015: 844 · 2014: 709 · 2013: 627 · 2012: 490
- FWCI
- 592.00
- Type
- journal article
- Language
- en
- Open access
- gold
- doi.org
- Locations
- PLoS Medicine (publishedVersion, cc-by)
- Europe PMC (PubMed Central) (publishedVersion, cc-by)
- PubMed Central (publishedVersion, cc-by)
- PubMed (publishedVersion)
- RePEc: Research Papers in Economics (publishedVersion)
- DOAJ (DOAJ: Directory of Open Access Journals) (submittedVersion, cc-by-sa)
- Figshare (submittedVersion, cc-by)
- Funders
- World Health Organization
- Strong
- Topics
- Social Sciences › Demography › Insurance, Mortality, Demography, Risk Management
- Health Sciences › Medicine › Public Health, Environmental and Occupational Health › Global Health and Epidemiology
- Health Sciences › Medicine › Epidemiology › Healthcare Systems and Public Health
- Keywords
- disease burden, non-communicable diseases, HIV mortality, communicable disease mortality, child mortality, economic development scenarios, age distribution of deaths, body mass index, human capital, income and mortality, death registration data
- MeSH terms
- Acquired Immunodeficiency Syndrome, Adolescent, Adult, Aged, Cause of Death, Child, Child, Preschool, Developing Countries, Epidemiology, Humans, Infant, Infant, Newborn, Middle Aged, Mortality, Smoking, Global Health, HIV Infections
About these checks
Registry, retraction, Cites and statistics results are computed, not judged, with one exception: a printed reference that no index lists is read once by a model before it counts as a citation error. Claims are extracted by a model and kept only when their quote appears verbatim in the text; each cited source is then checked, with a model’s help, for whether it says what the claim relies on. Those verdicts can be wrong — read the claim’s quote and the cited source before relying on one.
Statistics and arithmetic are recomputed, not judged.
Confidence bands are shown only for fields calibrated on our annotated test set. None is calibrated yet, so no band is shown.
What counts as a claim ›How we measure confidence ›How we check this ›
Are you an author, or do you see a problem with this page? Request a review
