

The DOI matches its Crossref record; 47 of the 47 references it cites were found in a registry or an index.
Up-Regulation of Mitochondrial Activity and Acquirement of Brown Adipose Tissue-Like Property in the White Adipose Tissue of Fsp27 Deficient Mice
Open accessAbstract
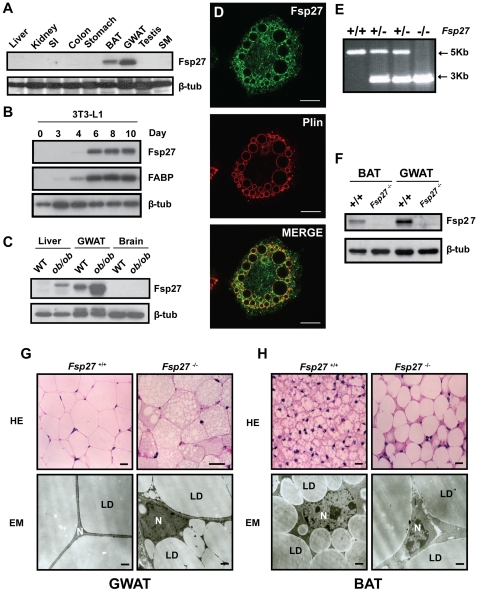
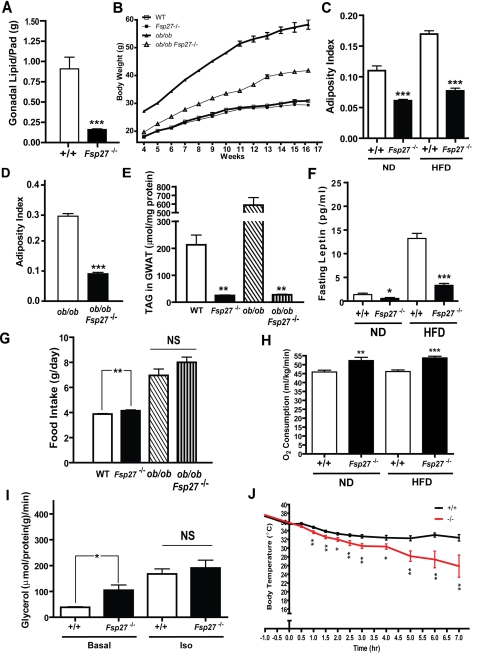
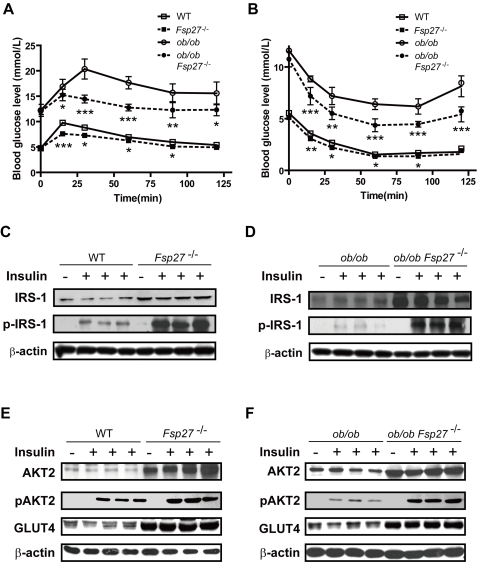
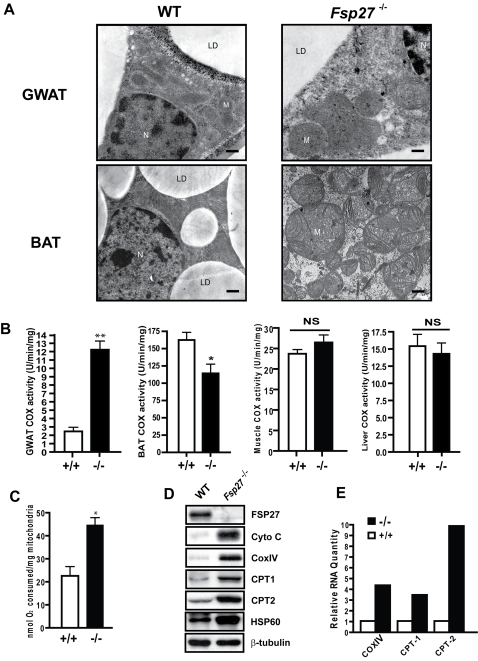
Fsp27, a member of the Cide family proteins, was shown to localize to lipid droplet and promote lipid storage in adipocytes. We aimed to understand the biological role of Fsp27 in regulating adipose tissue differentiation, insulin sensitivity and energy balance. Fsp27(-/-) mice and Fsp27/lep double deficient mice were generated and we examined the adiposity, whole body metabolism, BAT and WAT morphology, insulin sensitivity, mitochondrial activity, and gene expression changes in these mouse strains. Furthermore, we isolated mouse embryonic fibroblasts (MEFs) from wildtype and Fsp27(-/-) mice, followed by their differentiation into adipocytes in vitro. We found that Fsp27 is expressed in both brown adipose tissue (BAT) and white adipose tissue (WAT) and its levels were significantly elevated in the WAT and liver of leptin-deficient ob/ob mice. Fsp27(-/-) mice had increased energy expenditure, lower levels of plasma triglycerides and free fatty acids. Furthermore, Fsp27(-/-)and Fsp27/lep double-deficient mice are resistant to diet-induced obesity and display increased insulin sensitivity. Moreover, white adipocytes in Fsp27(-/-) mice have reduced triglycerides accumulation and smaller lipid droplets, while levels of mitochondrial proteins, mitochondrial size and activity are dramatically increased. We further demonstrated that BAT-specific genes and key metabolic controlling factors such as FoxC2, PPAR and PGC1alpha were all markedly upregulated. In contrast, factors inhibiting BAT differentiation such as Rb, p107 and RIP140 were down-regulated in the WAT of Fsp27(-/-) mice. Remarkably, Fsp27(-/-) MEFs differentiated in vitro show many brown adipocyte characteristics in the presence of the thyroid hormone triiodothyronine (T3). Our data thus suggest that Fsp27 acts as a novel regulator in vivo to control WAT identity, mitochondrial activity and insulin sensitivity.
Overview
The claims and statistics of this paper haven’t been checked yet.
Run the check — free, no account needed. It reads the open-access text and checks the sources it cites.
Integrity signals
Registry
Cites
Statistics
Figures
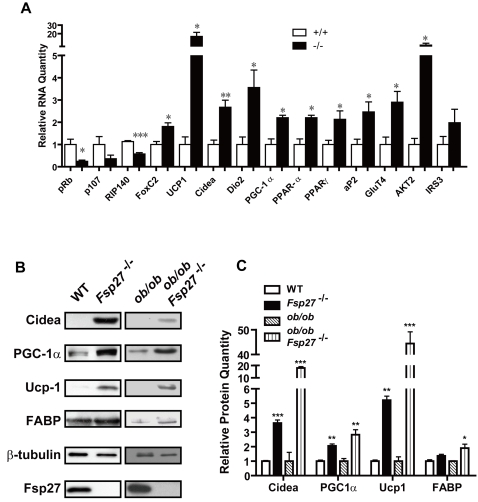
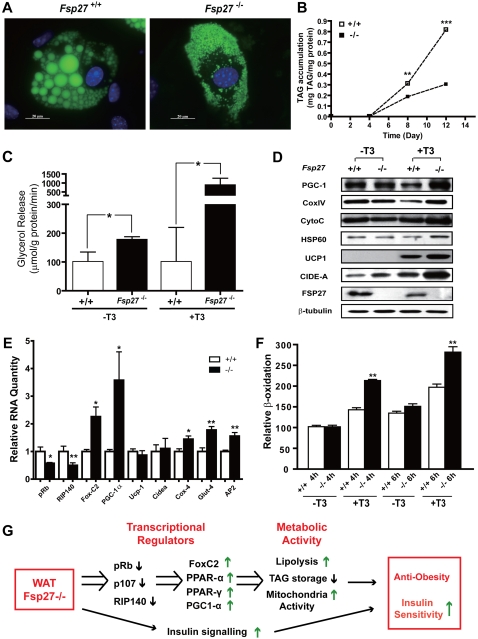
Verification
Claims the paper makes
The claims and statistics of this paper haven’t been checked yet.
Run the check — free, no account needed. It reads the open-access text and checks the sources it cites.
Claims other papers make about this one
Each is checked against this paper’s own text: does it say what the citing paper says it does?
In the citing paper
“Higher mitochondrial density and even UCP1 can be induced in response to pharmacological or genetic alterations of white adipocytes (170 -177), suggesting that white adipose tissue could potentially be induced to acquire more oxidative metabolic phenotypes, promoting increased fuel consumption and thus energy expenditure.”
From The role of mitochondria in the pathogenesis of type 2 diabetes (2010) · cites this paper as [176]
In the citing paper
“For example, Toh et al. (176) and Nishino,et al. (205) find that mice deficient in Fsp27, a lipid droplet protein that promotes lipid storage in white and brown adipocytes, have increased whole-body energy expenditure, resistance to diet-induced obesity, and enhanced insulin sensitivity.”
From The role of mitochondria in the pathogenesis of type 2 diabetes (2010) · cites this paper as [176]
Self-check
Percentages, sums and reported differences re-computed from the paper’s own numbers.
The self-check needs the paper’s full text.
Citations
Cites
Molecular Cloning: A Laboratory Manual
Sambrook, J., Fritsch, E., & Maniatis, T. (1989) · UCLA - Biblioteca de Ciencias de la Salud · Cited by 133,589
Molecular cloning: A laboratory manual
Deininger, P. L. (1990) · Analytical Biochemistry · doi:10.1016/0003-2697(90)90595-z · Cited by 84,684
A SIMPLE METHOD FOR THE ISOLATION AND PURIFICATION OF TOTAL LIPIDES FROM ANIMAL TISSUES
Folch, J., Lees, M., & Stanley, G. H. S. (1957) · Journal of Biological Chemistry · doi:10.1016/s0021-9258(18)64849-5 · Cited by 65,189
Wu, Z., Puigserver, P., Andersson, U., Zhang, C., Adelmant, G., Mootha, V., Troy, A., Cinti, S., Lowell, B., Scarpulla, R. C., et al. (1999) · Cell · doi:10.1016/s0092-8674(00)80611-x · Cited by 4,139
A Cold-Inducible Coactivator of Nuclear Receptors Linked to Adaptive Thermogenesis
Puigserver, P., Wu, Z., Park, C. W., Graves, R., Wright, M., & Spiegelman, B. M. (1998) · Cell · doi:10.1016/s0092-8674(00)81410-5 · Cited by 3,864
Metabolic control through the PGC-1 family of transcription coactivators
Lin, J., Handschin, C., & Spiegelman, B. M. (2005) · Cell Metabolism · doi:10.1016/j.cmet.2005.05.004 · Cited by 2,130 · cited 1×
“PGC-1a [7,8], a coactivator of multiple transcription factors such as nuclear respiratory factors (NRF-1/2) [9,10] and peroxisome proliferator-activated receptor (PPAR) [11], is also highly expressed in BAT but low in WAT [12].”
BackgroundDevelopmental Origin of Fat: Tracking Obesity to Its Source
Gesta, S., Tseng, Y.-H., & Kahn, C. R. (2007) · Cell · doi:10.1016/j.cell.2007.10.004 · Cited by 1,508
Handschin, C., & Spiegelman, B. M. (2006) · Endocrine Reviews · doi:10.1210/er.2006-0037 · Cited by 1,090
Brasaemle, D., Dolios, G., Shapiro, L. S., & Wang, R. (2004) · Journal of Biological Chemistry · doi:10.1074/jbc.m409340200 · Cited by 804
Shimomura, I., Hammer, R. E., Richardson, J. A., Ikemoto, S., Bashmakov, Y., Goldstein, J. L., & Brown, M. S. (1998) · Genes & Development · doi:10.1101/gad.12.20.3182 · Cited by 790
Cited by
Sorted by citations
Brown and beige fat: Development, function and therapeutic potential
Harms, M., & Seale, P. (2013) · Nature Medicine · doi:10.1038/nm.3361 · Cited by 2,328
Prdm16 determines the thermogenic program of subcutaneous white adipose tissue in mice
Seale, P., Conroe, H. M., Estall, J. L., Kajimura, S., Frontini, A., Ishibashi, J., Cohen, P., Cinti, S., & Spiegelman, B. M. (2010) · Journal of Clinical Investigation · doi:10.1172/jci44271 · Cited by 1,272
Adipose tissue browning and metabolic health
Bartelt, A., & Heeren, J. (2014) · Nature Reviews Endocrinology · doi:10.1038/nrendo.2013.204 · Cited by 1,177
Adaptive thermogenesis in adipocytes: Is beige the new brown?
Wu, J., Cohen, P., & Spiegelman, B. M. (2013) · Genes & Development · doi:10.1101/gad.211649.112 · Cited by 828
Moreno-Navarrete, J. M., Ortega, F., Serrano, M., Guerra, E., Pardo, G., Tinahones, F., Ricart, W., & Fernández-Real, J. M. (2013) · The Journal of Clinical Endocrinology & Metabolism · doi:10.1210/jc.2012-2749 · Cited by 788
An Emerging Role of mTOR in Lipid Biosynthesis
Laplante, M., & Sabatini, D. M. (2009) · Current Biology · doi:10.1016/j.cub.2009.09.058 · Cited by 642
The role of lipid droplets in metabolic disease in rodents and humans
Greenberg, A. S., Coleman, R., Kraemer, F. B., McManaman, J. L., Obin, M. S., Puri, V., Yan, Q.-W., Miyoshi, H., & Mashek, D. G. (2011) · Journal of Clinical Investigation · doi:10.1172/jci46069 · Cited by 620
Adipose triglyceride lipase and the lipolytic catabolism of cellular fat stores.
Zechner, R., Kienesberger, P. C., Haemmerle, G., Zimmermann, R., & Lass, A. (2009) · Journal of Lipid Research · doi:10.1194/jlr.r800031-jlr200 · Cited by 576
The role of mitochondria in the pathogenesis of type 2 diabetes
Patti, M.-E., & Corvera, S. (2010) · Endocrine Reviews · doi:10.1210/er.2009-0027 · Cited by 551
The dynamic roles of intracellular lipid droplets: from archaea to mammals
Murphy, D. J. (2011) · PROTOPLASMA · doi:10.1007/s00709-011-0329-7 · Cited by 410
Dissecting adipose tissue lipolysis: molecular regulation and implications for metabolic disease
Nielsen, T. S., Jessen, N., Jørgensen, J. O. L., Møller, N., & Lund, S. A. (2014) · Journal of Molecular Endocrinology · doi:10.1530/jme-13-0277 · Cited by 397
Structural and biochemical characteristics of various white adipose tissue depots
Wrońska, A., & Kmieć, Z. (2012) · Acta Physiologica · doi:10.1111/j.1748-1716.2012.02409.x · Cited by 370
Genetic Syndromes of Severe Insulin Resistance
Semple, R. K., Savage, D. B., Cochran, E. K., Görden, P., & O’Rahilly, S. (2011) · Endocrine Reviews · doi:10.1210/er.2010-0020 · Cited by 364
Fsp27 promotes lipid droplet growth by lipid exchange and transfer at lipid droplet contact sites
Gong, J., Sun, Z., Wu, L., Xu, W., Schieber, N. L., Xu, D., Shui, G., Yang, H., Parton, R. G., & Li, P. (2011) · The Journal of Cell Biology · doi:10.1083/jcb.201104142 · Cited by 362
Self-citationA Role for Phosphatidic Acid in the Formation of “Supersized” Lipid Droplets
Fei, W., Shui, G., Zhang, Y., Krahmer, N., Ferguson, C., Kapterian, T. S., Lin, R. C. Y., Dawes, I. W., Brown, A. J., Li, P., et al. (2011) · PLoS Genetics · doi:10.1371/journal.pgen.1002201 · Cited by 358
Self-citationBrown fat fuel utilization and thermogenesis
Townsend, K. L., & Tseng, Y. (2014) · Trends in Endocrinology and Metabolism · doi:10.1016/j.tem.2013.12.004 · Cited by 342
The Roles of mTOR Complexes in Lipid Metabolism
Caron, A., Richard, D., & Laplante, M. (2015) · Annual Review of Nutrition · doi:10.1146/annurev-nutr-071714-034355 · Cited by 323
Rubio‐Cabezas, O., Puri, V., Murano, I., Saudek, V., Semple, R. K., Dash, S., Hyden, C. S. S., Bottomley, W. E., Vigouroux, C., Magré, J., et al. (2009) · EMBO Molecular Medicine · doi:10.1002/emmm.200900037 · Cited by 294
Pharmacological and nutritional agents promoting browning of white adipose tissue
Bonet, M. L., Oliver, P., & Palou, A. (2012) · Biochimica et Biophysica Acta (BBA) - Molecular and Cell Biology of Lipids · doi:10.1016/j.bbalip.2012.12.002 · Cited by 285
Perilipin1 promotes unilocular lipid droplet formation through the activation of Fsp27 in adipocytes
Sun, Z., Gong, J., Wu, H. J., Xu, W., Wu, L., Xu, D., Gao, J., Wu, J., Yang, H., Yang, M., et al. (2013) · Nature Communications · doi:10.1038/ncomms2581 · Cited by 258
Self-citationBrown fat biology and thermogenesis
Richard, D. (2010) · Frontiers in bioscience · doi:10.2741/3786 · Cited by 251
Ye, J., Li, J. Z., Liu, Y., Li, X., Yang, T., Ma, X., Li, Q., Yao, Z., & Li, P. (2009) · Cell Metabolism · doi:10.1016/j.cmet.2008.12.013 · Cited by 248
Self-citationFate of fat: The role of adipose triglyceride lipase in lipolysis
Zimmermann, R., Lass, A., Haemmerle, G., & Zechner, R. (2008) · Biochimica et Biophysica Acta (BBA) - Molecular and Cell Biology of Lipids · doi:10.1016/j.bbalip.2008.10.005 · Cited by 250
Packaging of Fat: An Evolving Model of Lipid Droplet Assembly and Expansion
Brasaemle, D., & Wolins, N. E. (2011) · Journal of Biological Chemistry · doi:10.1074/jbc.r111.309088 · Cited by 229
Central Fibroblast Growth Factor 21 Browns White Fat via Sympathetic Action in Male Mice
Douris, N., Stevanovic, D. M., Fisher, F. M., Cisu, T. I., Chee, M. J., Nguyen, N. L., Zarebidaki, E., Adams, A. C., Kharitonenkov, A., Flier, J. S., et al. (2015) · Endocrinology · doi:10.1210/en.2014-2001 · Cited by 215
Madsen, L., Pedersen, L. M., Lillefosse, H. H., Fjære, E., Brønstad, I., Hao, Q., Petersen, R. K., Hallenborg, P., Ma, T., Matteis, R. D., et al. (2010) · PLoS ONE · doi:10.1371/journal.pone.0011391 · Cited by 203
Controlling the size of lipid droplets: lipid and protein factors
Yang, H., Galea, A. M., Sytnyk, V., & Crossley, M. (2012) · Current Opinion in Cell Biology · doi:10.1016/j.ceb.2012.05.012 · Cited by 200
Self-citationNull Mutation in Hormone-Sensitive Lipase Gene and Risk of Type 2 Diabetes
Albert, J. S., Yerges‐Armstrong, L. M., Horenstein, R. B., Pollin, T. I., Sreenivasan, U., Chai, S., Blaner, W. S., Snitker, S., O’Connell, J. R., Gong, D.-W., et al. (2014) · New England Journal of Medicine · doi:10.1056/nejmoa1315496 · Cited by 199
Cidea promotes hepatic steatosis by sensing dietary fatty acids
Zhou, L., Xu, L. M., Ye, J., Li, D., Wang, W., Li, X., Wu, L., Wang, H., Guan, F., & Li, P. (2012) · Hepatology · doi:10.1002/hep.25611 · Cited by 190
Self-citationLipolysis and lipases in white adipose tissue – An update
Bolsoni-Lopes, A., & Alonso-Vale, M. I. C. (2015) · Archives of Endocrinology and Metabolism · doi:10.1590/2359-3997000000067 · Cited by 183
Lipid homeostasis and the formation of macrophage-derived foam cells in atherosclerosis
Yuan, Y., Li, P., & Ye, J. (2012) · Protein & Cell · doi:10.1007/s13238-012-2025-6 · Cited by 181
Self-citationMüller, G. A., Schneider, M., Biemer‐Daub, G., & Wied, S. (2011) · Cellular Signalling · doi:10.1016/j.cellsig.2011.03.013 · Cited by 176
Townsend, K. L., & Tseng, Y. (2012) · Adipocyte · doi:10.4161/adip.18951 · Cited by 182
Lipid droplet–organelle interactions: emerging roles in lipid metabolism
Barbosa, A. D., Savage, D. B., & Siniossoglou, S. (2015) · Current Opinion in Cell Biology · doi:10.1016/j.ceb.2015.04.017 · Cited by 177
Microvesicles/exosomes as potential novel biomarkers of metabolic diseases
ller, G. M. A. U. (2012) · Diabetes Metabolic Syndrome and Obesity · doi:10.2147/dmso.s32923 · Cited by 178
CIDE proteins and metabolic disorders
Gong, J., Sun, Z., & Li, P. (2009) · Current Opinion in Lipidology · doi:10.1097/mol.0b013e328328d0bb · Cited by 165
Self-citationCIDE Proteins and Lipid Metabolism
Xu, L. M., Zhou, L., & Li, P. (2012) · Arteriosclerosis Thrombosis and Vascular Biology · doi:10.1161/atvbaha.111.241489 · Cited by 164
Self-citationMoessinger, C., Klizaite, K., Steinhagen, A., Philippou‐Massier, J., Shevchenko, A., Hoch, M., Ejsing, C. S., & Thiele, C. (2014) · BMC Cell Biology · doi:10.1186/s12860-014-0043-3 · Cited by 151
Tsai, N., Lin, Y., & Wei, L. (2009) · Biochemical Journal · doi:10.1042/bj20090915 · Cited by 145
Role of adipose specific lipid droplet proteins in maintaining whole body energy homeostasis
Konige, M., Wang, H., & Sztalryd, C. (2013) · Biochimica et Biophysica Acta (BBA) - Molecular Basis of Disease · doi:10.1016/j.bbadis.2013.05.007 · Cited by 148
FSP27 Promotes Lipid Droplet Clustering and Then Fusion to Regulate Triglyceride Accumulation
Jambunathan, S., Yin, J., Khan, W., Tamori, Y., & Puri, V. (2011) · PLoS ONE · doi:10.1371/journal.pone.0028614 · Cited by 134
Perrone, C. E., Mattocks, D. A. L., Jarvis-Morar, M., Plummer, J. D., & Orentreich, N. (2010) · Metabolism · doi:10.1016/j.metabol.2009.10.023 · Cited by 136
Control of lipid droplet fusion and growth by CIDE family proteins
Gao, G., Chen, F., Zhou, L., Su, L., Xu, D., Xu, L. M., & Li, P. (2017) · Biochimica et Biophysica Acta (BBA) - Molecular and Cell Biology of Lipids · doi:10.1016/j.bbalip.2017.06.009 · Cited by 128
Self-citationFSP27 and PLIN1 interaction promotes the formation of large lipid droplets in human adipocytes
Grahn, T. H. M., Zhang, Y., Lee, M., Sommer, A. G., Mostoslavsky, G., Fried, S. K., Greenberg, A. S., & Puri, V. (2013) · Biochemical and Biophysical Research Communications · doi:10.1016/j.bbrc.2013.01.113 · Cited by 127
Self-citationFatty acid metabolism and the basis of brown adipose tissue function
Calderón‐Domínguez, M., Mir, J. F., Fucho, R., Weber, M., Serra, D., & Herrero, L. (2015) · Adipocyte · doi:10.1080/21623945.2015.1122857 · Cited by 134
Rab8a-AS160-MSS4 Regulatory Circuit Controls Lipid Droplet Fusion and Growth
Wu, L., Xu, D., Zhou, L., Xie, B., Yu, L., Yang, H., Huang, L., Ye, J., Deng, H., Yuan, Y. A., et al. (2014) · Developmental Cell · doi:10.1016/j.devcel.2014.07.005 · Cited by 125
Self-citationXu, W., Wu, L., Yu, M., Chen, F., Arshad, M., Xia, X., Hao, R., Yu, J., Xu, L. M., Xu, D., et al. (2016) · Journal of Biological Chemistry · doi:10.1074/jbc.m115.701094 · Cited by 119
Self-citationGrahn, T. H. M., Kaur, R., Yin, J., Schweiger, M., Sharma, V. M., Lee, M., Ido, Y., Smas, C. M., Zechner, R., Lass, A., et al. (2014) · Journal of Biological Chemistry · doi:10.1074/jbc.m113.539890 · Cited by 117
Kolditz, C.-I., & Langin, D. (2010) · Current Opinion in Clinical Nutrition & Metabolic Care · doi:10.1097/mco.0b013e32833bed6a · Cited by 124
Rahman, S. M., Janssen, R. C., Choudhury, M., Baquero, K. C., Aikens, R. M., de la Houssaye, B. A., & Friedman, J. E. (2012) · Journal of Biological Chemistry · doi:10.1074/jbc.m112.410613 · Cited by 115
Baskaran, P., Krishnan, V., Fettel, K. D., Gao, P., Zhu, Z., Ren, J. T., & Thyagarajan, B. (2017) · International Journal of Obesity · doi:10.1038/ijo.2017.16 · Cited by 119
Cidea is an essential transcriptional coactivator regulating mammary gland secretion of milk lipids
Wang, W., Lv, N., Zhang, S., Shui, G., Qian, H., Zhang, J., Chen, Y., Ye, J., Xie, Y., Shen, Y., et al. (2012) · Nature Medicine · doi:10.1038/nm.2614 · Cited by 114
Self-citationSeipin, adipogenesis and lipid droplets
Fei, W., Du, X., & Yang, H. (2011) · Trends in Endocrinology and Metabolism · doi:10.1016/j.tem.2011.02.004 · Cited by 114
Self-citationCytosolic lipid droplets: From mechanisms of fat storage to disease
Gross, D. A., & Silver, D. L. (2014) · Critical Reviews in Biochemistry and Molecular Biology · doi:10.3109/10409238.2014.931337 · Cited by 117
Zhou, L., Park, S., Xu, L. M., Xia, X., Ye, J., Su, L., Jeong, K.-H., Hur, J. H., Oh, H., Tamori, Y., et al. (2015) · Nature Communications · doi:10.1038/ncomms6949 · Cited by 107
Self-citationCIDE family proteins control lipid homeostasis and the development of metabolic diseases
Chen, F., Yin, Y., Chua, B. T., & Li, P. (2019) · Traffic · doi:10.1111/tra.12717 · Cited by 112
Self-citationXu, X., Park, J., So, J., & Lee, A. (2014) · Hepatology · doi:10.1002/hep.27371 · Cited by 103
Lipid droplets as fat storage organelles in Caenorhabditis elegans
Mak, H. Y. (2011) · Journal of Lipid Research · doi:10.1194/jlr.r021006 · Cited by 102
Hepatic triacylglycerol hydrolysis regulates peroxisome proliferator-activated receptor α activity
Sapiro, J. M., Mashek, M. T., Greenberg, A. S., & Mashek, D. G. (2009) · Journal of Lipid Research · doi:10.1194/jlr.m800614-jlr200 · Cited by 95
Myeloperoxidase Deletion Prevents High-Fat Diet–Induced Obesity and Insulin Resistance
Wang, Q., Xie, Z., Zhang, W., Zhou, J., Wu, Y., Zhang, M., Zhu, H., & Zou, M. (2014) · Diabetes · doi:10.2337/db14-0026 · Cited by 97
RetractedAdipocyte lipases and lipid droplet-associated proteins: insight from transgenic mouse models
Girousse, A., & Langin, D. (2011) · International Journal of Obesity · doi:10.1038/ijo.2011.113 · Cited by 98
Cidea controls lipid droplet fusion and lipid storage in brown and white adipose tissue
Wu, L., Zhou, L., Chen, C., Gong, J., Xu, L. M., Ye, J., Li, D., & Li, P. (2013) · Science China Life Sciences · doi:10.1007/s11427-013-4585-y · Cited by 91
Self-citationTanaka, N., Takahashi, S., Matsubara, T., Jiang, C., Sakamoto, W., Chanturiya, T., Teng, R., Gavrilova, O., & Gonzalez, F. J. (2014) · Journal of Biological Chemistry · doi:10.1074/jbc.m114.605980 · Cited by 89
Perilipin Overexpression in White Adipose Tissue Induces a Brown Fat-Like Phenotype
Sawada, T., Miyoshi, H., Shimada, K., Suzuki, A. K., Okamatsu‐Ogura, Y., Perfield, J. W., Kondo, T., Nagai, S., Shimizu, C., Yoshioka, N., et al. (2010) · PLoS ONE · doi:10.1371/journal.pone.0014006 · Cited by 88
The size matters: regulation of lipid storage by lipid droplet dynamics
Yu, J., & Li, P. (2016) · Science China Life Sciences · doi:10.1007/s11427-016-0322-x · Cited by 91
Self-citationQian, H., Chen, Y., Nian, Z., Su, L., Yu, H., Chen, F., Zhang, X., Xu, W., Zhou, L., Liu, J., et al. (2017) · Journal of Clinical Investigation · doi:10.1172/jci85963 · Cited by 86
Self-citationLiu, K., Zhou, S., Kim, J., Tillison, K., Majors, D., Rearick, D., Lee, J. H., Fernandez-Boyanapalli, R. F., Barricklow, K., Houston, M. S., et al. (2009) · American Journal of Physiology-Endocrinology and Metabolism · doi:10.1152/ajpendo.00188.2009 · Cited by 84
Renvoisé, B., Malone, B., Falgairolle, M., Munasinghe, J., Stadler, J., Sibilla, C., Park, S. H., & Blackstone, C. D. (2016) · Human Molecular Genetics · doi:10.1093/hmg/ddw315 · Cited by 89
Yang, R., Yu, L., Graham, J. L., Hsu, D. K., Lloyd, K. C. K., Havel, P. J., & Liu, F. (2011) · Proceedings of the National Academy of Sciences · doi:10.1073/pnas.1109065108 · Cited by 81
Auffret, J., Viengchareun, S., Carré, N., Denis, R., Magnan, C., Marie, P., Muscat, A., Fève, B., Lombès, M., & Binart, N. (2012) · The FASEB Journal · doi:10.1096/fj.12-204958 · Cited by 81
Langhi, C., & Baldán, Á. (2014) · Hepatology · doi:10.1002/hep.27607 · Cited by 76
The genetics of lipid storage and human lipodystrophies
Robbins, A. L., & Savage, D. B. (2015) · Trends in Molecular Medicine · doi:10.1016/j.molmed.2015.04.004 · Cited by 72
Li, X., Ye, J., Zhou, L., Gu, W., Fisher, E. A. A., & Li, P. (2012) · Journal of Lipid Research · doi:10.1194/jlr.m026591 · Cited by 74
Self-citationPostlipolytic insulin-dependent remodeling of micro lipid droplets in adipocytes
Ariotti, N., Murphy, S., Hamilton, N., Wu, L., Green, K., Schieber, N. L., Li, P., Martin, S., & Parton, R. G. (2012) · Molecular Biology of the Cell · doi:10.1091/mbc.e11-10-0847 · Cited by 74
Self-citationLipid droplet-associated proteins in atherosclerosis (Review)
Ayyappan, J. P., Paul, A., & Goo, Y. (2016) · Molecular Medicine Reports · doi:10.3892/mmr.2016.5099 · Cited by 71
The holy grail of metabolic disease
Bartelt, A., & Heeren, J. (2012) · Current Opinion in Lipidology · doi:10.1097/mol.0b013e328352dcef · Cited by 69
PRDM16: the interconvertible adipo-myocyte switch
Frühbeck, G., Sesma, P., & Burrell, M. A. (2009) · Trends in Cell Biology · doi:10.1016/j.tcb.2009.01.007 · Cited by 67
Which CIDE are you on? Apoptosis and energy metabolism
Yonezawa, T., Kurata, R., Kimura, M., & Inoko, H. (2010) · Molecular BioSystems · doi:10.1039/c0mb00099j · Cited by 69
Zhou, R., Yi, L., Ye, X., Zeng, X., Liu, K., Qin, Y., Zhang, Q., & Mi, M. (2018) · Cellular Physiology and Biochemistry · doi:10.1159/000495898 · Cited by 67
Modulation of myocellular fat stores: lipid droplet dynamics in health and disease
Meex, R. C. R., Schrauwen, P., & Hesselink, M. K. C. (2009) · American Journal of Physiology-Regulatory, Integrative and Comparative Physiology · doi:10.1152/ajpregu.91053.2008 · Cited by 65
Zhou, L., Yu, M., Arshad, M., Wang, W., Lu, Y., Gong, J., Gu, Y., Li, P., & Xu, L. M. (2018) · Diabetes · doi:10.2337/db17-1452 · Cited by 65
Self-citationLuo, H., Ming, J., Lian, G., Liu, Q., Shi, M., Li, T. Y., Song, L., Ye, J., He, Y., Yao, L., et al. (2018) · Cell Metabolism · doi:10.1016/j.cmet.2018.02.021 · Cited by 65
Self-citationLidell, M. E., Seifert, E. L., Westergren, R., Heglind, M., Gowing, A., Sukonina, V., Arani, Z., Itkonen, P., Wallin, S., Westberg, F., et al. (2011) · Diabetes · doi:10.2337/db10-0409 · Cited by 64
Nian, Z., Sun, Z., Yu, L., Toh, S. Y., Sang, J., & Li, P. (2010) · Journal of Biological Chemistry · doi:10.1074/jbc.m109.043786 · Cited by 60
Self-citationFoxO1 antagonist suppresses autophagy and lipid droplet growth in adipocytes
Liu, L., Zheng, L., Zou, P., Brooke, J., Smith, C., Long, Y. C., Almeida, F. A., Liu, D., & Cheng, Z. (2016) · Cell Cycle · doi:10.1080/15384101.2016.1192732 · Cited by 60
Nishimoto, Y., & Tamori, Y. (2017) · Journal of Atherosclerosis and Thrombosis · doi:10.5551/jat.rv17011 · Cited by 62
Zizola, C. F., Schwartz, G. J., & Vogel, S. (2008) · American Journal of Physiology-Endocrinology and Metabolism · doi:10.1152/ajpendo.90464.2008 · Cited by 61
Chou, C., Lin, Y.-Y., Wang, H.-K., Zhu, X., Giovarelli, M., Briata, P., Gherzi, R., Garvey, W. T., & Chen, C. (2014) · Diabetes · doi:10.2337/db13-1901 · Cited by 58
Singh, M., Kaur, R., Lee, M., Pickering, R. T., Sharma, V. M., Puri, V., & Kandror, K. V. (2014) · Journal of Biological Chemistry · doi:10.1074/jbc.c114.563080 · Cited by 59
Connecting lipid droplet biology and the metabolic syndrome
Lay, S. L., & Dugail, I. (2009) · Progress in Lipid Research · doi:10.1016/j.plipres.2009.03.001 · Cited by 58
CLSTN3β enforces adipocyte multilocularity to facilitate lipid utilization
Qian, K., Tol, M. J., Wu, J., Uchiyama, L. F., Xu, X., Cui, L., Bedard, A. H., Weston, T. A., Rajendran, P. S., Vergnes, L., et al. (2022) · Nature · doi:10.1038/s41586-022-05507-1 · Cited by 55
Self-citationUeno, M., Shen, W., Patel, S., Greenberg, A. S., Azhar, S., & Kraemer, F. B. (2012) · Journal of Lipid Research · doi:10.1194/jlr.m033365 · Cited by 56
Li, S., Khan, R., Raza, S. H. A., Jieyun, H., Mei, C., Nurgulsim, K., Cheng, G., Chunping, Z., Schreurs, N. M., & Zan, L. (2020) · Genomics · doi:10.1016/j.ygeno.2020.01.012 · Cited by 56
Long-term live cell microscopy studies of lipid droplet fusion dynamics in adipocytes
Jüngst, C., Klein, M. K., & Zumbusch, A. (2013) · Journal of Lipid Research · doi:10.1194/jlr.m042515 · Cited by 55
CIDE Proteins in Human Health and Disease
Slayton, M. D., Gupta, A., Balakrishnan, B., & Puri, V. (2019) · Cells · doi:10.3390/cells8030238 · Cited by 55
A gel-like condensation of Cidec generates lipid-permeable plates for lipid droplet fusion
Lyu, X., Wang, J., Wang, J., Yin, Y., Zhu, Y., Li, L., Huang, S., Peng, S., Xue, B., Liao, R., et al. (2020) · Developmental Cell · doi:10.1016/j.devcel.2021.08.015 · Cited by 55
Self-citationFlach, R. J. R., Hui, Q., Zhang, L., & Bennett, A. M. (2011) · Journal of Biological Chemistry · doi:10.1074/jbc.m110.210237 · Cited by 54
Moreno‐Navarrete, J. M., Ortega, F. J., Serrano, M., Rodríguez‐Hermosa, J. I., Ricart, W., Mingrone, G., & Fernández‐Real, J. M. (2013) · International Journal of Obesity · doi:10.1038/ijo.2013.171 · Cited by 51
Distinct Mechanisms Regulate ATGL-Mediated Adipocyte Lipolysis by Lipid Droplet Coat Proteins
Yang, X., Heckmann, B. L., Zhang, X., Smas, C. M., & Liu, J. (2012) · Molecular Endocrinology · doi:10.1210/me.2012-1178 · Cited by 50
Peng, X., Ju, S., Fang, F., Wang, Y., Fang, K., Cui, X., Liu, C., Li, P., Mao, H. Z., & Teng, G. (2012) · American Journal of Physiology-Endocrinology and Metabolism · doi:10.1152/ajpendo.00401.2012 · Cited by 49
Self-citation
Metadata
- Authors
- Toh, S. Y., Gong, J., Du, G., Li, J. Z., Yang, S., Ye, J., Yao, H., Zhang, Y., Xue, B., Li, Q., Yang, H., Wen, Z., & Li, P.
- Affiliations
- Hong Kong University of Science and Technology (HK)
- Tsinghua University (CN)
- Air Force Medical University (CN)
- UNSW Sydney (AU)
- Corresponding author
- Li, Peng
- ORCID
- Venue
- PLoS ONE
- Publisher
- Public Library of Science (PLoS)
- Published
- 2008-08-06
- Volume
- 3
- Issue
- 8
- Pages
- e2890
- ISSN
- 1932-6203 (ISSN-L)
- PMC
- PMC2483355
- OpenAlex
- W1998949529
- Cited by
- 267
- References
- 47
- Citations by year
- 2026: 7 · 2025: 9 · 2024: 10 · 2023: 7 · 2022: 10 · 2021: 7 · 2020: 8 · 2019: 11 · 2018: 11 · 2017: 17 · 2016: 11 · 2015: 21 · 2014: 24 · 2013: 28 · 2012: 25
- FWCI
- 13.81
- Type
- journal article
- Language
- en
- Open access
- gold
- doi.org
- Locations
- PLoS ONE (publishedVersion, cc-by)
- Europe PMC (PubMed Central) (publishedVersion, cc-by)
- PubMed Central (publishedVersion, cc-by)
- PubMed (publishedVersion)
- Rare & Special e-Zone (The Hong Kong University of Science and Technology) (submittedVersion)
- DOAJ (DOAJ: Directory of Open Access Journals) (submittedVersion, cc-by-sa)
- Figshare (submittedVersion, cc-by)
- Funders
- National University of Singapore
- National Natural Science Foundation of China (30530350)
- Ministry of Education of the People's Republic of China (704002)
- Tsinghua University
- Xiamen University
- Changjiang Scholar Program of Chinese Ministry of Education
- National Key Research and Development Program of China (2007CB914404, 2006CB503900)
- Program for Changjiang Scholars and Innovative Research Team in University
- Topics
- Health Sciences › Medicine › Physiology (medical) › Adipose Tissue and Metabolism
- Life Sciences › Biochemistry, Genetics and Molecular Biology › Biochemistry › Lipid metabolism and biosynthesis
- Life Sciences › Biochemistry, Genetics and Molecular Biology › Molecular Biology › Peroxisome Proliferator-Activated Receptors
- Keywords
- FSP27, white adipose tissue, brown adipose tissue, mitochondrial activity, insulin sensitivity, energy balance, diet-induced obesity, leptin, lipid droplets, adipogenesis, FOXC2, PGC-1α, peroxisome proliferator-activated receptors, RIP140, triiodothyronine, ob/ob mice
- MeSH terms
- Adipose Tissue, Animals, Adipose Tissue, Brown, Gene Expression Regulation, Insulin, Mice, Obese, Mitochondria, Phenotype, Proteins, Thinness, Mice, Knockout, Leptin, Gene Expression Profiling, Mice
About these checks
Registry, retraction, Cites and statistics results are computed, not judged, with one exception: a printed reference that no index lists is read once by a model before it counts as a citation error. Claims are extracted by a model and kept only when their quote appears verbatim in the text; each cited source is then checked, with a model’s help, for whether it says what the claim relies on. Those verdicts can be wrong — read the claim’s quote and the cited source before relying on one.
Statistics and arithmetic are recomputed, not judged.
Confidence bands are shown only for fields calibrated on our annotated test set. None is calibrated yet, so no band is shown.
What counts as a claim ›How we measure confidence ›How we check this ›
Are you an author, or do you see a problem with this page? Request a review
