

The DOI matches its Crossref record; 49 of the 51 references it cites were found in a registry or an index.
Myostatin Inhibition in Muscle, but Not Adipose Tissue, Decreases Fat Mass and Improves Insulin Sensitivity
Open accessAbstract
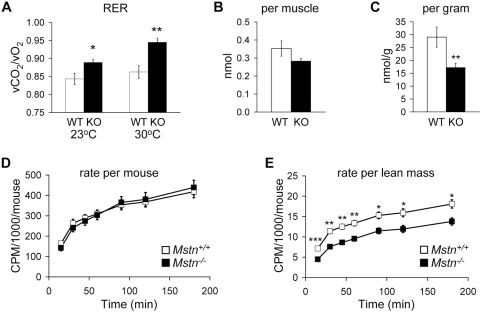
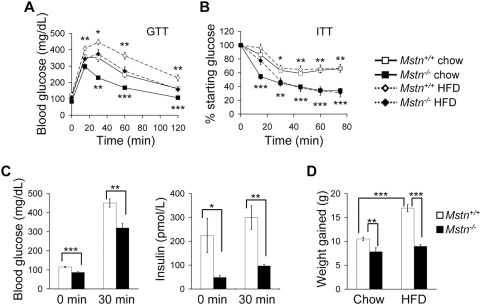
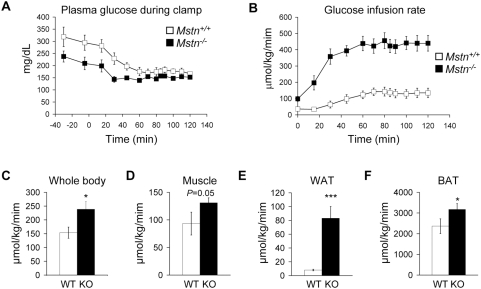
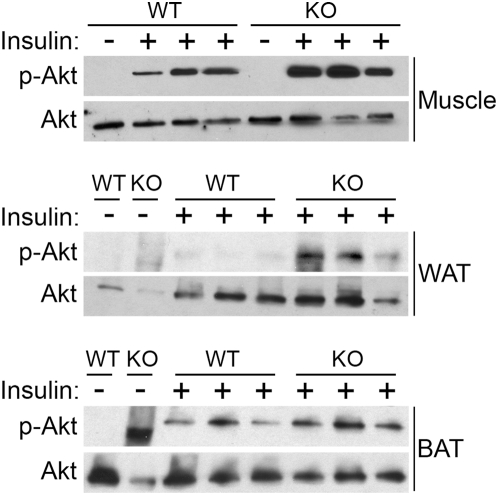
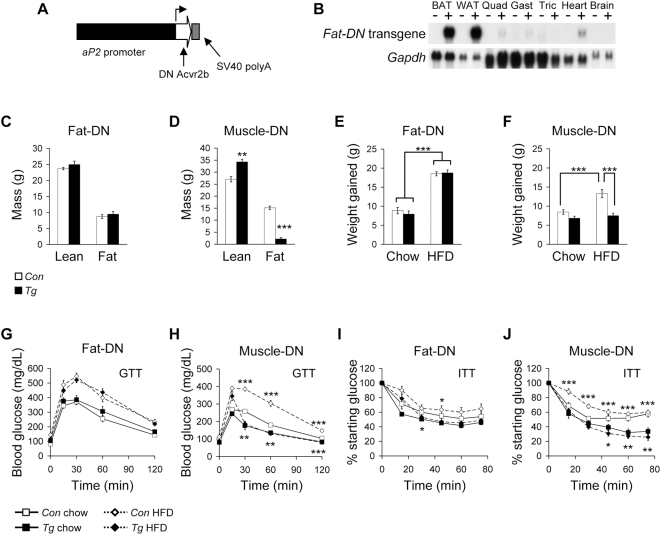
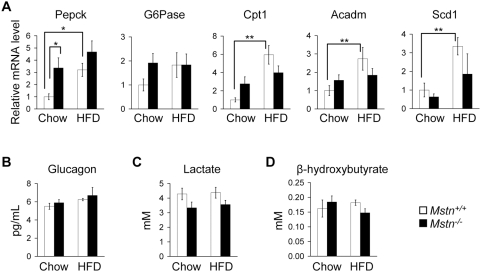
Myostatin (Mstn) is a secreted growth factor expressed in skeletal muscle and adipose tissue that negatively regulates skeletal muscle mass. Mstn(-/-) mice have a dramatic increase in muscle mass, reduction in fat mass, and resistance to diet-induced and genetic obesity. To determine how Mstn deletion causes reduced adiposity and resistance to obesity, we analyzed substrate utilization and insulin sensitivity in Mstn(-/-) mice fed a standard chow. Despite reduced lipid oxidation in skeletal muscle, Mstn(-/-) mice had no change in the rate of whole body lipid oxidation. In contrast, Mstn(-/-) mice had increased glucose utilization and insulin sensitivity as measured by indirect calorimetry, glucose and insulin tolerance tests, and hyperinsulinemic-euglycemic clamp. To determine whether these metabolic effects were due primarily to the loss of myostatin signaling in muscle or adipose tissue, we compared two transgenic mouse lines carrying a dominant negative activin IIB receptor expressed specifically in adipocytes or skeletal muscle. We found that inhibition of myostatin signaling in adipose tissue had no effect on body composition, weight gain, or glucose and insulin tolerance in mice fed a standard diet or a high-fat diet. In contrast, inhibition of myostatin signaling in skeletal muscle, like Mstn deletion, resulted in increased lean mass, decreased fat mass, improved glucose metabolism on standard and high-fat diets, and resistance to diet-induced obesity. Our results demonstrate that Mstn(-/-) mice have an increase in insulin sensitivity and glucose uptake, and that the reduction in adipose tissue mass in Mstn(-/-) mice is an indirect result of metabolic changes in skeletal muscle. These data suggest that increasing muscle mass by administration of myostatin antagonists may be a promising therapeutic target for treating patients with obesity or diabetes.
Overview
The claims and statistics of this paper haven’t been checked yet.
Run the check — free, no account needed. It reads the open-access text and checks the sources it cites.
Integrity signals
Registry
Cites
Statistics
Figures
Verification
Claims the paper makes
The claims and statistics of this paper haven’t been checked yet.
Run the check — free, no account needed. It reads the open-access text and checks the sources it cites.
Claims other papers make about this one
Each is checked against this paper’s own text: does it say what the citing paper says it does?
The cited source doesn’t support the claim as written.
In the citing paper
“Its importance in this tissue is related to the maintenance of adipose mass and greater sensitivity to insulin (Hamrick et al., 2006; Guo et al., 2009).”
From Physical Exercise-Induced Myokines and Muscle-Adipose Tissue Crosstalk: A Review of Current Knowledge and the Implications for Health and Metabolic Diseases (2018) · cites this paper as Guo et al., 2009
Checked by a reasoning model — may be wrong.
Experimental — accuracy not yet measuredThe source backs part of the claim, not all of it — or backs it for a different population, condition or comparison.
In the citing paper
“Evidence that myostatin needs to act on skeletal muscle to cause fat loss comes from a study where the knock out myostatin receptor in adipose tissue had no effect on body composition, weight gain, or glucose and insulin tolerance in mice fed a standard or high-fat diet [181].”
From Effects of Skeletal Muscle Hypertrophy on Fat Mass and Glucose Homeostasis in Humans and Animals: A Narrative Review with Systematic Literature Search (2025) · cites this paper as [181]
Experimental — accuracy not yet measuredThe source backs part of the claim, not all of it — or backs it for a different population, condition or comparison.
In the citing paper
“For example, the stimulation of skeletal muscle hypertrophy by expressing constitutively active Akt1 [22] only within muscle, or by knocking down the myostatin (i.e., activin IIB) receptor only in muscle [181], demonstrates that muscle hypertrophy is sufficient to cause fat loss and improve glucose homeostasis as secondary effects.”
From Effects of Skeletal Muscle Hypertrophy on Fat Mass and Glucose Homeostasis in Humans and Animals: A Narrative Review with Systematic Literature Search (2025) · cites this paper as [181]
Experimental — accuracy not yet measuredThe source backs part of the claim, not all of it — or backs it for a different population, condition or comparison.
In the citing paper
“It also exerts a significant regulatory influence on adipose tissue function, energy metabolism, and systemic energy homeostasis [62].”
From Exercise-Induced Muscle–Fat Crosstalk: Molecular Mediators and Their Pharmacological Modulation for the Maintenance of Metabolic Flexibility in Aging (2025) · cites this paper as [62]
Experimental — accuracy not yet measuredThe source backs part of the claim, not all of it — or backs it for a different population, condition or comparison.
In the citing paper
“However, myostatin is not exclusively secreted by SkM tissue, with studies indicating that AT also secretes this protein.”
From Physical Exercise-Induced Myokines and Muscle-Adipose Tissue Crosstalk: A Review of Current Knowledge and the Implications for Health and Metabolic Diseases (2018) · cites this paper as Guo et al., 2009
Experimental — accuracy not yet measured
In the citing paper
“Adipocyte-specific expression of a dominant negative form of Acvr2b did not induce any changes in body composition, suggesting that changes in fat mass are not directly due to loss of ActRII signaling in adipose tissue [26].”
From Antibody blockade of activin type II receptors preserves skeletal muscle mass and enhances fat loss during GLP-1 receptor agonism (2024) · cites this paper as [26]
Self-check
Percentages, sums and reported differences re-computed from the paper’s own numbers.
The self-check needs the paper’s full text.
Citations
Cites
Regulation of skeletal muscle mass in mice by a new TGF-p superfamily member
McPherron, A. C., Lawler, A. M., & Lee, S.-J. (1997) · Nature · doi:10.1038/387083a0 · Cited by 4,013
Self-citationRegulation of myostatin activity and muscle growth
Lee, S.-J., & McPherron, A. C. (2001) · Proceedings of the National Academy of Sciences · doi:10.1073/pnas.151270098 · Cited by 1,616
Self-citationFolland, J. P., & Williams, A. G. (2007) · Sports Medicine · doi:10.2165/00007256-200737020-00004 · Cited by 1,347
Musarò, A., McCullagh, K., Paul, A., Houghton, L., Dobrowolny, G., Molinaro, M., Barton, E. R., L Sweeney, H., & Rosenthal, N. (2001) · Nature Genetics · doi:10.1038/84839 · Cited by 1,137
Physical Activity/Exercise and Type 2 Diabetes
Sigal, R. J., Kenny, G. P., Wasserman, D. H., Castaneda-Sceppa, C., & White, R. D. (2006) · Diabetes Care · doi:10.2337/dc06-9910 · Cited by 949
Induction of Cachexia in Mice by Systemically Administered Myostatin
Zimmers, T. A., Davies, M. V., Koniaris, L. G., Haynes, P. A., Esquela‐Kerscher, A., Tomkinson, K. N., McPherron, A. C., Wolfman, N. M., & Lee, S. (2002) · Science · doi:10.1126/science.1069525 · Cited by 908
Self-citationFunctional improvement of dystrophic muscle by myostatin blockade
Bogdanovich, S., Krag, T. O. B., Barton, E. R., Morris, L. D., Whittemore, L.-A., Ahima, R. S., & Khurana, T. S. (2002) · Nature · doi:10.1038/nature01154 · Cited by 831
REGULATION OF MUSCLE MASS BY MYOSTATIN
Lee, S.-J. (2004) · Annual Review of Cell and Developmental Biology · doi:10.1146/annurev.cellbio.20.012103.135836 · Cited by 819
Life without white fat: a transgenic mousePreprint
Moitra, J., Mason, M. M., Olive, M., Krylov, D. Y., Gavrilova, O., Marcus‐Samuels, B., Feigenbaum, L., Lee, E., Aoyama, T., Eckhaus, M., et al. (1998) · Genes & Development · doi:10.1101/gad.12.20.3168 · Cited by 776
Self-citationInhibition of myostatin in adult mice increases skeletal muscle mass and strength
Whittemore, L.-A., Song, K., Li, X., Aghajanian, J. D., Davies, M. V., Girgenrath, S., Hill, J. J., Jalenak, M., Kelley, P. E., Knight, A., et al. (2003) · Biochemical and Biophysical Research Communications · doi:10.1016/s0006-291x(02)02953-4 · Cited by 512
Suppression of body fat accumulation in myostatin-deficient mice
McPherron, A. C., & Lee, S.-J. (2002) · Journal of Clinical Investigation · doi:10.1172/jci0213562 · Cited by 505
Self-citationRegulation of muscle growth by multiple ligands signaling through activin type II receptors
Lee, S.-J., Reed, L. A., Davies, M. V., Girgenrath, S., Goad, M. E. P., Tomkinson, K. N., Wright, J. F., Barker, C., Ehrmantraut, G., Holmstrom, J., et al. (2005) · Proceedings of the National Academy of Sciences · doi:10.1073/pnas.0505996102 · Cited by 501
McFarlane, C., Plummer, E., Thomas, M., Hennebry, A., Ashby, M. G., Ling, N., Smith, H., Sharma, M., & Kambadur, R. (2006) · Journal of Cellular Physiology · doi:10.1002/jcp.20757 · Cited by 496
The transforming growth factor-β superfamily of receptors
de Caestecker, M. (2004) · Cytokine & Growth Factor Reviews · doi:10.1016/j.cytogfr.2003.10.004 · Cited by 464
Activation of latent myostatin by the BMP-1/tolloid family of metalloproteinases
Wolfman, N. M., McPherron, A. C., Pappano, W. N., Davies, M. V., Song, K., Tomkinson, K. N., Wright, J. F., Zhao, L., Sebald, S. M., Greenspan, D. S., et al. (2003) · Proceedings of the National Academy of Sciences · doi:10.1073/pnas.2534946100 · Cited by 454
Self-citationHill, J. J., Davies, M. V., Pearson, A. A., Wang, J. H., Hewick, R. M., Wolfman, N. M., & Qiu, Y. (2002) · Journal of Biological Chemistry · doi:10.1074/jbc.m206379200 · Cited by 444
Conditional Activation of Akt in Adult Skeletal Muscle Induces Rapid Hypertrophy
Lai, K.-M. V., Gonzalez, M., Poueymirou, W. T., Kline, W. O., Na, E., Zlotchenko, E., Stitt, T. N., Economides, A. N., Yancopoulos, G. D., & Glass, D. J. (2004) · Molecular and Cellular Biology · doi:10.1128/mcb.24.21.9295-9304.2004 · Cited by 442
Fast/Glycolytic Muscle Fiber Growth Reduces Fat Mass and Improves Metabolic Parameters in Obese Mice
Izumiya, Y., Hopkins, T., Morris, C., Sato, K., Zeng, L., Viereck, J., Hamilton, J. A., Ouchi, N., LeBrasseur, N. K., & Walsh, K. (2008) · Cell Metabolism · doi:10.1016/j.cmet.2007.11.003 · Cited by 395 · cited 10×
“Constitutively active Akt1 mice have an increase in expression in liver of genes encoding enzymes involved in gluconeogenesis, phosphoenolpyruvate carboxykinase (Pepck) and glucose 6-phosphatase (G6Pase), and an increase in serum levels of glucagon, which stimulates gluconeogenesis [29].”
InfluentialTroglitazone action is independent of adipose tissue.
Burant, C., Sreenan, S., Hirano, K., Tai, T. A., Lohmiller, J. J., Lukens, J. N., Davidson, N. O., Ross, S. R., & Graves, R. A. (1997) · Journal of Clinical Investigation · doi:10.1172/jci119839 · Cited by 331
Myostatin Knockout in Mice Increases Myogenesis and Decreases Adipogenesis
Lin, J., Arnold, H. B., Della-Fera, M. A., Azain, M. J., Hartzell, D. L., & Baile, C. A. (2002) · Biochemical and Biophysical Research Communications · doi:10.1006/bbrc.2002.6500 · Cited by 313
Myostatin propeptide‐mediated amelioration of dystrophic pathophysiology
Bogdanovich, S., Perkins, K. J., Krag, T. O. B., Whittemore, L.-A., & Khurana, T. S. (2005) · The FASEB Journal · doi:10.1096/fj.04-2796com · Cited by 244
Girgenrath, S., Song, K., & Whittemore, L.-A. (2004) · Muscle & Nerve · doi:10.1002/mus.20175 · Cited by 238
Yang, W., Zhang, Y., Li, Y., Wu, Z., & Zhu, D. (2006) · Journal of Biological Chemistry · doi:10.1074/jbc.m610185200 · Cited by 221
Torpor in mice is induced by both leptin-dependent and -independent mechanisms
Gavrilova, O., Leon, L. R., Marcus‐Samuels, B., Mason, M. M., Castle, A. L., Refetoff, S., Vinson, C., & Reitman, M. L. (1999) · Proceedings of the National Academy of Sciences · doi:10.1073/pnas.96.25.14623 · Cited by 213
Self-citationMyostatin modulates adipogenesis to generate adipocytes with favorable metabolic effects
Feldman, B. J., Streeper, R. S., Farese, R. V., & Yamamoto, K. R. (2006) · Proceedings of the National Academy of Sciences · doi:10.1073/pnas.0607501103 · Cited by 211
Artaza, J. N., Bhasin, S., Magee, T. R., Reisz‐Porszasz, S., Shen, R., Groome, N. P., Fareez, M. M., & González-Cadavid, N. F. (2005) · Endocrinology · doi:10.1210/en.2005-0362 · Cited by 206
Transgenic expression of myostatin propeptide prevents diet-induced obesity and insulin resistance
Zhao, B., Wall, R. J., & Yang, J. (2005) · Biochemical and Biophysical Research Communications · doi:10.1016/j.bbrc.2005.09.044 · Cited by 186
Allen, D. L., Cleary, A. S., Speaker, K. J., Lindsay, S. F., Uyenishi, J., Reed, J. M., Madden, M. C., & Mehan, R. S. (2008) · American Journal of Physiology-Endocrinology and Metabolism · doi:10.1152/ajpendo.00798.2007 · Cited by 183
ski can cause selective growth of skeletal muscle in transgenic mice.Preprint
Sutrave, P., Kelly, A. M., & Hughes, S. H. (1990) · Genes & Development · doi:10.1101/gad.4.9.1462 · Cited by 173
Myostatin promotes the terminal differentiation of embryonic muscle progenitorsPreprint
Manceau, M., Gros, J., Savage, K., Thomé, V., McPherron, A. C., Paterson, B., & Marcelle, C. (2008) · Genes & Development · doi:10.1101/gad.454408 · Cited by 171
Self-citationGamer, L. W., Wolfman, N. M., Celeste, A. J., Hattersley, G., Hewick, R. M., & Rosen, V. (1999) · Developmental Biology · doi:10.1006/dbio.1998.9191 · Cited by 170
Contractile properties of EDL and soleus muscles of myostatin-deficient mice
Mendias, C. L., Marcin, J. E., Calerdon, D. R., & Faulkner, J. A. (2006) · Journal of Applied Physiology · doi:10.1152/japplphysiol.00126.2006 · Cited by 170
Identification of a Novel Pool of Extracellular Pro-myostatin in Skeletal Muscle
Anderson, S. B., Goldberg, A. L., & Whitman, M. (2008) · Journal of Biological Chemistry · doi:10.1074/jbc.m706678200 · Cited by 159
FSTL3 deletion reveals roles for TGF-β family ligands in glucose and fat homeostasis in adults
Mukherjee, A., Sidis, Y., Mahan, A. L., Raher, M. J., Xia, Y. Y., Rosen, E. D., Bloch, K. D., Thomas, M. K., & Schneyer, A. L. (2007) · Proceedings of the National Academy of Sciences · doi:10.1073/pnas.0607966104 · Cited by 159
Myostatin Regulates Cardiomyocyte Growth Through Modulation of Akt Signaling
Morissette, M. R., Cook, S. A., Foo, S., McKoy, G., Ashida, N., Novikov, M., Scherrer‐Crosbie, M., Li, L., Matsui, T., Brooks, G., et al. (2006) · Circulation Research · doi:10.1161/01.res.0000231290.45676.d4 · Cited by 156
Yu, S., Gavrilova, O., Chen, H., Lee, R., Liu, J., Pacák, K., Parlow, A. F., Quon, M. J., Reitman, M. L., & Weinstein, L. S. (2000) · Journal of Clinical Investigation · doi:10.1172/jci8437 · Cited by 151
Self-citationPatel, K., & Amthor, H. (2005) · Neuromuscular Disorders · doi:10.1016/j.nmd.2004.10.018 · Cited by 136
Inhibition of Preadipocyte Differentiation by Myostatin Treatment in 3T3-L1 Cultures
Kim, H., Liang, L., Dean, R. G., Hausman, D. B., Hartzell, D. L., & Baile, C. A. (2001) · Biochemical and Biophysical Research Communications · doi:10.1006/bbrc.2001.4435 · Cited by 127
Genetic Analysis of the Role of Proteolysis in the Activation of Latent Myostatin
Lee, S.-J. (2008) · PLoS ONE · doi:10.1371/journal.pone.0001628 · Cited by 114
Mitochondrial oxidative function and type 2 diabetes
Rabøl, R., Boushel, R., & Dela, F. (2006) · Applied Physiology, Nutrition, and Metabolism · doi:10.1139/h06-071 · Cited by 113
Leptin Improves Insulin Resistance and Hyperglycemia in a Mouse Model of Type 2 Diabetes
Toyoshima, Y., Gavrilova, O., Yakar, S., Jou, W., Pack, S., Shyr, Z. A., Wheeler, M. B., & LeRoith, D. (2005) · Endocrinology · doi:10.1210/en.2005-0087 · Cited by 108
Self-citationBeneficial metabolic effects of M3 muscarinic acetylcholine receptor deficiency
Gautam, D., Gavrilova, O., Jeon, J., Pack, S., Jou, W., Cui, Y., Li, J. H., & Wess, J. (2006) · Cell Metabolism · doi:10.1016/j.cmet.2006.09.008 · Cited by 90
Self-citationBogdanovich, S., McNally, E. M., & Khurana, T. S. (2007) · Muscle & Nerve · doi:10.1002/mus.20920 · Cited by 77
M ETABOLIC L ESSONS FROM G ENETICALLY L EAN M ICE
Reitman, M. L. (2002) · Annual Review of Nutrition · doi:10.1146/annurev.nutr.22.010402.102849 · Cited by 75
Myostatin Is a Human Placental Product That Regulates Glucose Uptake
Mitchell, M. D., Osepchook, C. C., Leung, K.-C., McMahon, C. D., & Bass, J. J. (2006) · The Journal of Clinical Endocrinology & Metabolism · doi:10.1210/jc.2005-2361 · Cited by 67
Resistance to body fat gain in ‘double-muscled’ mice fed a high-fat diet
Hamrick, M. W., Pennington, C., Webb, C. N., & Isales, C. M. (2006) · International Journal of Obesity · doi:10.1038/sj.ijo.0803200 · Cited by 66
Sprinting without myostatin: a genetic determinant of athletic prowess
Lee, S. (2007) · Trends in Genetics · doi:10.1016/j.tig.2007.08.008 · Cited by 62
Sigal, R. J., Kenny, G. P., Boulé, N. G., Wells, G. A., Prud'homme, D., Fortier, M., Reid, R. D., Tulloch, H., Coyle, D., Phillips, P., et al. (2007) · Annals of Internal Medicine · doi:10.7326/0003-4819-147-6-200709180-00005 · Cited by 48
Administration of myostatin does not alter fat mass in adult mice
Stolz, L. E., Li, D., Qadri, A., Jalenak, M., Klaman, L. D., & Tobin, J. F. (2006) · Diabetes Obesity and Metabolism · doi:10.1111/j.1463-1326.2006.00672.x · Cited by 40
Cited by
Sorted by citations
Muscles, exercise and obesity: skeletal muscle as a secretory organ
Pedersen, B. K., & Febbraio, M. A. (2012) · Nature Reviews Endocrinology · doi:10.1038/nrendo.2012.49 · Cited by 2,909
Exercise is the real polypill.
Fiuza-Luces, C., Garatachea, N., Berger, N. A., & Lucia, A. (2013) · Physiology · doi:10.1152/physiol.00019.2013 · Cited by 791
Insulin resistance and sarcopenia: mechanistic links between common co-morbidities
Cleasby, M. E., Jamieson, P. M., & Atherton, P. J. (2016) · Journal of Endocrinology · doi:10.1530/joe-15-0533 · Cited by 596
Pedersen, B. K. (2013) · Comprehensive physiology · doi:10.1002/cphy.c120033 · Cited by 516
PGC-1α as a Pivotal Factor in Lipid and Metabolic Regulation
Cheng, C., Ku, H., & Lin, H. (2018) · International Journal of Molecular Sciences · doi:10.3390/ijms19113447 · Cited by 450
Metadata
- Authors
- Guo, T., Jou, W., Chanturiya, T., Portas, J., Gavrilova, O., & McPherron, A. C.
- Affiliations
- National Institutes of Health (US)
- Corresponding author
- McPherron, Alexandra C.
- Venue
- PLoS ONE
- Publisher
- Public Library of Science (PLoS)
- Published
- 2009-03-19
- Volume
- 4
- Issue
- 3
- Pages
- e4937
- ISSN
- 1932-6203 (ISSN-L)
- PMC
- PMC2654157
- OpenAlex
- W2028966038
- Cited by
- 402
- References
- 51
- Citations by year
- 2026: 17 · 2025: 18 · 2024: 20 · 2023: 17 · 2022: 27 · 2021: 31 · 2020: 23 · 2019: 25 · 2018: 15 · 2017: 23 · 2016: 17 · 2015: 28 · 2014: 27 · 2013: 29 · 2012: 27
- FWCI
- 11.40
- Type
- journal article
- Language
- en
- Open access
- gold
- doi.org
- Licence
- Locations
- PLoS ONE (publishedVersion, public-domain)
- PubMed Central (publishedVersion, public-domain)
- PubMed (publishedVersion)
- DOAJ (DOAJ: Directory of Open Access Journals) (submittedVersion)
- Figshare (submittedVersion, cc-by)
- Funders
- Johns Hopkins University
- National Institutes of Health
- National Institute of Diabetes and Digestive and Kidney Diseases
- Topics
- Life Sciences › Biochemistry, Genetics and Molecular Biology › Molecular Biology › Muscle Physiology and Disorders
- Health Sciences › Medicine › Endocrinology, Diabetes and Metabolism › Adipokines, Inflammation, and Metabolic Diseases
- Health Sciences › Medicine › Physiology (medical) › Adipose Tissue and Metabolism
- Keywords
- myostatin, Mstn knockout mice, skeletal muscle, adipose tissue, fat mass, insulin sensitivity, glucose metabolism, lipid oxidation, diet-induced obesity, obesity resistance, muscle mass, high-fat diet, diabetes treatment
- MeSH terms
- Adipose Tissue, Animals, Diet, Dietary Fats, Glucose, Humans, Insulin, Insulin Resistance, Male, Mice, Inbred C57BL, Oxidation-Reduction, Glucose Clamp Technique, Signal Transduction, Mice, Knockout, Muscle, Skeletal, Lipid Metabolism, Proto-Oncogene Proteins c-akt, Mice, Myostatin
About these checks
Registry, retraction, Cites and statistics results are computed, not judged, with one exception: a printed reference that no index lists is read once by a model before it counts as a citation error. Claims are extracted by a model and kept only when their quote appears verbatim in the text; each cited source is then checked, with a model’s help, for whether it says what the claim relies on. Those verdicts can be wrong — read the claim’s quote and the cited source before relying on one.
Statistics and arithmetic are recomputed, not judged.
Confidence bands are shown only for fields calibrated on our annotated test set. None is calibrated yet, so no band is shown.
What counts as a claim ›How we measure confidence ›How we check this ›
Are you an author, or do you see a problem with this page? Request a review
